Gold Buyers Regain Momentum — Aiming for 4,240 RetestHello traders! Let’s break down the current XAUUSD structure. Gold is trading within a broad ascending structure after forming a strong local bottom around the Support Line, where buyers entered the market and started to push the price higher. This upward movement follows a long corrective phase, during which the price respected the diagonal Support Line multiple times — confirming the presence of a stable bullish trend. Earlier, XAUUSD broke out of the Buyer Zone (4,110–4,120), retested it, and successfully held above it. This zone now acts as a key demand area and the primary level where buyers continue defending the trend. A previous bearish attempt failed here, forming a fake breakout and leading to a new bullish impulse. The price is now approaching the descending Resistance Line, which has repeatedly pushed gold lower during the recent correction. A clean breakout above this trendline may open the way for the price to move toward the major Resistance Level at 4,240.00, which also aligns with the first take-profit area (TP1). This Resistance Level has acted as a strong reaction zone multiple times, causing sharp pullbacks and marking the boundaries of the Seller Zone. Buyers will likely face significant opposition here once again. If gold respects the Buyer Zone and maintains trading above 4,110, the bullish scenario remains intact, and the price may push toward TP1 → 4,240. A confirmed breakout above this level would signal continuation toward higher targets within the broader bullish structure. However, if XAUUSD fails to hold the Buyer Zone and breaks below 4,110, the bullish outlook becomes invalid. In this case, the price may revisit the lower trendline or enter a deeper correction toward previous support areas. For now, the structure remains moderately bullish, with buyers dominating as long as the price stays above demand and respects the ascending Support Line. Please share this idea with your friends and click "Boost" 🚀
Range

EURUSD Long: Upside Pressure Targets Retest of 1.1610 LevelHello traders! EURUSD is forming a clear technical structure after reacting precisely to both the Supply and Demand levels, creating a clean sequence of trend shifts and breakout points. Earlier, the pair moved inside a strong Descending Channel, where each retest of the upper boundary produced sharp bearish impulses. This confirmed that sellers were fully in control during that phase. A breakout from the channel led to a short consolidation Range, showing temporary buyer accumulation before a trend reversal. Following this accumulation, EURUSD entered an Ascending Channel, where price consistently made higher highs and higher lows. Multiple breakouts occurred along the way, showing how buyers gained strength while defending each pullback. However, an important Fake Breakout near 1.1570 revealed that bullish momentum was still fragile, and price slipped back into the channel before resuming the upward movement.
Currently,, the market formed a clear Inverse Head and Shoulders reversal pattern at the bottom, located directly inside the 1.1500–1.1520 Demand Zone. This zone acted as a major support cluster, generating strong bullish reactions. After confirming the neckline breakout, EURUSD rallied aggressively toward the current structure. At the moment, price is pushing higher and approaching the 1.16100 Supply Zone, which has repeatedly acted as resistance in previous market swings. This level is now the main obstacle for bulls and the next key reaction zone.
My scenario as long as EURUSD remains above the 1.15700 Demand Zone, the bullish trend structure remains intact. A continuation toward the 1.16100 Supply Zone (TP1) is the most likely scenario. This level is expected to create the next significant reaction, as it aligns with previous selling pressure. A clean breakout above 1.16100 would reinforce the bullish momentum and open the path toward the next upside levels. However, if EURUSD rejects the supply area, a pullback toward 1.15700–1.15500 may occur before buyers attempt another upward move. Only a breakdown below the demand zone would weaken the bullish outlook and shift momentum back toward sellers. For now, the market favors buying pullbacks into demand while monitoring reactions closely at the 1.16100 resistance. Manage your risk!

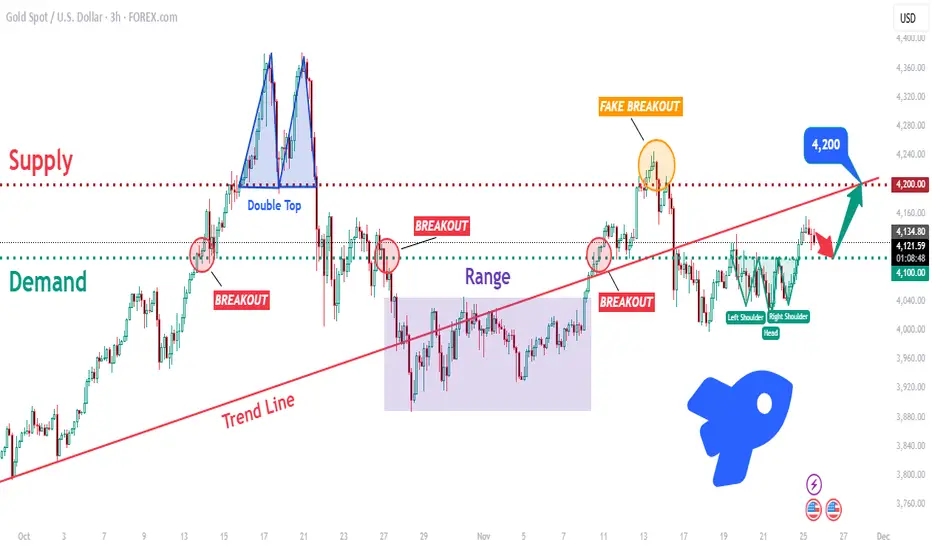
XAUUSD: Bulls Defend 4100! Is a Breakout to 4220 Imminent?Hello traders! XAUUSD continues to trade within a broader bullish structure, but with repeated volatility around key zones. The chart highlights how Gold has reacted multiple times to the major Demand Zone near 4,100, which has consistently acted as a strong support area. Each dip into this zone triggered a bullish response, confirming active buyers. Earlier in the structure, price formed a clear Double Top inside the Supply Zone around 4,220–4,230, which led to a strong bearish reversal and a breakdown below the trend line. After that, Gold entered a prolonged Range Phase, where the market consolidated sideways before breaking out to the upside. Recently, XAUUSD attempted a bullish continuation, but the move resulted in a Fake Breakout above the supply zone, signaling that buyers lacked the strength to maintain momentum above 4,220. This rejection pushed price downward and back below the main Trend Line, which now acts as dynamic resistance.
Currently, Gold is trading above the 4,100 Demand Zone, forming a potential Inverse Head and Shoulders pattern — an early sign that buyers may be preparing for another upward push. As long as price holds above 4,100 and stays above local structure, the bullish scenario remains valid.
My scenario, if XAUUSD holds above the 4,100 Demand Zone, buyers may gain momentum and attempt another breakout toward the 4,200–4,220 Supply Zone, which is the next major resistance and the primary upside target. A sustained break above 4,220 would confirm bullish strength and could open the path toward higher continuation targets. However, if buyers fail to hold the 4,100 level, Gold may drop back into the previous range or retest lower support areas before attempting another reversal. For now, the bias is moderately bullish, supported by demand reactions and reversal patterns — but a confirmed breakout above 4,200 is needed for stronger trend continuation. Manage your risk!
BTCUSD: Buyers Preparing for a Move Toward $90,000Hello everyone, here is my breakdown of the current Bitcoin setup.
Market Analysis
BTCUSD continues to recover after a prolonged downtrend, where the market consistently respected the descending Trend Line and formed a series of Range structures. Each range acted as a consolidation phase inside the broader bearish movement, with multiple breakdowns continuing the trend to the downside. Despite occasional bullish breakouts, none of them were strong enough to reverse the bearish structure, leading to further declines. Eventually, price reached the Support Zone around $84,000–$85,000, where the market produced a fake breakdown, signaling initial buyer activity. This fake breakout formed a local bottom that became the base for a reversal attempt. Following this reaction, BTCUSD began forming an Upward Channel, marking a shift in market structure from bearish to early-stage bullish. Inside this channel, price has started to create higher highs and higher lows—an essential signal of growing bullish momentum. The structure remains clean and technical: every pullback respects the lower boundary of the channel, while short impulses are reaching toward the midline of the structure. Buyers are gradually gaining control.
Currently, BTCUSD is stabilizing above the Support Zone while trading near the lower half of the ascending channel. As long as price respects this channel structure, sentiment remains bullish. The key area ahead is the Resistance Zone around $90,000, which previously acted as a pivot point and rejected bullish attempts multiple times. A clean breakout above this zone would confirm broader bullish strength.
Scenario & Strategy
I expect BTCUSD to continue moving inside the Upward Channel, gradually approaching the $90,000 Resistance Zone. A retest of this area is the most probable outcome if buyers maintain control. Short-term corrections may occur as the price approaches resistance, but overall structure favors a bullish continuation. A confirmed breakout above $90,000 could trigger a stronger move toward higher targets, opening the way for a larger trend reversal. This level remains the key barrier for buyers in the short and medium term.
However, if BTCUSD breaks down from the Upward Channel and falls below the $84,000 Support Zone, the bullish scenario becomes invalid. Such a move would likely signal a deeper correction or a return to bearish conditions. For now, buying the dips within the channel remains the more favorable approach as long as the structure stays intact and buyers continue defending support.
That's the setup I'm tracking. Thank you for your attention, and always manage your risk.

BTC Rebounds From 85K Support — Rally Toward 93K ResistanceHello traders! Let’s take a look at BTCUSD (Bitcoin). BTCUSD continues to trade within a broader corrective structure after a long bearish decline. Earlier, the market formed a large descending wedge, where price consistently respected both the Resistance Line and the Support Line. After the breakout from this wedge pattern, Bitcoin briefly turned bullish but soon entered a sideways Range, showing indecision and weakening momentum. The Range eventually broke to the downside, sending BTCUSD directly into the Seller Zone around $93,000, a key area that triggered several strong rejections in the past. A clean retest of this zone confirmed bearish pressure, leading to another impulsive drop. During the decline, price briefly pushed below the Support Zone near $85,000, creating a fake breakout, which trapped sellers and sparked a strong bullish reaction. From this point, buyers gained control and pushed price into a new ascending structure, supported by a rising Support Line shown on the chart. This indicates a shift in short-term momentum, with BTCUSD now forming higher highs and higher lows. Currently, Bitcoin is approaching the $93,000 Resistance Level, which aligns with the upper boundary of the previous Seller Zone. This is the key barrier for buyers. If price manages a clean breakout above this level, bullish continuation toward higher resistance zones becomes likely. As long as BTCUSD holds above the ascending Support Line and the $85,000 Support Area, the outlook remains bullish in the short term. From my perspective, BTCUSD is showing a short-term bullish continuation setup, supported by the ascending Support Line and the strong rejection from the $85,000 demand zone. If BTCUSD breaks back below $85,000, the bullish scenario becomes invalid, and a deeper correction could follow. For now, market structure supports a bullish recovery as long as buyers defend support and maintain the ascending trend. Please share this idea with your friends and click Boost 🚀

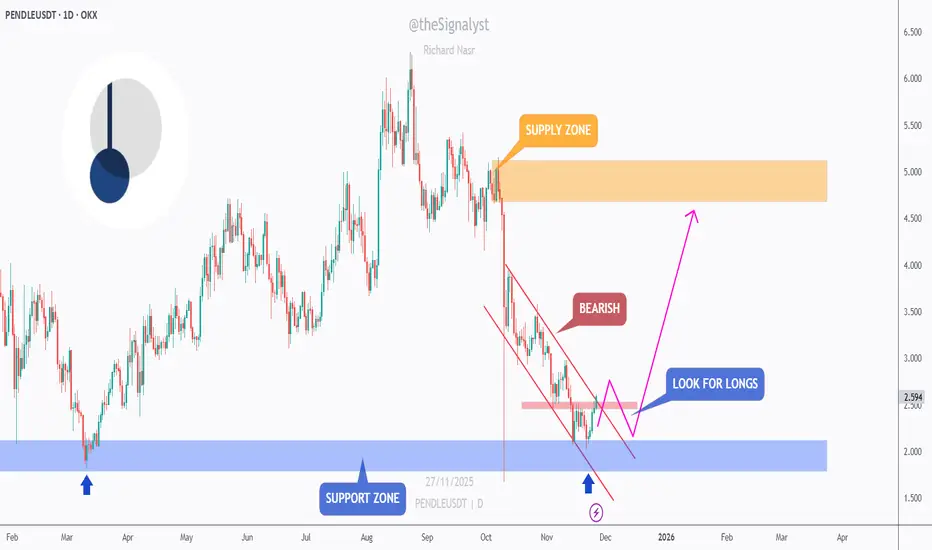
PENDLE - From Support to Setup… Bulls on Standby!📉PENDLE has been bearish for weeks, sliding inside a clean falling channel. But price is now reacting from a major support zone, the same area that initiated previous strong rallies earlier this year.
⚔️As long as this blue support zone holds, we will be looking for long setups, expecting a corrective move toward the upper bound of the falling channel. The first confirmation from the bulls will come after a break above the pink structure zone - the last lower high inside the correction.
Once that level is reclaimed, momentum could shift upward, opening the way for a larger move toward the supply zone around 5.00.
For now, PENDLE is positioned at a potential turning point… will the support zone spark the next bullish correction? 🤔
⚠️ Disclaimer: This is not financial advice. Always do your own research and manage risk properly.
📚 Stick to your trading plan regarding entries, risk, and management.
Good luck! 🍀
All Strategies Are Good; If Managed Properly!
~Richard Nasr
BTCUSD Long: Demand-Zone Rebound Targets $91,000 ResistanceHello traders! BTCUSD continues to trade inside a well-defined Descending Channel, confirming a strong bearish structure where the market consistently forms lower highs and lower lows. Throughout the chart, price repeatedly respects both channel boundaries, showing that sellers continue to dominate the trend. Earlier in the chart, Bitcoin created a Range Phase, indicating consolidation before sellers regained control and pushed price back down toward the mid-channel zone. Each time BTCUSD approached the channel’s upper boundary, it reacted with a clear pivot rejection, which initiated new downward waves — a classic pattern showing persistent sell-side pressure. A notable highlight is the Fake Breakout below the $84,000 area, where liquidity was swept before buyers stepped back in. This move created a strong reaction and initiated the current upward correction. The Demand Line drawn from recent lows has supported the price, helping BTCUSD climb back toward the mid-channel area.
Currently, Bitcoin is trading just above the $84,000 Demand Zone, which previously generated significant buying interest. The structure suggests that buyers may continue defending this zone, especially as price remains supported by the rising demand trendline. However, BTCUSD is still positioned below the $91,000–$92,000 Supply Zone, where sellers previously took control and where another reaction may occur.
My scenario, If buyers maintain momentum, price may attempt a corrective push toward the $91,000 resistance level — a key supply area aligned with the descending channel’s mid-line. A rejection here would be fully in line with the prevailing bearish trend. Manage your risk!

EURUSD: Fake Breakout Reversal Points to 1.1580 ResistanceHello everyone, here is my breakdown of the current Euro setup.
Market Analysis
EURUSD is currently trading within a broader Upward Channel, maintaining a medium-term bullish structure despite several corrective pullbacks. The chart shows that price has repeatedly respected both the channel’s lower boundary (around 1.1500–1.1510) and its upper boundary near 1.1650–1.1660, confirming the validity of this rising structure. Earlier in the move, EURUSD formed a Range Phase, followed by a clean Breakout, which established bullish momentum and pushed the pair higher toward the channel midpoint. Each breakout retest acted as support afterward, signaling strong buyer interest. However, the most recent movement shows a fake breakout below 1.1500, where sellers temporarily pushed price under support before it sharply recovered — a classic liquidity grab near the channel’s lower boundary.
Currently, EURUSD is trading just above the Support Zone (1.1500–1.1510) and forming an early bullish reaction. This area has repeatedly acted as demand and aligns with both channel support and the prior fake breakout region. The nearest obstacle for buyers remains the 1.1580 Resistance Level, which has consistently served as a rejection zone on multiple attempts. A sustained break above this level would confirm bullish control and allow price to retest higher channel areas.
My Scenario & Strategy
As long as EURUSD holds above the 1.1500–1.1510 Support Zone and stays within the upward channel, the bullish scenario remains valid. A corrective move upward is likely, with the first target at 1.1580 Resistance — a key level that aligns with previous breakout and retest points. A clean breakout above 1.1580 would signal continuation of bullish momentum, opening the path toward 1.1650–1.1660, located near the channel’s upper boundary and previous reaction zones.
Alternatively, if EURUSD fails to break 1.1580 and forms another rejection, sellers may attempt to push price back into the support area. A confirmed breakdown below 1.1500 would invalidate the current bullish structure and could shift the market toward a broader bearish correction. For now, long positions remain favorable while price stays above the channel’s lower boundary, with bullish continuation dependent on overcoming the 1.1580 resistance level.
That's the setup I'm tracking. Thank you for your attention, and always manage your risk.

XAUUSD: Buyers Aiming for a Rebound Toward $4,170 ResistanceHello everyone, here is my breakdown of the current Gold setup.
Market Analysis
XAUUSD continues to trade within a corrective structure, forming a broad Triangle Pattern defined by the Triangle Resistance Line above and the Triangle Support Line below. After a strong impulsive rally earlier, gold entered a prolonged consolidation phase, highlighted by a clear Range Zone where price repeatedly tested both the upper and lower boundaries without establishing a directional breakout. Several Breakouts occurred during this period, but each bullish attempt failed to secure continuation, leading to pullbacks that kept the market inside the broader consolidation. This showed clear indecision and a balanced battle between buyers and sellers.
Currently, gold retested the Support Zone around $4,040–$4,060, which coincides with the Triangle Support Line. A fake breakdown occurred below this level, but the market quickly bounced back, confirming strong demand and rejecting the bearish attempt. This rebound signals that buyers are actively defending the structure. Price is now stabilizing above support and showing early signs of bullish pressure. If buyers maintain control, the next logical target becomes the major Resistance Level at $4,170, which has acted as a key cap on previous bullish attempts. As long as XAUUSD stays above the Support Zone and trades within the rising trendline structure, the overall market bias remains moderately bullish.
Scenario & Strategy
I expect gold to gradually move upward from the current support area and retest the $4,170 Resistance Level. Minor corrections may occur along the way, but as long as price holds above $4,040, the bullish scenario remains valid. A clean breakout above $4,170 could trigger a stronger bullish continuation toward the next supply zone.
However, a breakdown below the Support Zone and Triangle Support Line would invalidate the bullish scenario and open the way for deeper correction. For now, buying the dips remains the more favorable approach as long as gold respects demand and stays within the triangle structure.
That's the setup I'm tracking. Thank you for your attention, and always manage your risk.

Anticipate Movement Inside of a Range EnvironmentA large portion of crypto price action does not trend. It ranges. And for many traders, this is where the most capital is lost. A range environment feels simple on the surface price moves between two boundaries, but inside those boundaries, liquidity builds, traps form, and false signals appear constantly. Understanding how ranges behave is a core skill for developing consistency.
A range forms when the market fails to create meaningful higher highs or lower lows. Buyers and sellers balance out, and price oscillates between defined support and resistance. This compression is not random. It reflects indecision, accumulation, or distribution depending on the higher-time frame context. Traders who treat a range like a trend are the ones most often punished.
The first step is identifying the boundaries. Equal highs at the top of a range and equal lows at the bottom reveal where stops accumulate. These stops become liquidity pools. Price frequently sweeps one side of the range before moving to the other, trapping breakouts and fading momentum traders. A clean sweep is not the breakout; it is the intention-revealing event before direction is chosen.
Inside the range, structural signals lose reliability. Traditional trend tools cannot be applied. Instead, focus on behaviour at the edges: rejection wicks, failed breakouts, displacement after a sweep, and reclaim patterns. These reactions show whether a sweep is simply clearing liquidity or if a genuine expansion is developing.
Patience is critical. Entering in the middle of the range exposes you to noise, uncertainty, and poor reward-to-risk. The edge comes from waiting at the boundaries where liquidity sits and confirmation appears. A range can persist far longer than expected, so forcing trades inside it leads to frustration and unnecessary losses.
The real purpose of studying ranges is not just to trade them but to anticipate what follows. A compression phase often precedes expansion. When liquidity on one side is taken and price breaks structure with intent, the next directional leg becomes far easier to participate in. Ranges are where future trends prepare themselves.

BTCUSD: Bulls Aim for Recovery Toward $92,000 Resistance ZoneHello everyone, here is my breakdown of the current Bitcoin setup.
Market Analysis
BTCUSD continues to move within a clearly defined Downward Channel, respecting both the descending resistance line and the lower support boundary. After a prolonged bearish continuation from the major Range structure seen earlier, Bitcoin broke several intermediate support levels before reaching the Support Zone around $84,000, where strong buyers stepped in. A Fake Breakout below the channel support triggered aggressive buying activity, sending the price back above the Support Zone and forming a short-term recovery structure. From this point, BTCUSD made a corrective bounce and even managed to break above a minor descending resistance, confirming a temporary shift in momentum.
Currently, price is approaching the Resistance Zone near $88,000–$90,000, which aligns with the upper boundary of the Downward Channel. This area has previously generated strong sell-offs and remains the key obstacle for buyers. A clean breakout above $90,000 would signal bullish continuation and may lead to a deeper recovery toward the next liquidity cluster near $92,000–$94,000. As long as BTCUSD holds above the $84,000 Support Zone, the short-term structure supports a bullish correction. However, if price gets rejected from the $90,000 resistance and fails to stay above support, sellers may regain control and push the market back toward the lower channel boundary.
My Scenario & Strategy
From my perspective, BTCUSD maintains a bullish corrective outlook while respecting the Support Zone around $84,000. The first target remains the $90,000 Resistance Zone, which matches both horizontal resistance and the channel’s upper boundary. A confirmed breakout above $90,000 would open the path toward $92,000–$94,000, where the next reaction levels are located. I will look for long opportunities during pullbacks toward the Support Zone or along the rising minor trendline that formed after the fake breakout.
If BTCUSD breaks back below $84,000, the bullish scenario becomes invalid, and a continuation of the major downward trend may follow. For now, price action supports a bullish recovery setup as long as buyers defend the Support Zone.
That's the setup I'm tracking. Thank you for your attention, and always manage your risk.

XAUUSD Ascending Channel Strengthens: Bulls Target $4,130 TP1Hello traders! I want to share my view on the current XAUUSD setup. After a deep corrective move, gold has formed a local bottom around the Support Level at $4,000–$4,030, where strong buying pressure has re-entered the market. As shown on the chart, price is gradually climbing within a well-defined ascending channel, supported by the rising trendline and a parallel upper boundary. Inside this structure, the Buyer Zone has played a crucial role, providing the base for previous impulsive breakouts. Several fake breakdowns below the channel support confirmed the presence of significant demand. After these rebounds, XAUUSD twice reached the Seller Zone and the Resistance Level near $4,130, where it faced clear rejection and rotated back toward the Buyer Zone. Currently, gold is holding above the ascending channel support. If buyers continue to defend the $4,030 level and price remains stable within the Buyer Zone, I expect a move toward TP1 → $4,130, which is the nearest resistance. A clean breakout above this level would open the door for further bullish continuation toward the upper supply area around $4,200–$4,230. However, if the price breaks below the Buyer Zone and drops out of the channel, the bullish scenario becomes invalid, and the market may revisit the $4,000 support area. For now, the structure remains moderately bullish as long as price holds above demand and stays inside the ascending channel. Please share this idea with your friends and click Boost 🚀

EURUSD: Targets focus on declines to 1.1480 support levelHello everyone, here is my breakdown of the current Euro setup.
Market Analysis
EURUSD continues to trade within a clear Downward Channel, maintaining a strong bearish structure characterized by consistent lower highs and lower lows. Early in the chart, the pair formed a prolonged Range Phase, signaling indecision before sellers eventually took control and pushed the price downward. After breaking below the range, EURUSD repeatedly retested the Resistance Area around 1.1550, where the market showed strong bearish reactions. Each bounce into this resistance zone resulted in a clear rejection, proving that sellers consistently defend this area. The chart also highlights multiple Breakout attempts, all of which failed to sustain upward continuation, confirming a lack of bullish strength. Additionally, the chart shows the formation of a Triangle Pattern, with price reacting between the Triangle Resistance Line and the Triangle Support Line. Despite temporary recoveries, every move upward was limited and capped by descending trendline pressure.
Currently, EURUSD broke below the minor structure support again, demonstrating that bearish momentum remains dominant. Price is now heading toward the Support Zone near 1.1480, which aligns with both horizontal demand and the Triangle Support Line. This confluence makes it a key level to watch. As long as EURUSD trades below the 1.1550 Resistance Area and stays inside the Downward Channel, the bearish structure remains intact. Any bullish recovery is likely to be corrective rather than trend-changing unless buyers manage to break above major resistance.
My Scenario & Strategy
I expect EURUSD to continue edging lower toward the 1.1480 Support Zone, following the recent rejection from resistance. A minor upward correction may occur, potentially retesting broken support or the Triangle Resistance Line, but such a move would likely be short-lived without strong bullish confirmation.
A confirmed breakdown below 1.1480 would open the path for deeper bearish continuation within the Downward Channel. Only a solid breakout above 1.1550, backed by strong buying pressure, would challenge the prevailing bearish trend. For now, selling the pullbacks remains the more favorable strategy while price stays below major resistance.
That's the setup I'm tracking. Thank you for your attention, and always manage your risk.

XAUUSD: Price Holds Triangle Support, Aiming for $4,120Hello everyone, here is my breakdown of the current Gold setup.
Market Analysis
XAUUSD is trading within a broad symmetrical triangle structure, where price continues to respect both the Triangle Resistance Line and the Triangle Support Line. After a strong bullish rally inside the Upward Channel earlier, Gold reached the Resistance Area around $4,120–$4,130, where a sharp reversal occurred. This zone has consistently acted as a major supply level, triggering multiple corrections in recent sessions. Following the breakout below the Upward Channel, XAUUSD entered a consolidation phase supported by the Support Zone near $4,000, which aligns with the lower triangle boundary. This level has proven to be a key reaction zone, showing strong buyer interest each time price tested it.
Currently, Gold attempted another bullish push after bouncing from the Triangle Support Line. Price is now approaching the Resistance Area once again, but buyers face strong selling pressure around $4,080–$4,120, which overlaps with both horizontal resistance and the descending triangle boundary. A break and close above the Triangle Resistance Line would confirm bullish continuation and likely lead to a retest of higher liquidity levels near $4,180–$4,200. As long as XAUUSD stays above the $4,000 Support Zone, the broader structure remains bullish. However, sustained failure to break the resistance area may result in another corrective move back toward the Triangle Support Line.
My Scenario & Strategy
From my perspective, as long as Gold holds above $4,000, the bullish bias remains intact.
My near-term target (TP1) is the $4,120 Resistance Area, with potential extension toward $4,160–$4,200 if buyers manage a clean breakout above the triangle resistance. I will look for long entries on pullbacks toward the Triangle Support Line or the Support Zone around $4,000–$4,020, especially if bullish rejection patterns appear.
If XAUUSD breaks below the $4,000 level, the bullish setup becomes invalid and deeper correction toward $3,960–$3,920 may follow. For now, price action favors a bullish continuation setup, provided support continues to hold.
That's the setup I'm tracking. Thank you for your attention, and always manage your risk.

EURUSD Weakens at Resistance — Pullback Toward 1.1480 ExpectedHello traders! Let’s break down the current EURUSD structure. EURUSD continues to trade inside a broad descending channel, where both the resistance and support lines have been respected multiple times, forming a steady sequence of lower highs and lower lows. Each touch of the upper boundary resulted in a clear Turned Around reaction, confirming the strength of seller control within the overall bearish trend. Earlier, the pair entered a range phase in the left section of the chart, where price consolidated before breaking to the downside. This breakout accelerated bearish momentum, pushing EURUSD toward the lower half of the channel. Subsequent attempts at recovery formed shallow corrections, each aligning with the mid-channel dashed trendline, signaling persistent downward pressure. Recently, price approached the Buyer Zone near the 1.1480–1.1500 region, which also overlaps with the broader Support Level and the lower boundary of the descending channel. This area has previously acted as a strong reaction zone, and buyers are once again attempting to hold this level. At the moment, the EURUSD pair is showing early signs of a potential corrective rebound, with the price aiming for the nearest resistance level around 1.1540, which also coincides with the seller's zone. This region previously acted as support, and is now expected to serve as a barrier for a retest. As long as the pair remains below the descending resistance line, the broader trend remains bearish. A short-term correction to the level around 1.1540 is likely if buyers continue to defend the support level. However, a deviation from the resistance cluster could trigger renewed selling pressure, potentially sending EURUSD back to the channel bottom for another reaction. In my opinion, the price will move towards TP1 with a target of 1.14800. A confirmed break above the descending resistance line would be the first sign of a possible bullish shift, opening the door for a stronger recovery. Please share this idea with your friends and click "Boost" 🚀

BTCUSD Short: Descending Channel Targets $89,000 Demand ZoneHello traders! BTCUSD continues to trade within a clear descending channel, maintaining a strong bearish structure characterized by consecutive lower highs and lower lows. The price action repeatedly respected the channel boundaries, confirming solid seller control throughout the recent decline. Each time Bitcoin reached the upper boundary of the channel, it formed a pivot point, initiating another downward wave. Before the latest drop, BTCUSD spent some time moving sideways inside a Range Zone, showing temporary accumulation before sellers regained dominance. The bearish continuation led to another pivot formation near the channel’s resistance, triggering a fresh leg to the downside.
Currently, price has now approached the $89,000 Demand Zone, which aligns with the lower boundary of the descending channel. This level has acted as a significant reaction point, generating short-term bounces in previous price swings. The current positioning suggests that buyers may once again attempt to defend this zone. While below the $96,000 Supply Zone and the channel resistance, the broader trend remains bearish. BTCUSD is likely to experience a short-term corrective rebound from the demand area, aiming toward the $92,000–$93,500 region — a previous reaction cluster and local resistance.
My scenario is targeting the $89,000 level. However, if Bitcoin breaks below the $89,000 Demand Zone, it may trigger a deeper bearish continuation toward the lower liquidity areas around $88,000 or even lower. A confirmed breakout above $96,000 would be required to invalidate the bearish structure and signal a potential shift in momentum. For now, BTCUSD remains bearish, with a potential short-term correction from demand before further direction becomes clearer. Manage your risk!

BTCUSD: Bearish Momentum Aiming for New LowsHello everyone, here is my breakdown of the current Bitcoin setup.
Market Analysis
BTCUSD continues to follow a strong bearish market structure, consistently moving inside a well-defined Downward Channel. The chart clearly shows that after a prolonged consolidation phase inside the large Range, Bitcoin attempted both a fake breakout to the downside and a bullish breakout above the upper boundary — but neither attempt resulted in a sustained trend shift. This indicates that buyers lacked the strength to reverse the broader trend. Once price broke down from the range, BTCUSD established a clean sequence of lower highs and lower lows, forming two consecutive downward channels. Each retest of the channel’s upper boundary resulted in a strong bearish rejection, confirming heavy selling pressure at every corrective move upward.
Currently, the recent breakout below the minor support line inside the second downward channel once again demonstrates that sellers remain fully in control. Price is currently trading just above the major Support Zone around $90,400–$91,000, which has acted as a short-term demand area. However, the repeated bearish impulses and weak buyer reactions suggest decreasing bullish interest at these levels. BTCUSD is now hovering around support but forming a continuation pattern that leans toward further decline. Failure to break above the $96,000 Resistance Zone, aligned with previous structure and the former trendline, reinforces the bearish outlook.
My Scenario & Strategy
I expect that Bitcoin will likely attempt a minor corrective push to retest the broken support or the lower boundary of the channel — but any such move is expected to be short-lived unless strong buying pressure appears. After this corrective phase, BTCUSD may continue its decline toward the lower part of the channel and deeper support areas.
A confirmed breakdown below the current Support Zone ($90,400–$91,000) would strengthen the bearish scenario and open the path toward the next downside targets. Only a strong breakout above $96,000 — with clear bullish confirmation — would weaken the bearish bias and signal that buyers are stepping back into the market. For now, short positions remain more favorable, especially after corrective pullbacks into resistance zones within the downward channel structure.
That's the setup I'm tracking. Thank you for your attention, and always manage your risk.

Gold Analysis: Buyers vs Sellers Near Critical LevelsHello traders! Let’s take a look at XAUUSD (Gold). XAUUSD is currently trading within a broad corrective structure, moving between a well-defined Resistance Level near $4,100 and a strong Support Level around $4,030. Throughout the recent sessions, Gold has repeatedly reacted to these two key zones, forming clear ranges and turnarounds visible on the chart. Earlier, price created a large Range Phase, followed by a sharp rejection from the upper boundary of the descending Resistance Line, confirming continued selling pressure from higher levels. The repeated “Turned Around” reactions along this trendline show that sellers remain active every time price approaches the upper trend boundary. After breaking below the Seller Zone around $4,100, Gold retraced into the lower structure and entered the Buyer Zone, which aligns with both horizontal support and the ascending Support Line of the current bullish correction. This confluence makes the $4,030–$4,050 region a major demand area. Recently, XAUUSD bounced strongly from the Support Line, but the recovery stalled at the Seller Zone, where price is now showing signs of rejection once again. This confirms the zone as a significant barrier for buyers. A rejection from this level may trigger another downward movement toward the Support Level around $4,030, where buyers previously stepped in aggressively. As long as Gold trades below the descending Resistance Line and the $4,100–$4,110 area, the market retains a bearish-to-neutral tone. Only a clean breakout above this zone would signal a shift toward a stronger bullish phase and open the path to higher resistance levels. As long as XAUUSD remains below the $4,100 Resistance Level, sellers retain the advantage. I expect price to potentially reject the Seller Zone and move back toward the $4,050–$4,030 Support Level. A rejection from resistance sends price down toward $4,030, where buyers may attempt another defense. Break below this level opens the door for deeper correction. Overall, the market currently favors selling pullbacks into resistance, while the Support Line remains the key area for defending bullish structure. Please share this idea with your friends and click Boost 🚀

GBPCAD – Triple Tap Trouble!GBPCAD has been trading within a well-defined range, with price rejecting the 1.8850 resistance zone multiple times in the past.
Each test of this area has led to strong bearish moves, highlighting its significance as a supply zone.
Here’s what the chart shows:
🔴 Resistance Zone: Price is approaching the upper bound of the range, where sellers have consistently stepped in.
🔵 Support Zone: The 1.8300 area remains a solid demand zone, holding price higher on several occasions.
📈 Rising Channel: The latest bullish leg is developing inside an ascending channel, but momentum is slowing near resistance.
⚠️ Short Opportunity: As long as price trades below the resistance, the area remains attractive for short setups targeting the mid-range or lower bound.
Confirmation with bearish candlestick patterns will strengthen the case for a downside move.
📌 Will GBP/CAD respect its range and roll over once again, or will the bulls finally break through?
This analysis is for educational purposes only, not financial advice. Always manage risk properly before taking trades.
📚 Stick to your trading plan regarding entries, risk management, and trade execution.
Good luck!
All Strategies Are Good; If Managed Properly!
~Richard Nasr

EURUSD Short: Price Sliding Back Toward 1.1540 SupportHello traders! EURUSD continues to move within a broader bearish trend structure, consistently respecting the descending Trend Line that has acted as a dynamic resistance for several weeks. Each retest of this line has resulted in strong bearish reactions, confirming persistent seller dominance. Throughout the decline, the market formed several pivot points and repeated breakouts, showing how price reacts to key liquidity areas. A notable pattern on the chart is the Rounding Top, which formed near the mid-trend zone and signaled an early shift from bullish correction to renewed bearish pressure. After completing this pattern, EURUSD dropped sharply, breaking down through support and heading toward the demand area. Recently, price attempted a breakout above the descending Trend Line but created a Fake Breakout, indicating that buyers were unable to hold gains above resistance. This rejection occurred inside the Supply Zone around 1.1620, reinforcing the bearish sentiment.
Currently, EURUSD is trading below the trend line once again, showing weakening bullish attempts and maintaining the overall downward trajectory. Price is slowly drifting toward the Demand Zone at 1.15400, which has previously served as a strong reaction area.
My scenario if EURUSD fails to break the descending Trend Line and stays below the Supply Zone, the pair is likely to continue moving lower toward the 1.15400 Demand Zone. This area is the next major support and the most probable target for sellers. However, if buyers defend the current levels and push price back toward resistance, a short-term correction toward the trend line may occur before another bearish impulse. A confirmed break below 1.15400 would open the way for further downside continuation, in line with the broader bearish structure. For now, the bias remains bearish while price trades under the Trend Line and below 1.1620. Manage your risk!

EURUSD: Sellers Target Move Toward 1.1550 Support ZoneHello everyone, here is my breakdown of the current Euro setup.
Market Analysis
EURUSD is currently reacting within a broader corrective structure after failing to break above the major Resistance Area around 1.16500. This zone has repeatedly acted as a strong supply region, where price formed multiple rejection points and false breakouts. Each attempt to move higher was stopped by the descending Resistance Line, confirming continued bearish pressure. Earlier, EURUSD moved inside a wide Range Phase, followed by a breakout that initiated an upward correction inside an Upward Channel. However, bullish momentum weakened once price reached the upper boundary of the channel and the major resistance area. This led to a strong reversal and a bearish breakout below channel support.
Currently, EURUSD is climbing again toward the same Resistance Area near 1.16500, but the structure suggests the move is likely a corrective pullback, not a trend reversal. Price is approaching the intersection of the Resistance Line and the Resistance Zone, creating a confluence area where sellers are expected to regain control.As long as the market trades below this resistance cluster, the overall trend remains bearish. A rejection from the 1.16500 level could trigger a decline toward the Support Zone at 1.15550, which previously acted as a key demand region.
My Scenario & Strategy
I expect EURUSD to complete its pullback soon and resume the bearish trend once price reaches the 1.16500 Resistance Area. This zone remains the strongest supply region in the current structure. Potential short entries become valid once bearish confirmation appears near 1.16500, with the primary target at the 1.15550 Support Zone (TP1).
A clean breakdown below 1.15550 would signal continuation of the downtrend.
Alternatively, if EURUSD successfully breaks above 1.16500 and stays above the descending resistance line, bullish momentum may develop — but for now, this scenario remains secondary. Market bias stays bearish as long as price trades below resistance.
That's the setup I'm tracking. Thank you for your attention, and always manage your risk.

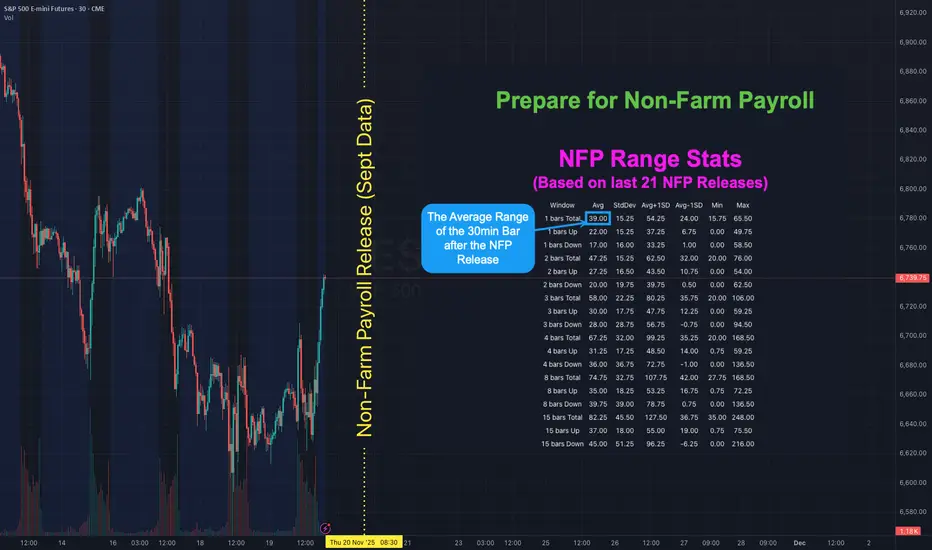
NFP is Back! Here's how to map out your playbook with statsHOW TO USE NFP RANGE STATS TO PREPARE YOUR PLAYBOOK
There has not been a Non-Farm Payroll release since Friday 5 September 2025 . Due to the government shutdown the September report that was originally set for Friday 3 October was postponed. It will finally be released on Thursday 20 November - a 48 day delay. With uncertainty around the labour data higher than usual it helps to know what “normal” looks like for ES S&P Futures. The table shows historical ranges after the 08:30 ET release on a 30-minute chart: 1 bar (30mins), 2 bars (60mins) 3 bars (90mins), 4 bars (2hrs), 8 bars (4hrs) and 15 bars (up to ~16:00 ET). The stats are based on the last 21 NFP releases (approx 2-years).
👉 If you think this would be useful as a script you can run yourself let me know (boost and drop a comment) and if there's enough interest I'll see if I can publish something.
WHAT THE COLUMNS MEAN
Avg - the typical move for that window based on past NFPs
StdDev - the variability around that average
Avg + 1 StdDev and Avg - 1 StdDev - quick upper and lower guardrails for a “normal” day
Min / Max - historical extremes in the sample
WAYS TO USE IT
1) Set guardrails for price discovery
Use Avg + 1 StdDev as a first “stretch” expectation for the window you trade. If price pushes beyond that level early you know we are outside normal and can adapt position size and expectations.
2) Pre-plan targets and emergency exits
Before 08:30 ET map a base scenario. Example for ES: if the 30m Avg post-release is X then a first take-profit can sit near X and a stretch target near Avg + 1 StdDev . Place an emergency stop beyond the Avg - 1 StdDev line if fading the first move.
3) Size positions to volatility
Translate the Avg 30m range into ticks or points and size so that a typical NFP bar does not exceed your defined risk. If your stats say the first 30m averages 9 points on ES do not run a size that cannot survive a 9-12 point swing.
4) Choose a playbook by window
1 bar (30m) - breakout or first-reaction mean-reversion
2-4 bars (60-120m) - continuation or reversal probabilities stabilise around the Avg envelope
8-15 bars - when the full session range is already at or beyond Avg + 1 StdDev be cautious chasing late moves
With the report 48 days late the probability of surprise is elevated. Go into the print with your ranges pre-mapped and your position sizing tied to those Avg and Avg ± StdDev bands. Clarity beats adrenaline.
👉 REMINDER:
If you think this would be useful as a script you can run yourself let me know (boost and drop a comment) and if there's enough interest I'll see if I can publish something.
XAUUSD: Bullish Rebound Setup as Price Holds Above Wedge SupportHello everyone, here is my breakdown of the current Gold setup.
Market Analysis
XAUUSD is currently maintaining a bullish market structure after rebounding from the key Wedge Support Line, which continues to act as a major dynamic support for the ongoing uptrend. The chart shows that Gold previously formed a broad Range at the top, followed by a sharp rejection from the Resistance Area near $4,170–$4,200, where strong sellers stepped in. This zone remains the primary supply region and aligns closely with the Wedge Resistance Line, creating a strong confluence barrier. After the rejection, price moved back into a correction phase, retesting both the Support Zone around $4,040–$4,070 and the ascending wedge structure. Notably, the recent bullish reaction inside this zone indicates that buyers are still defending this area effectively. Multiple breakouts and a prior fake breakout highlight that sellers are struggling to maintain downward momentum, while buyers continue to accumulate at lower levels.
Currently, XAUUSD is stabilizing just above the Support Zone, forming early signs of a potential upward continuation. As long as the price respects the wedge support and holds above $4,070, the bullish structure remains intact. The market behavior suggests increasing buyer interest, especially during retests of lower support.
My Scenario & Strategy
I expect Gold to continue its upward movement from the current support area and retest the $4,170–$4,200 Resistance Zone once again. This level will be the next major decision point; a successful breakout above this zone could open the path toward higher highs and potentially signal a continuation of the broader bullish trend.
However, if XAUUSD breaks below the Wedge Support Line, the bullish outlook would weaken, and the price could revisit deeper support levels before buyers attempt another recovery. For now, bullish continuation remains the most probable scenario as long as the support structure holds. Pullback-based long entries remain the best approach while price continues to trade above the key support zone and upward trendline.
That's the setup I'm tracking. Thank you for your attention, and always manage your risk.
