12/01/26 Weekly OutlookLast weeks high: $94,802.73
Last weeks low: $89,312.98
Midpoint: $92,057.85
The first trading week of 2026 continued the same patterns as the end of 2025. With $94,000 still very much the key level that the bears are defending, and defending well. However, the 4H 200 EMA has been reclaimed by the bulls with consistent support bounces when tested indicating a level of strength.
For this week that is what I think is most important for BTC, the bulls are building a base to attempt a rally through $94,000 resistance, should this level be breached with volume $100,000 big even level is the target.
The bears will continue their defense of $94,000 with the objective of pushing price back below the 4H 200 EMA (currently $90,400).
CPI takes place tomorrow and so an increased level of volatility should be expected, especially if the result is different to the 2.7% forecast.
Altcoins have seen a steady rally relative to BTC & ETH, also flipping the 4H 200 EMA with an eye to retest the 1D 200 EMA resistance. If altcoins were to get back above the 1D with acceptance the market would look a lot healthier.
Rangebound

BTCUSDT — When Price Is Asking Questions, Not Answering ThemBTCUSDT — When Price Is Asking Questions, Not Answering Them
Date: 2025-12-30
Session: NY Futures
Last Price: 87,872
If you’re feeling like price has been almost doing something but never quite following through, you’re not alone. This is one of those environments where clarity feels close, but structure hasn’t actually resolved. I treat that feeling as information, not a problem. Markets often get quiet before they get directional — and forcing certainty during that phase usually comes at a cost.
Recent behavior (last 24 hours)
Over the past day, BTC has remained contained inside its broader daily range. Attempts to move higher and lower have both struggled to hold. Instead of expansion, we’ve seen rotation — back-and-forth movement that suggests the market is still negotiating value rather than escaping it. That behavior matters more to me than any single candle because it speaks to participation and conviction.
Right now, nothing feels urgent. That in itself is useful information.
Why traders struggle in this zone:
This area sits uncomfortably close to levels that could matter without actually crossing them. That’s where traders tend to get trapped into reacting to small moves as if they’re meaningful. When triggers are nearby, every push can feel important — even when it isn’t.
The real danger here isn’t picking the wrong direction. It’s acting as if the market has already made a decision when it clearly hasn’t.
How I’m framing structure today"
Rather than thinking in terms of outcomes, I’m focused on decision boundaries:
Daily Resistance: 90,367.6
Daily Support: 86,406
Upside Trigger: 88,502
Downside Trigger: 87,621
These levels don’t predict anything. They define where behavior can change if price earns it. Until then, they simply frame the environment.
Conditional environments (not expectations):
Above the upside trigger:
Acceptance above this level would suggest the market may be willing to explore higher value. Without acceptance, moves above it remain attempts rather than conclusions.
Below the downside trigger:
Acceptance below here would indicate willingness to explore lower value. Without that, downside movement stays rotational.
Inside the range:
Between these triggers, I treat the market as neutral. This is where overtrading does the most damage. Standing down here isn’t passive — it’s aligned.
Closing thought:
Days like this tend to reward restraint more than activity. I don’t need to anticipate the next expansion — I need to recognize whether it’s actually happening. When structure is balanced, my focus shifts from participation to observation. Letting the market prove intent keeps me aligned with risk, capital, and discipline. If nothing resolves, that’s not a missed trade — it’s confirmation that patience was the right behavior.

Sobha Approaching Key Fib Support — Bounce On the Cards?This is the daily timeframe chart of Sobha Ltd.
The stock is currently holding a strong support zone near the 1400–1430
range.
If this support level is sustained, Sobha may continue to trade within a range-bound structure.
A potential bullish move could emerge towards the 1650–1700 resistance zone.
Thank you.

Condor in the Clouds: When the S&P 500 Takes a Nap1 – The Setup Nobody Expected
The S&P 500 just pulled a classic “I’m tired” move. After that big drop, it stopped running and started hovering between 6,437 and 6,873 — a cozy sideways zone filled with Fibonacci levels, Floor Trader Pivots, and UFOs (yep, UnFilled Orders, not flying saucers).
Markets do that sometimes — they sprint, then nap. And when they nap, option sellers quietly collect theta while everyone else wonders when the action will come back.
2 – The Play: Short Iron Condor
When the market’s stuck in the middle, the Short Iron Condor is like putting walls on both sides of the price. Here’s the idea — you get paid if ES stays in between.
How it’s built:
Sell a Call above resistance
Buy a Call a little higher (that’s your safety net)
Sell a Put below support
Buy a Put a little lower (another safety net)
Boom — now you’ve boxed the market. If it behaves, you earn. If it doesn’t, your risk is capped.
3 – Why It Works Right Now
The Condor thrives when volatility chills out. That’s exactly what ES is doing — taking a breath after chaos.
Theta decay: your invisible ally, eating away at option value day by day.
Range stability: resistance ≈ 6,873, support ≈ 6,437.
Low Vega: volatility tantrums matter less.
You don’t need fireworks — you need patience. This trade doesn’t scream, it hums.
4 – The Fine Print (a.k.a. Risk Management)
Keep it real:
Size positions by max risk, not by excitement level.
Don’t wait for expiration — grab 50–60% profit and fly away.
When the market is calm, the Condor glides. When storms build, fold your wings.
5 – For the Data Nerds
If you love precision:
ES tick = $12.50
MES tick = $1.25
Margins ≈ $21k and $2.1k respectively (subject to volatility).
And yes — theta doesn’t care which one you trade; it just wants time to pass.
6 – The Takeaway
Markets don’t always trend. Sometimes they just drift — and that’s okay.
In those moments, the Short Iron Condor turns boredom into strategy.
So, if the S&P 500 keeps “floating in the clouds,” don’t chase it — collect from it.
Want More Depth?
If you’d like to go deeper into the building blocks of trading, check out our From Mystery to Mastery trilogy, three cornerstone articles that complement this one:
🔗 From Mystery to Mastery: Trading Essentials
🔗 From Mystery to Mastery: Futures Explained
🔗 From Mystery to Mastery: Options Explained
When charting futures, the data provided could be delayed. Traders working with the ticker symbols discussed in this idea may prefer to use CME Group real-time data plan on TradingView: www.tradingview.com - This consideration is particularly important for shorter-term traders, whereas it may be less critical for those focused on longer-term trading strategies.
General Disclaimer:
The trade ideas presented herein are solely for illustrative purposes forming a part of a case study intended to demonstrate key principles in risk management within the context of the specific market scenarios discussed. These ideas are not to be interpreted as investment recommendations or financial advice. They do not endorse or promote any specific trading strategies, financial products, or services. The information provided is based on data believed to be reliable; however, its accuracy or completeness cannot be guaranteed. Trading in financial markets involves risks, including the potential loss of principal. Each individual should conduct their own research and consult with professional financial advisors before making any investment decisions. The author or publisher of this content bears no responsibility for any actions taken based on the information provided or for any resultant financial or other losses.

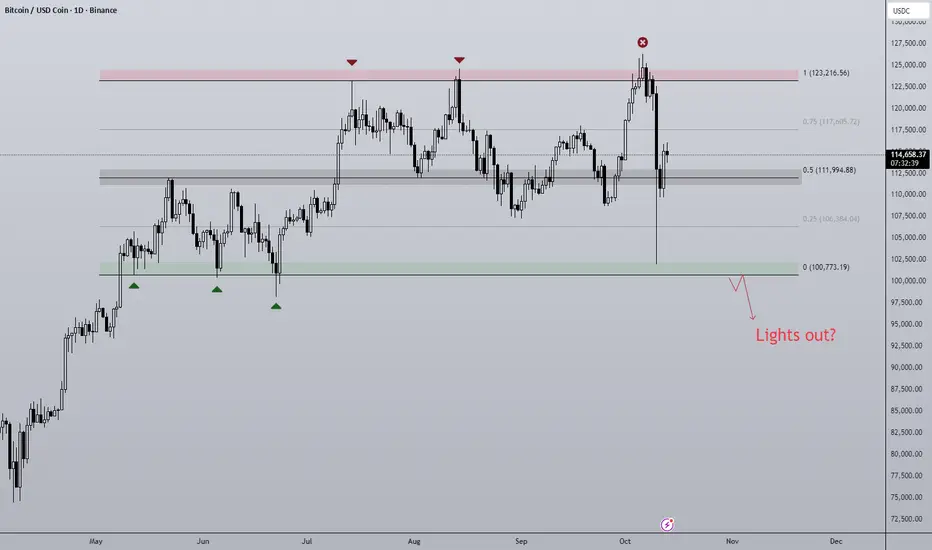
Post Flash-Crash BTC Despite such a large sell-off event, has the outlook on BTC actually changed? Structurally BTC remains very much rangebound with two clearly definable halves of the range. That is until Fridays move off the back of a Tariff Tweet from President Trump causing a liquidation event similar to that of April earlier this year and the Covid crash of 2020.
Bitcoin was less effected when compared to altcoins as is usually the case, some majors dropping as much as 80% in a single 1h candle! An entire bear market in an afternoon. Bitcoin on most exchanges fell roughly 20% on the news and eventually found support at range lows ($100,000), a significant amount of this drop got bought up and so BTC finds itself hovering around range midpoint.
To me this is a no trade zone initially, there is no clear directional bias that is actionable at this time but I am looking for clues as to where price may be going next:
- Should BTC stay above midpoint the next clear resistance level is 0.75 ($117,605). On the lower time frames the trend is bearish, 0.75 would be a good place for the bears to defend.
- A loss of the midpoint would open the door to backfilling the wick, this could get ugly as on the higher time frames a new lower low and price acceptance lower would signal a bearish shift in structure. Calls for "the top is in" will get much louder and so will the 4 year cycle theory comparisons.
- A V-shaped recovery and move straight to the highs would be max pain after such a brutal move down. Although IMO it's the least likely I would not rule it out.
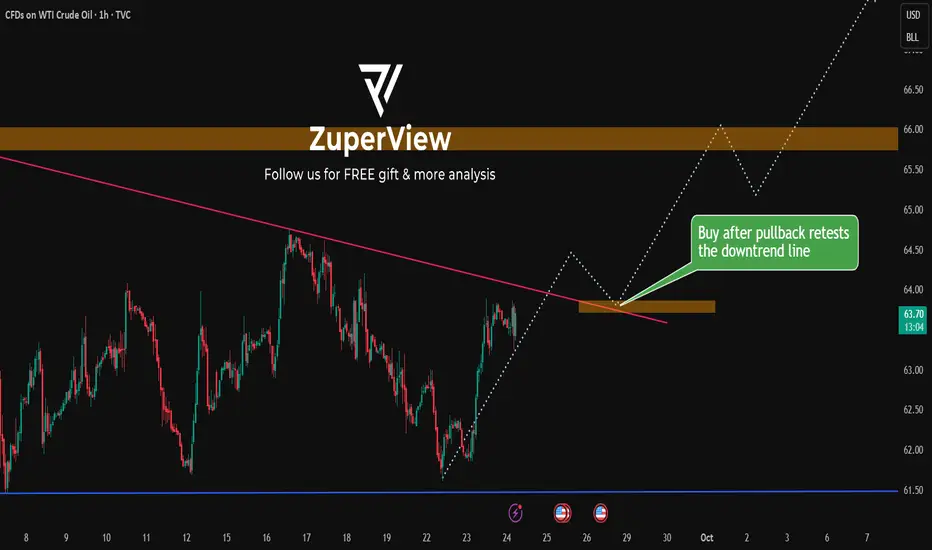
USOIL: Range-bound setup with upside test before downside risk
* Trend: assessed using at least three trend indicators, with market structure as the primary guide.
** Weak or Reversal Signals: Assessed based on one of our criteria for trend reversal signals.
*** Support/Resistance: Selected from multiple factors – static (Swing High, Swing Low, etc.), dynamic (EMA, MA, etc.), psychological (Fibonacci, RSI, etc.) – and determined based on the trader’s discretion.
**** Our advice takes into account all factors, including both fundamental and technical analysis. It is not intended as a profit target. We hope it can serve as a reference to help you trade more effectively. This advice is for informational purposes only and we assume no responsibility for any trading results based on it.
Please like and comment below to support our traders. Your reactions will motivate us to do more analysis in the future 🙏✨
DB Corp | Crucial Price Action Zone AheadDB Corp | Technical Outlook
On the daily timeframe, DB Corp is currently trading rangebound within a well-defined consolidation zone, with a strong support zone at 250–260.
The stock is respecting the 0.382 Fibonacci retracement level, with a critical support level placed at 254.
If this level holds, we may see a potential upside move towards 287.
However, if the support at 254 breaks, the next major support lies around 170–180.
Conclusion: Price action around the 254 level will be crucial for the next directional move.
Thank You !!

GOLD (XAU/USD) – 30M: Sideways Consolidation Ahead? Key Levels &Hello traders,
Looking at the 30-minute chart of Gold, I’m seeing strong signs that price is entering a sideways consolidation phase — potentially setting up for a breakout later, but for now, expect range-bound action.
🔹 Pattern Breakdown:
We’re inside a descending triangle / wedge structure formed by points X → A → B → C → D.
The lower trendline (blue) is holding as support, while the upper trendline (red) is acting as resistance.
Recent price action from C to D shows diminishing momentum — classic sign of exhaustion before consolidation.
🔹 Key Clues Supporting Sideways Movement:
✅ Volume Drying Up: Notice how volume has decreased after the spike at point C — this often precedes consolidation.
✅ Price Rejection at Resistance: Multiple tests near $3,780–$3,790 (marked “Weak High”) failed to break higher — suggesting sellers are active.
✅ LuxAlgo Indicator Neutral: The Smart Money Concepts indicator shows mixed signals — no clear bullish/bearish bias yet.
✅ Horizontal Zones Strong: Price is respecting key horizontal levels — $3,720 (strong support), $3,780 (resistance). This reinforces range behavior.
🎯 What to Expect:
Short-term (next 24–48 hrs): Range-bound between $3,720 – $3,780.
Breakout Trigger: Watch for a close above $3,790 (bullish) or below $3,715 (bearish).
Target if Breakout Occurs:
Bullish: $3,850+ (next major resistance)
Bearish: $3,680 (previous swing low)
⚠️ Risk Management:
If trading the range: Buy near $3,720, sell near $3,780.
Stop loss: Below $3,710 (for longs) or above $3,790 (for shorts).
Avoid chasing breakouts until confirmed with volume + candlestick confirmation (e.g., engulfing bar).
📌 Pro Tip: Use this consolidation to re-evaluate your position. Is your stop-loss tight? Are you over-leveraged? Sideways markets are perfect for adjusting strategy without emotional decisions.
Let me know — are you expecting a breakout soon, or do you think Gold will chop sideways for days?
#Gold #XAUUSD #SidewaysMarket #RangeBound #TechnicalAnalysis #TradingView #ChartPatterns #GoldTrading #Consolidation #SupportAndResistance #LuxAlgo #Forex #Commodities #30MinuteChart #MarketAnalysis
✅ Bonus Tips for Posting:
Add your username: @raheel007khan at top or bottom.
Use emojis sparingly (like 📉 ✅ ⚠️) to highlight key sections.
Ask a question at the end to boost engagement (“What’s your take?”).
This version gives clarity, context, and actionable insight — exactly what TradingView users look for. Let me know if you want to tailor it for swing traders, scalpers, or longer-term investors!
💬 “The market doesn’t always move — sometimes it breathes. And that’s when smart traders prepare.”

BTC End of Q3 Setup Now that FOMC is over and the FED finally cut interest rates by 25bps, what does this mean for BTC in the short term future and beyond?
It has been known for a while that the September FOMC would bring a cut to interest rates and that is what we got, generally this was priced into the market and despite some low time frame volatility not much has changed in terms of % move in the last day.
However, the macro does look bullish from here. Flipping $117,500 opens up the possibility of a range high test. For me this is the direction I'm leaning towards given the macro and how seasonality suggests a stronger end to the year especially after a rate cut.
Should BTC fail to break above the grey box BTC stays within the same constraints it's had for the last month.

NVDA Range BoundMonth of August Range Bound
After market since Earnings...holding previous support/resistance level $172.

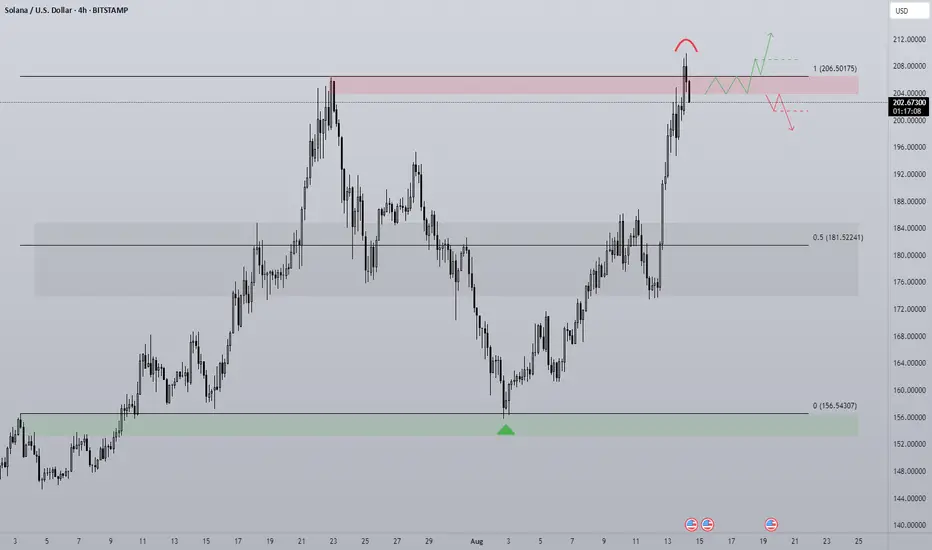
SOL - Breakout or Rangebound?For me this chart is quite simple with two options, a bullish and bearish scenario. SOL is currently rangebound but the massive momentum in the broader market has opened the door to a potential breakout of this trading environment.
To look at the context of the chart we has a clear push from the midpoint up to range high, very little in the way of pullbacks until price breaks up above the old local high. We know that generally stop losses hide behind a key high or low and so price trading into it with such momentum is something to note when entering a trade at this level.
Liquidations for SOL are currently 50:50 long and short and so this balance shows no clear liquidation event in one particular way, at least not yet.
Bullish scenario -
SOL continues the rally above the range, strong volume to confirm that price is ready to expand beyond the area that failed in the past. A retest of $206 with a strong bounce gives this move a higher probability and proof buyers are still willing to buy at the level. Idea is invalid should price accept back below the range high, signifying buyers are not ready to sustain rally continuation.
Bearish scenario -
Price accepts below range high and shows that buyers are not willing to expend beyond the range. Naturally a retreat would then follow as the bears defend the same point that they successfully defended in the past (range high). Any price action that resembles chop within the red box would be a non action area as there is an area of balance giving no clear clue of direction either way.
Bitcoin Range for August?Historically August has been a tough month for crypto in the past with mostly flat to negative returns. For that reason, although not a perfect science, I would not be surprised if we see a rangebound environment continuation for BTC.
So what would that look like? Structurally there are three thirds to the range, currently price is looking to break through into the upper third after bouncing off the bottom third bullish orderblock.
Trade setups will naturally present themselves as rotational plays both bullish and bearish at the extremes of each of the thirds but much larger trades from the range top and bottom.
Altcoins are lagging behind BTC structurally so where BTC has been choppy for a few weeks, most large cap alts have hit their highs and are now looking to settle into a range before the next leg up.

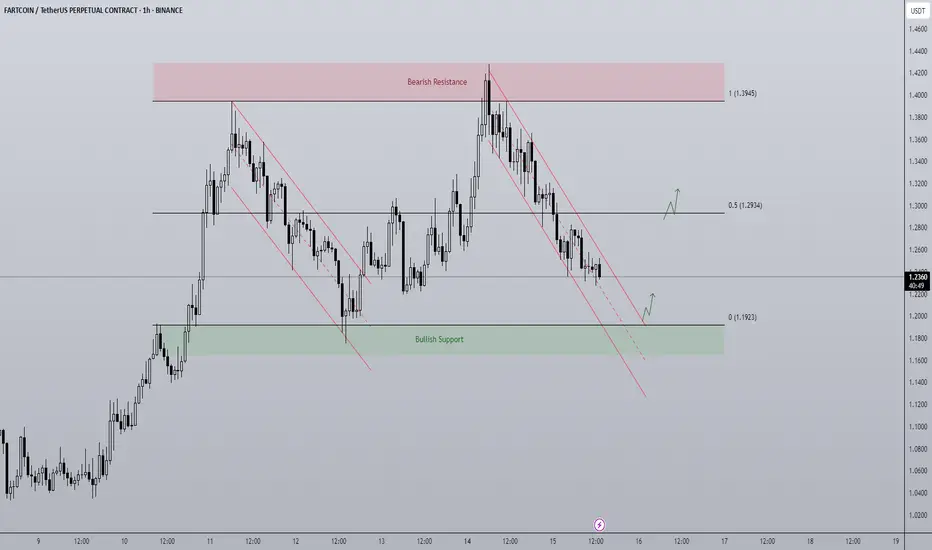
Fartcoin - Rangebound repeat? A BTC makes new highs attention has turned towards altcoins to play catch up.
FARTCOIN has been a top performer of the last month and currently on the 1D timeframe finds itself in a rangebound environment capped between $1.1923 - $1.3945. The end of last week price trended down in a bearish channel from top to bottom and it looks to be doing the same currently. As the supply zone above the range high got swept, price printed a SFP getting back inside the range and began trending down, for me there are two actionable long entries here:
- A range low bounce + breakout of trend channel would be an ideal long entry. An area of clear support coupled with a breakout is a historically strong setup with a clear invalidation if price breaks below the range and gets accepted.
- A more aggressive but potentially less ideal setup would be a breakout of the downtrend before hitting range lows. Higher risk as the level of support is not as defined but in the more risk-on environment crypto is currently in, the chance of major support levels being front run does go up as buyers become more impatient when FOMO grows.
The midpoint is key level to look out for too as a reclaim would mean a run at the highs, rejection opens the door to retest the lows.
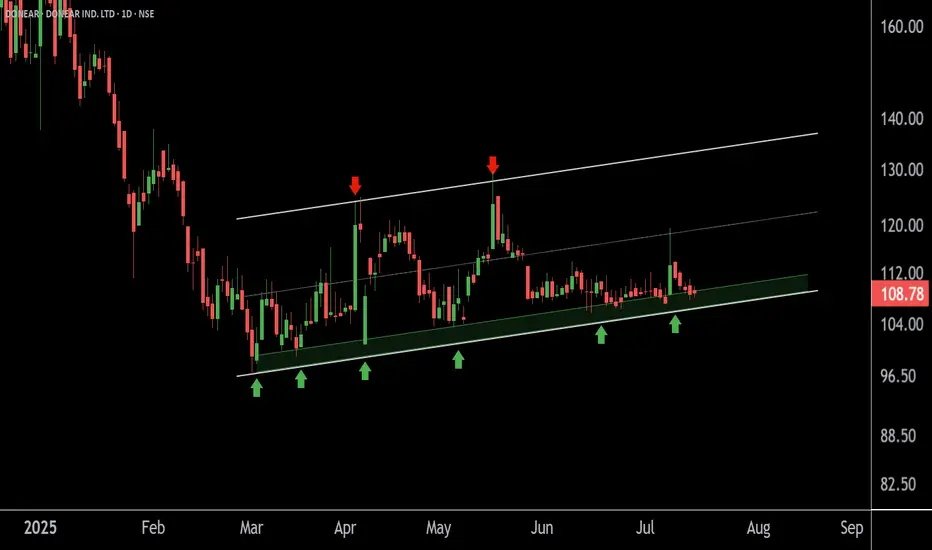
DONEAR at Best Support Zone !!This is the daily chart of Donear Industries.
Donear is moving in well defined parallel channel having a good support zone near 105 level.
if this level is sustain , then we may see higher prices in Donear .
Thank You !!
30/06/25 Weekly OutlookLast weeks high: $108,531.02
Last weeks low: $99,592.69
Midpoint: $104,061.86
Overall a positive week for BTC in isolation as price moves steadily all week reclaiming the losses made in the week from the 16th-23rd June. This comes after a $2.2B BTC ETF weekly inflow, the 3rd consecutive week of net inflows.
Having now hit the key S/R level of $108,500 it will be interesting to see where BTC goes from here. Jumping up above the level will require a lot from the bulls as ATH is within touching distance and so buying into major resistance is a tough ask. We also have Geo-political uncertainties to add to the situation, one bad tweet is all it takes sometimes to do a lot of damage.
On the other hand the SNP500 hits new ATH in the same conditions and so BTC is more than capable of doing the same.
So far in the first hours of this weeks trading we do have a SFP of the weekly high setup, not ideal for the bulls in any way and so from here the a retest of the range quarters, midpoint being the key area would make sense, invalidation would be a clean break above weekly high with acceptance and strong volume on the move to break the rangebound/choppy environment.
There is also the "window dressing" element to the months &quarter end today. History shows a de-risking going into these events and more money flowing back into risk-on assets in the days following monthly/ quarterly end. For that reason a bullish move (if there were to be one) would come later in the week IMO.
Good luck this week everybody!

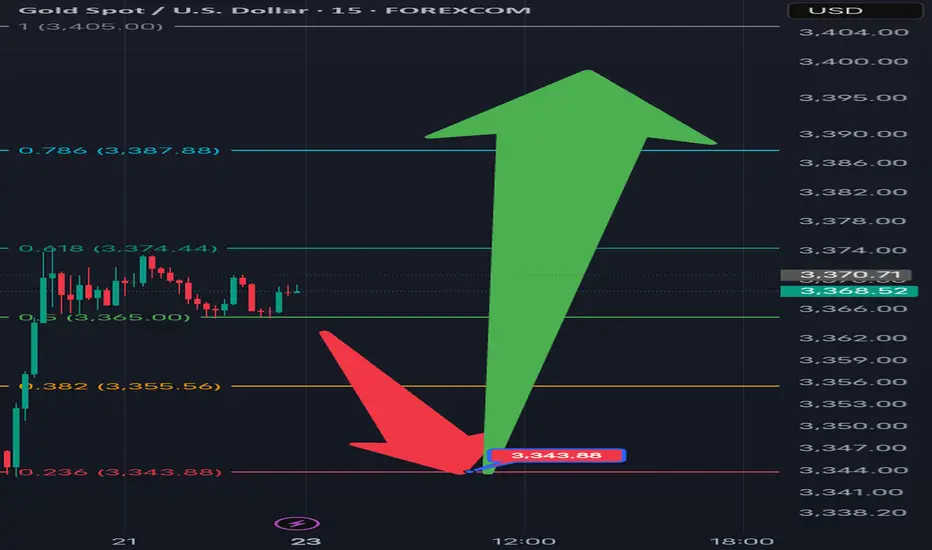
[XAUSD] Potential Bearish Move During Asian SessionAlthough sentiment going into Monday is broadly bullish , driven by escalating geopolitical tension and anticipation of a breakout, XAU/USD may still open with a brief pullback , not because traders are ignoring the situation, but because markets often test the conviction of retail and early-positioned bulls before making a decisive move.
When gold opens during the Asian session, a wave of participants—already leaning bullish—may rush in with early long entries. However, smart money and institutional traders often prefer to buy on value , not at the highs. So instead of chasing price above $3,368–$3,370 immediately, they may allow or even trigger a short-term flush— pushing price down to retest key support at $3,343.88 . This level aligns with prior structure and psychological comfort: it offers an opportunity for a cleaner re-entry , or for those who missed the move on Friday to establish positions.
This decline isn't a breakdown, but a strategic sweep of weak hands and stop losses —a classic fake-out move. Once that level is tagged and buyers step back in, the market quickly finds footing. With news-driven urgency and broader sentiment tilting toward risk aversion, gold recovers fast. By late Asia or early London hours, price grinds back toward the $3,385–$3,390 zone , right below the known bullish breakout ceiling.
This kind of "bearish tap then bullish reclaim" sequence builds the technical base necessary for a stronger breakout attempt later in the session—shaking out early longs and inviting smarter buying near support rather than resistance.
Range breakout | Impulse of bull starthi Traders,
1. The swing formation is solid
2. BEL has taken the ascending trend line support.
3. The the range bound is weekly has broke upward, leading to impulse wave of bull trend.
4. Projected Target 1 and Target 2 with 20% and 40% returns from the CMP with 1:81 and 1:4.01 risk reward ratio respectively.

26/05/25 Weekly OutlookLast weeks high: $111,965.73
Last weeks low: $101,994.78
Midpoint: $106,980.26
New BTC ATHs! Well done to those who capitalized on the move and continue to believe in this Bitcoin.
For the last two weekly outlooks I have talked about the pattern of consolidation for 1 week --> expansion the next. Last week We got our expansion week right on queue and this time around BTC made a new ATH hitting just shy of $112,000.
Should the pattern continue this week will be a week of consolidation/chop, however this week is different now that we're at ATH levels. My gut says a pullback is coming after such an aggressive move up with almost no pullbacks at all.
Should BTCs price drop below the Midpoint I think there will be a big struggle to continue this rally in the short term. Initially target would be weekly low and main HTF target would be $97,000 IMO. That would be a healthy pullback to continue the rally.
For the bulls you don't want momentum to stop in the short term, flipping $110,450 and weekly high would put BTC back into price discovery, once any asset is in price discovery it's very difficult to tell where the sell pressure will come from and so shorting becomes very risky.

NQ Power Range Report with FIB Ext - 5/8/2025 SessionCME_MINI:NQM2025
- PR High: 19957.25
- PR Low: 19910.75
- NZ Spread: 103.75
Key scheduled economic events:
08:30 | Initial Jobless Claims
13:00 | 30-Year Bond Auction
Auction remains inside week range, 19920 to 20200
- Contained inside Friday's range, advertising return to 20280 high
- Strong value increase through Asian hours
Session Open Stats (As of 12:35 AM 5/8)
- Session Open ATR: 578.32
- Volume: 43K
- Open Int: 257K
- Trend Grade: Bear
- From BA ATH: -10.9% (Rounded)
Key Levels (Rounded - Think of these as ranges)
- Long: 20954
- Mid: 19246
- Short: 16963
Keep in mind this is not speculation or a prediction. Only a report of the Power Range with Fib extensions for target hunting. Do your DD! You determine your risk tolerance. You are fully capable of making your own decisions.
BA: Back Adjusted
BuZ/BeZ: Bull Zone / Bear Zone
NZ: Neutral Zone

VeChain Range & Structure AnalysisBINANCE:VETUSDT has been range-bound since November 2023, with very clear levels.
Key Zones
• Weekly Demand Zone: $0.019–$0.022 — major support with multiple rebounds.
• Weekly Supply Zone: $0.045–$0.055 — strong resistance dating back to early 2024.
• Midrange / HVN: ~$0.037 — heavy volume area and likely resistance if tested.
• Local Resistance: $0.027 — recent swing high + S/R since December 2023. A daily close above could mark a change of character and a shift to a bullish bias.
Possible Scenario
• With a daily close above $0.027, VET may revisit the $0.055 range high — with potential resistance at the midline along the way.
• If $0.055 is reached and followed by a sharp rejection, we might start seeing the formation of a macro Head & Shoulders — with $0.019 as a key neckline.
• Breakdown below $0.019 would activate a target near $0.0045.*
• Break above $0.055 would invalidate the H&S idea and could open the door toward $0.1150.*
* H&S scenario is purely hypothetical and would require structure confirmation.

BITCOIN 4H - 8th time lucky? The 200 EMA is a great indication of the environment a certain asset is currently in. If the 200 ema is not being respected as neither support nor resistance then generally the market environment is rangebound. If an asset is in a trending environment then the 200 ema is often being respected, as in the moving average acts as a key support in an uptrend or as resistance in a downtrend.
What we have seen from BTC is a clear shift from rangebound PA where it seems as though the 4H 200 EMA has no effect on price and is sat relatively neutral with no gradient, to a clear downward gradient capping off any attempt for the bulls to move higher. Eight separate occasions the bulls attempted to flip the moving average and failed each time, until now?
Having ended last week strong with a reclaim of $86,000 an early Monday push has seen BTC close a 4H candle above for the first time in 7 weeks. It is important to note that when the MA is still sloping downward it is still seen as a resistance level, a retest as new support while the slope levels out is always a possibility.
I am now interested in the question of, if Bitcoin reclaims the 4H 200 EMA, does it flip to a bullish trend or another rangebound one? That's where the $91,000 S/R comes in, as a reclaim of that level would put BTC into a LTF rally and therefor bullish trend, rejection off that level would see the MA level-out and becomes less important and therefor rangebound.
Comment with your thoughts on this idea.

LITECOIN 4H (LTC)Litecoin is one of the best performing majors in recent weeks and finds itself around the mini range highs in an area of key resistance. The way I'm looking at this chart is in two separate sections of the same mini range, a lower range and upper range with an area of indecision between that separates the two.
Despite how choppy the market has been price can be clearly analyzed in this format:
Lower range - Clear level of support where buyers are stepping into the market aggressively to rebound any sell off and pushing price up further towards the 1D 200 EMA. There is one instance of price sweeping below range low and quickly reclaiming back above, that move has been a catalyst for bullish PA ever since with a strong bullish structure.
Upper range - The top of the upper range has yet to be retested as there is major resistance area position just before it, this bearish orderblock has rejected 4 times and is now being tested for a 5th at time of writing. It is important to note that the 1D 200 EMA is currently at its highest point during this rangebound environment, coupled with higher highs and higher lows on the low time frames, Litecoin is looking good currently.
However, bitcoin is still very much the dominant force in the market, and without bitcoin paving the way I can't see LTC making a breakout move just yet. In order for Litecoin to make a run for the highs I would like to see BTC @ $98,000 with a full reclaim of the weekly midpoint (See weekly outlook).
To conclude, Litcoin is in better shape than most other coins but this rangebound environment should be treated as such until proven otherwise, no action needs to be taken in the main bulk of either the upper or lower range, just the tops and bottoms are worth acting on IMO.

TAO DAILY For me there are two possible entries for TAO caused by the trade war situation in the US, so this is my take on the chart:
- Wicks get filled as a rule of thumb, so this capitulation wick that has reset all the progress made in Q4 2024. My preferred entry would be a sweep and reclaim of the wick as this coincides with range low and a bullish orderblock, an area of extreme support on the high timeframe.
- Another entry would be the breakout of the diagonal downtrend resistance, if this could coincide with the reclaim of the 0.25 line in the range that would add further confluence and a better R:R IMO.
For both entries the Midpoint would be a key S/R level and would be very high resistance.
