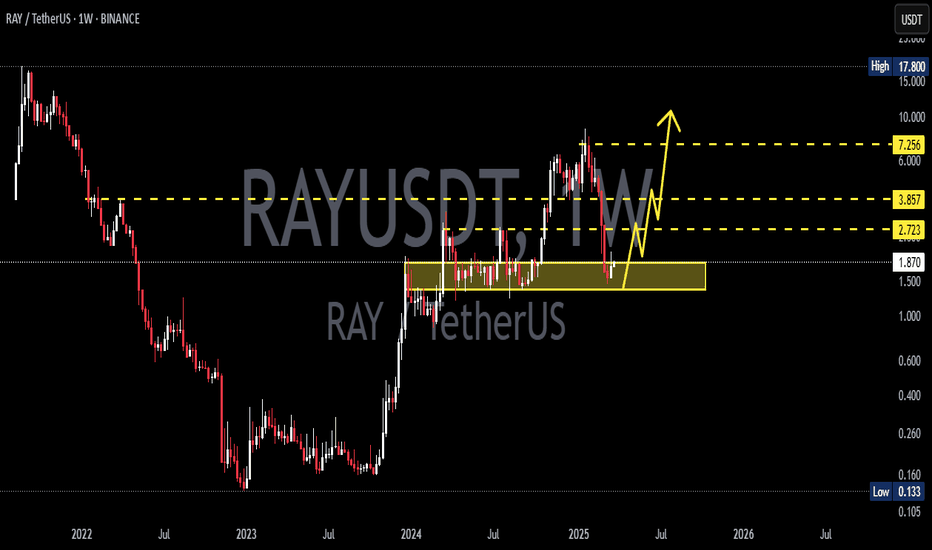
RAY/USDT — Critical Point: Accumulation or Breakdown New Lows?RAY is currently sitting at one of the most crucial structural zones, around the major support area of $1.50 – $1.96 (yellow box).
This area has acted as a key price pivot since mid-2024, where buyers and sellers have continuously battled for control.
After a sharp correction from the 2025 peak, price managed to hold above the main demand zone, with a long downside wick signaling liquidation or stop-hunt followed by immediate buying pressure.
This kind of reaction often represents a potential spring phase before a major trend reversal — if confirmed by a strong weekly close above support.
---
Structure & Pattern Analysis
Range Base / Accumulation Zone: The yellow block ($1.5 – $1.96) acts as a potential accumulation base, resembling a Wyckoff Accumulation pattern, where the spring phase (wick below support) might have just occurred.
Lower High Structure: The current structure still shows lower highs, but a confirmed higher low above $1.9 could signal a major trend reversal.
Key Resistance Levels: 2.72 – 3.67 – 7.25 – 12.68 – 16.66 – 17.80
→ These are progressive resistance targets for any mid-term bullish move.
---
Bullish Scenario
If RAY manages to close the weekly candle above $1.96 and hold, it would confirm:
A reclaim of the major demand zone.
Validation of the Wyckoff spring phase (accumulation completed).
The beginning of a mid-term trend reversal toward higher targets.
Bullish Targets:
1️⃣ $2.72 → First resistance / breakout trigger.
2️⃣ $3.67 → Range breakout confirmation.
3️⃣ $7.25 → Mid-term target zone (previous supply level).
A breakout with strong volume above $3.67 would likely trigger a larger markup phase, indicating the start of a new bullish cycle.
---
Bearish Scenario
If price fails to hold and closes weekly below $1.50, it would mean:
The main structural support has broken down.
Selling pressure could intensify toward $1.00 – $0.60.
In an extreme case, price might revisit its historical liquidity zone around $0.13.
Bearish Confirmation Signs:
Weekly close < $1.50.
Consecutive lower closes without recovery.
High-volume red candle (true capitulation, not just a sweep).
---
Technical Summary
RAY is standing at a macro decision zone — every upcoming weekly close will define whether:
The market is building a new base for the next bullish cycle,
or
Entering a continued bearish leg toward historical lows.
The area between $1.5–$1.9 is the “make or break zone.”
As long as the price doesn’t close below it, the mid-term bullish structure remains valid.
---
Trading Notes
Strong rejection candles within support = potential swing-buy opportunities (tight SL below wick).
Breakout above 2.72 with strong volume = confirmation for mid-term re-entry.
Be cautious of fakeouts — always wait for weekly candle closes before confirming bias.
---
#RAYUSDT #Raydium #CryptoAnalysis #WeeklyChart #MarketStructure #CryptoTechnical #SwingTrade #Wyckoff #DeFi #SupportZone #PriceAction #TrendReversal #AltcoinSetup #TradingViewAnalysis
Rayusdtanalysis
RAYSOL/USDT – READY TO BLAST OFF? PRIME LONG SETUPThis is where smart money is likely to reaccumulate before pushing price higher.
We're targeting internal liquidity levels and prior highs with a clean risk-reward structure.
Confirmation can come from a bullish reaction or engulfing candle within the zone.
Entry Zone: 2.25 – 2.28
Targets:
TP1: 2.365
TP2: 2.485
TP3: 2.660
Stop Loss: 2.151
DYOR:
This idea is for educational purposes and reflects a personal trading plan.
Always do your own research, use strict risk management, and wait for confirmation before executing.
#RAYDIUM #RAY #RAYSOL #RAYUSDT
Is RAYUSDT About to Break Out? Key Levels to Watch Now!Yello, Paradisers! Is RAYUSDT gearing up for a massive breakout? The chart is showing a proper triple zigzag within a descending channel, which significantly increases the probability of an upcoming bullish move.
💎If RAYUSDT bounces from the current level, it could form a W-pattern, but for a high-probability setup, we need to see a breakout and a confirmed candle close above the key resistance. This move would also break the descending channel, signaling a stronger bullish push.
💎On the other hand, if the price retraces further or consolidates, a bounce may still occur, but the setup would be lower probability, making it less favorable to trade in this zone.
💎However, if RAYUSDT breaks down and closes below the support zone, the entire bullish setup will be invalidated. In that case, it would be wiser to wait for better price action before looking for new opportunities.
🎖 Patience and discipline are key, Paradisers. If this breakout happens, it will be a strong opportunity—but if invalidated, we wait for the market to present a better setup. Trade smart!
MyCryptoParadise
iFeel the success🌴


