RAYUSDT — Testing Demand Zone?, Reversal or Breakdown Ahead?On the Weekly timeframe, RAYUSDT remains in a clear macro downtrend after forming its peak around the 8.7 USDT region. Following a distribution phase in the mid-range area (2 – 3.5), price continued declining gradually, forming consistent lower highs and lower lows.
Currently, price action is approaching a major historical demand / support zone that previously acted as the accumulation base before the massive 2024 rally.
Key zone:
0.215 – 0.160 USDT (Weekly Demand Block)
This area will determine whether the structure forms a macro bottom or continues into a deeper breakdown.
---
Pattern Explanation
1. Macro Distribution → Markdown Phase
After the parabolic rally, price entered distribution.
Wide consolidation range formed.
Support breakdown triggered further markdown.
2. Descending Structure
Characteristics visible on the chart:
Consecutive Lower Highs.
Gradual Lower Lows.
No significant bullish structure break yet.
3. Potential Double Bottom / Accumulation Base
If the demand zone holds, possible formations include:
Double Bottom.
Rounded Base.
Wyckoff Accumulation (Phase A–C).
The yellow zone acts as the last line of defense for buyers.
---
Key Levels
Resistance:
1.00 USDT — Psychological + minor structure.
1.50 USDT — Previous consolidation area.
2.30 – 3.50 USDT — Major supply zone.
5.50+ USDT — Macro distribution region.
Support / Demand:
0.573 USDT — Current reaction level.
0.215 – 0.160 USDT — Major Weekly Demand (Highlighted).
0.133 USDT — Absolute historical low.
---
Bullish Scenario
Bullish confirmation requires:
1. Price sweeps / taps the 0.215 – 0.160 demand zone.
2. Strong rejection appears (long wick / Weekly bullish engulfing).
3. Volume expansion at the lows.
4. Structure break above 1.00 USDT.
Potential upside targets:
Relief rally toward 1.00.
Continuation to 1.50.
Mid-term reversal toward 2.30 – 3.50.
If large accumulation occurs, the macro upside could expand significantly since this zone was the base of the previous rally.
---
Bearish Scenario
Bearish continuation triggers if:
1. Weekly close breaks below 0.160.
2. Demand zone fails to hold.
3. No significant volume reaction appears.
Implications:
Drop toward 0.133 (ATL retest).
If ATL breaks → downside price discovery.
Structure shifts into long-term markdown continuation.
The yellow zone would flip from demand into supply.
---
Conclusion
RAYUSDT is currently at a critical macro level.
Primary trend: Bearish.
Price is approaching major historical demand.
The 0.215 – 0.160 zone will decide reversal vs continuation.
Price reaction here will determine whether the market forms:
A macro bottom, or
A deeper bear market expansion.
Traders should wait for clear price action confirmation before taking large positions.
#RAYUSDT #RAY #Raydium #CryptoAnalysis #TechnicalAnalysis #Altcoins #SupportResistance #Wyckoff #CryptoTrading #Downtrend #Accumulation #MarketStructure #AltcoinSeason #CryptoChart
Rayusdtlong

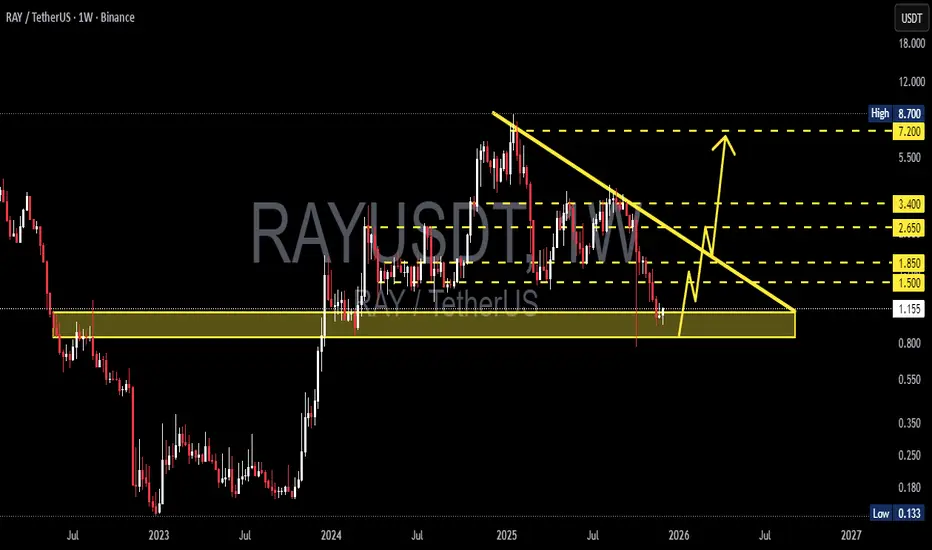
RAY/USDT – Major Decision Zone at $0.85–$1.10RAY has returned to the same demand zone that triggered every major rally over the past 2 years.
Hold this zone = potential multi-month reversal.
Lose this zone = structural breakdown.”
---
Pattern & Market Structure Explanation
The weekly chart of RAY/USDT is showing one of the clearest macro setups:
1. Multi-Month Descending Triangle (Strong Bearish Pressure)
A clean series of lower highs forming a dominant descending trendline.
This trendline has rejected every bullish attempt since mid-2024 — clear seller dominance.
2. Titanium Demand Zone: $0.85–$1.10
This zone has been the launchpad of every major RAY rally in 2022, 2023, and 2024.
Every touch of this area resulted in strong upside acceleration.
Price is now retesting it again…
This is the most important test for RAY’s macro trend heading into 2025–2026.
3. Liquidity Sweeps Are Appearing
Sharp wicks below the zone followed by rapid rejections upward.
This behavior is typical before a major direction shift — markets clean liquidity first.
Suggests big positions are being prepared beneath the surface.
---
Bullish Scenario – If This Zone Holds, a Major Reversal Can Begin
Bullish Confirmation Triggers:
Weekly close back above $1.15–$1.20.
Breakout above the descending trendline (major signal).
Increasing buying volume during the breakout.
Upside Targets:
1. $1.50 – Early resistance & first momentum checkpoint.
2. $1.85 – Trend structure recovery.
3. $2.65 – Mid-range target if momentum sustains.
4. $3.40 – Strong resistance where larger moves often stall.
5. $7.20–$8.70 – Long-term targets if a macro breakout unfolds.
Bullish Narrative:
If this demand zone holds, we might not be looking at a minor bounce —
this could be the beginning of a fresh multi-month bullish impulse.
---
Bearish Scenario – If Support Breaks, the Structure Shifts Completely
Bearish Confirmation Triggers:
Weekly close below $0.85.
No quick reclaim on the following weekly candle.
Strong selling volume on the breakdown.
Downside Targets:
$0.55 – First structural support.
$0.35 – High liquidity area.
$0.133 – Historical low (capitulation zone).
Bearish Narrative:
If this long-term support finally breaks, RAY enters a new phase of macro weakness.
Demand is absorbed, and price enters an extended redistribution cycle.
---
Core Insight: “The Last Support”
The $0.85–$1.10 zone is not just a level — it is the foundation of RAY’s macro structure.
At this zone:
Smart money typically positions
Liquidity concentrates
Market sentiment is tested
Breakdown = major shift in long-term trend.
Hold + trendline breakout = potential start of a new bullish cycle.
This is why this zone is the single most important area on RAY’s chart in the past 2 years.
---
#RAY #RAYUSDT #CryptoAnalysis #CryptoOutlook #TechnicalAnalysis #DescendingTriangle #DemandZone #Altcoins #PriceAction #CryptoTrading
RAY/USDT — Critical Point: Accumulation or Breakdown New Lows?RAY is currently sitting at one of the most crucial structural zones, around the major support area of $1.50 – $1.96 (yellow box).
This area has acted as a key price pivot since mid-2024, where buyers and sellers have continuously battled for control.
After a sharp correction from the 2025 peak, price managed to hold above the main demand zone, with a long downside wick signaling liquidation or stop-hunt followed by immediate buying pressure.
This kind of reaction often represents a potential spring phase before a major trend reversal — if confirmed by a strong weekly close above support.
---
Structure & Pattern Analysis
Range Base / Accumulation Zone: The yellow block ($1.5 – $1.96) acts as a potential accumulation base, resembling a Wyckoff Accumulation pattern, where the spring phase (wick below support) might have just occurred.
Lower High Structure: The current structure still shows lower highs, but a confirmed higher low above $1.9 could signal a major trend reversal.
Key Resistance Levels: 2.72 – 3.67 – 7.25 – 12.68 – 16.66 – 17.80
→ These are progressive resistance targets for any mid-term bullish move.
---
Bullish Scenario
If RAY manages to close the weekly candle above $1.96 and hold, it would confirm:
A reclaim of the major demand zone.
Validation of the Wyckoff spring phase (accumulation completed).
The beginning of a mid-term trend reversal toward higher targets.
Bullish Targets:
1️⃣ $2.72 → First resistance / breakout trigger.
2️⃣ $3.67 → Range breakout confirmation.
3️⃣ $7.25 → Mid-term target zone (previous supply level).
A breakout with strong volume above $3.67 would likely trigger a larger markup phase, indicating the start of a new bullish cycle.
---
Bearish Scenario
If price fails to hold and closes weekly below $1.50, it would mean:
The main structural support has broken down.
Selling pressure could intensify toward $1.00 – $0.60.
In an extreme case, price might revisit its historical liquidity zone around $0.13.
Bearish Confirmation Signs:
Weekly close < $1.50.
Consecutive lower closes without recovery.
High-volume red candle (true capitulation, not just a sweep).
---
Technical Summary
RAY is standing at a macro decision zone — every upcoming weekly close will define whether:
The market is building a new base for the next bullish cycle,
or
Entering a continued bearish leg toward historical lows.
The area between $1.5–$1.9 is the “make or break zone.”
As long as the price doesn’t close below it, the mid-term bullish structure remains valid.
---
Trading Notes
Strong rejection candles within support = potential swing-buy opportunities (tight SL below wick).
Breakout above 2.72 with strong volume = confirmation for mid-term re-entry.
Be cautious of fakeouts — always wait for weekly candle closes before confirming bias.
---
#RAYUSDT #Raydium #CryptoAnalysis #WeeklyChart #MarketStructure #CryptoTechnical #SwingTrade #Wyckoff #DeFi #SupportZone #PriceAction #TrendReversal #AltcoinSetup #TradingViewAnalysis

RAYUSDT 1W AnalysisRAY ~ 1W Analysis
#RAY Buy back gradually from this support block with a short term target of at least 15%+ from here.

RAYSOL/USDT – READY TO BLAST OFF? PRIME LONG SETUPThis is where smart money is likely to reaccumulate before pushing price higher.
We're targeting internal liquidity levels and prior highs with a clean risk-reward structure.
Confirmation can come from a bullish reaction or engulfing candle within the zone.
Entry Zone: 2.25 – 2.28
Targets:
TP1: 2.365
TP2: 2.485
TP3: 2.660
Stop Loss: 2.151
DYOR:
This idea is for educational purposes and reflects a personal trading plan.
Always do your own research, use strict risk management, and wait for confirmation before executing.
#RAYDIUM #RAY #RAYSOL #RAYUSDT

RAYUSDT 1WRAY ~ 1W Analysis
#RAY Buy gradually from here if you still have a Conviction on this coin with a short -term target of at least 20%+.

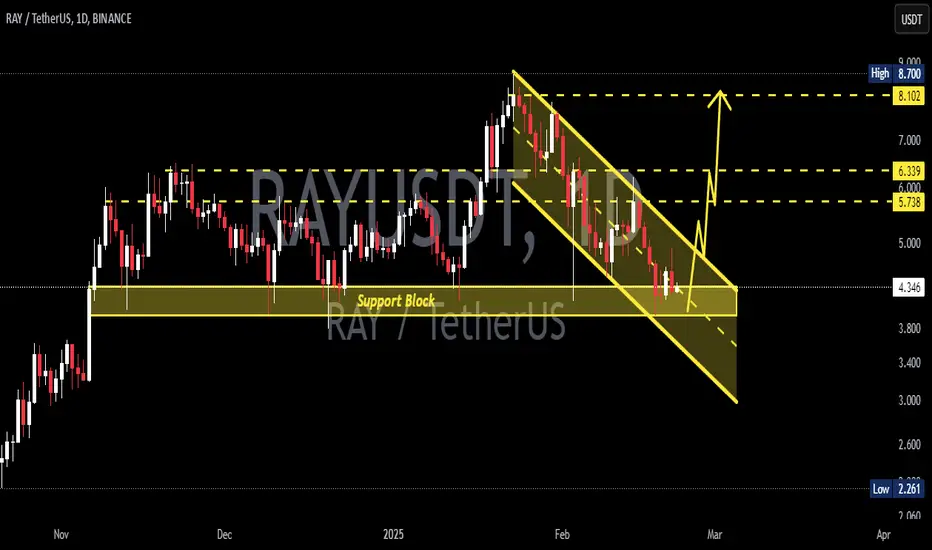
RAYUSDT 1DRAY ~ 1D Analysis
#RAY Buy from here or buy after successfully penetrating the resistant line of this pattern, with a minimum target of 15%+
#RAY/USDT#RAY
The price is moving in a descending channel on the 1-hour frame and is adhering to it well and is heading to break it upwards strongly and retest it
We have a bounce from the lower limit of the descending channel, this support is at a price of 4.80
We have a downtrend on the RSI indicator that is about to break and retest, which supports the rise
We have a trend to stabilize above the Moving Average 100
Entry price 5.05
First target 5.31
Second target 5.62
Third target 6.01

RAYUSDT 1DRAY ~ 1D Analysis
#RAY This is also one of the best coins, for now re -testing this support.Buy from here with a minimum target of 15%+

RAYUSDT 1DRAY ~ 1D
#RAY In Time Frame 1D, Formed a bullish flag. If you still have Conviction on this coin,. Buy inside this bullish pattern or wait for this resistance line to be broken.

RAYUSDT: Will the Bears Take Over or Are Bulls Lying in Wait?Yello, Paradisers! Could #RAYUSDT be on the brink of a decisive move? Let’s dive into the chart to decode the possible scenarios.
💎#RAY is currently forming a bearish Head and Shoulders (H&S) pattern, signaling a potential downward move if the pattern breaks successfully. The initial target in this case would be the $3.5–$3 demand zone, a critical level where buyers could step in and push the price back up significantly. If this rebound occurs, the next major resistance zone could serve as a strong upside target.
💎However, a more bearish outcome may unfold if RAY fails to rebound from the demand zone. A breakdown below the demand area could trigger a bearish signal, pushing the price further downward toward the $2.7–$2.3 strong support zone.
💎The historical respect of the $2.7–$2.3 zone suggests bulls might once again defend this level if tested. But traders should be cautious: a confirmed break below $2.3 could lead to a more significant dip toward the next strong support levels.
Remember, the disciplined always win in the long run. Stay sharp and trade smart.
MyCryptoParadise
iFeel the success🌴

LORD RAYDIUM - all bow to the god of lightning - BULL UPDATELORD RAYDIUM - all bow to the god of lightning - BULL UPDATE
well nailed this one. *takes a bow
anyone that listened got almost perfect entry instead of waiting on the sidelines each day for a pull back.
interestingly i reckon now is the last pull back before a short/medium term top.
not telling you where i got that fractal from either. what i can say is;
typical pumpinomics
lfg
the key guys is not the gains, but being able to sell. we gonna get that right together this round.

RAY is going to close this month bullishHello, as we took beautiful trade with RAY - 80% profit, some of you 130% profit with RAY in one trade recently... there can be continuation... Monthly engulfing green candle means that RAY is strong at the moment... at least 0.35 usdt region should be visited again in February. With power there can be another 100%+ rally. Volume was really huge at the bottom so it looks like whales are in with loaded bags... let's se. BUT MANAGE YOUR RISK AND USE STOPLOSS!
Have a great day!

Catch the Wave: Why $RAY is Set to Soar!The price action of CRYPTOCAP:SOL indicates that it’s likely to take off.
Beta plays are the things to bet on once Solana starts moving. I’d look at coins like NASDAQ:RAY , LSE:JUP , and $JTO.
The weekly trend is confirmed, but it's lacking a bit of momentum for the monthly. I still think the bet is worth it here and on a retrace into the gray area on the chart—if it actually gives that retrace.
Overall, it’s a super constructive chart.

RAY / RAYUSDTGood Luck >>
• Warning •
Any deal I share does not mean that I am forcing you to enter into it, you enter in with your full risk, because I'll not gain any profits with you in the end.
The risk management of the position must comply with the stop loss.
(I am not sharing financial or investment advice, you should do your own research for your money.)

RAYUSDTRAYUSDT is trading in falling wedge pattern. The price was reacting well the support and resistance of wedge.
Currently the price has given the massive breakout from falling wedge and after successful retest of the level will be bullish signal and seems like the price may go for another leg higher.
If the breakout sustain to upside the optimum target could be 2
What you guys think of this idea

Lord Raydium ,,, fatalitythe lord of lightning is powering up to throw his zippy zappy hat at your ass..
fatality

RAYUSDT Bullish Momentum 1H TF (1H Divergence)RAYUSDT is showing bullish momentum in 1H time frame. There is 1H divergence that shows price might be in reversal.
Trade Plan
Entry @ Buy Stop
SL @ Lower Low
TP1 and TP2 @ 1:1 and 1:2 risk and reward.

RAYUSDT Skyrockets by 202%, Reaching $0.77! 🚀🚀BoooooooM 🚀🚀 BoooooooM 🚀🚀
VIP Spot 🔥🎯
All Targets: done✅
Entry price: 0.2544$✅
Price reached : 0.7699$ ✅
Profit: 202.63% ✅🚀🚀🤑
In a phenomenal ascent, the cryptocurrency RAYUSDT has surged by an astonishing 202%, reaching an impressive price of $0.77. This remarkable performance has ignited excitement among traders, highlighting the substantial potential for gains. Stay tuned for further insights as RAYUSDT continues its upward trajectory in the dynamic digital currency landscape. #RAYUSDT #CryptoSurge 📈

RAYDIUM new volume and more gain 🚀Hello 🐋
based on the chart
we can see new volume for the price 📖💡
and
we expect to see more gain for the price in log term targets 🚀💣
Please, feel free to share your point of view, write it in the comments below, thanks 🐋

Raydium (RAY) formed bullish Gartley for upto 42.50% rallyHi dear friends, hope you are well, and welcome to the new trade setup of Raydium (RAY) with US Dollar pair.
Recently we caught almost 41% pump of RAY as below :
Now on a daily time frame, RAY has formed a bullish Gartely move for another bullish reversal move.
Note: Above idea is for educational purpose only. It is advised to diversify and strictly follow the stop loss, and don't get stuck with trade.

RAYUSDT if you have missed other trades today you can enter thistarget and stoploss are shown in the chart. just posted this idea for an extra trade for today and didn't enter it myself because I have two open positions.
RLong

#RAY/USDT Scalp Trade SetupRAYUSDT Trade Setup.
Opened Long position.
ENTRY: $2.352 to $2.41
Target :- 7% to 10%
Stop Loss:- $2.323 (-1.5% avg)
Risk reward: 1:4 (Low-Risk High Reward)
Lev: keep as low as possible to stay safe.
The strategy is to get in and out.
R: R is good but SL is a must.
With very low SL reward is good.
Ladder in partially,
ALWAYS PLACE YOUR STOP LOSS you never know, BTC has been acting weirdly for months.
Better to stay safe.
#DYOR before taking this trade.
Do hit the like button if you want me to post more trade setups.
Stay tuned
Thank you
#PEACE
RLong
