Algo's Logic: Why price moves ''crazy'' with red folder news?WHY PRICE MOVES LIKE THIS
The market is not a chaotic auction of buyers and sellers seeking fair value; it is a highly engineered delivery system designed to seek and destroy liquidity. The current consolidation you see is not indecision; it is a 'Liquidity Coil'. The algorithm is purposefully compressing price action ahead of the 'Red Folder' events to engineer a 'Straddle Inducement'.
By keeping the range tight, the Interbank Price Delivery Algorithm (IPDA) encourages retail traders to place tight buy-stops above the range and tight sell-stops below it. This creates two massive pools of liquidity—fuel for the machine. The news event is not the cause of the move; it is the 'Key' that unlocks this volatility. The initial move is almost always a 'Judas Swing'—a fraudulent manipulation designed to trigger one side of these stops (usually the sell-stops below) to harvest the necessary liquidity to fuel the *real* move in the opposite direction. We do not trade the news; we trade the algorithmic reaction to the liquidity harvest.
THE THESIS
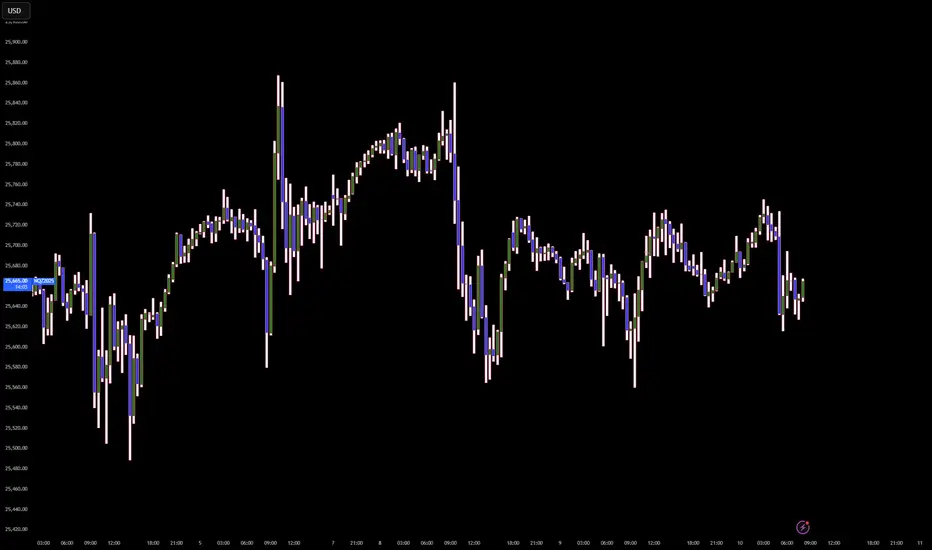
The algorithm is currently in a 'Suspended State' of pre-event accumulation utilizing the impending volatility of the Macro Data Injection to engineer a classic 'Judas Swing' manipulation. The narrative is strictly governed by the 'Seek and Destroy' protocol: The market will utilize the news release to aggressively harvest the internal Sell-Side Liquidity (SSL) resting below the 25,550.00 shelf to fuel the terminal expansion towards the external Buy-Side Liquidity (BSL) at 25,900.00.
THE EXECUTION VECTOR
Entry: 25,525.00 (Buy Limit / Post-News Reclaim)
Stop loss: 25,380.00 (145.00 points)
Take profit: 25,950.00 (425.00 points)
Risk to reward ratio: 2.93R
THE CAUSAL RATIONALE
The Pre-News Narrative (The Trap)
Current price action (25,650.00) is a 'Volatility Compression' zone. The algorithm is holding price in a narrow range. Do not trade the drift. The drift is the bait. The algorithm is waiting for the 08:30 AM / 10:00 AM timestamp to unlock the high-velocity engine. The 'Red Folders' are simply the authorized time windows for the Market Makers to reprice the asset.
The News Event (The Judas Swing)
Upon the data release, expect an immediate, violent displacement. The highest probability vector is a 'False Bearish Breakout' (The Judas Goat). The algorithm will likely spike price DOWN into the 25,550.00 - 25,500.00 region. This serves two purposes:
1. Trigger the sell-stops of the overnight longs.
2. Induce breakout sellers to provide the necessary Buy-Side liquidity for the Smart Money to fill their long orders at a discount.
The Post-News Expansion (The Real Move)
Once the SSL is harvested and the 25,500.00 region (Bullish Order Block / FVG) is mitigated, look for an impulsive reclaim of the 25,600.00 level. This 'Sponsorship' signal confirms that the low is in, and the algorithm will switch to a 'Low Resistance Liquidity Run' targeting the clean highs at 25,900.00.
THE INVALIDATION (THE OMEGA POINT)
The bullish news model is ontologically corrupted if the news candle displaces below 25,380.00 and *sustains* acceptance there (15-minute close). A simple wick is not invalidation; it is a feature. But a closure below this level implies the macro data has triggered a 'Risk-Off' regime shift, targeting deeper discount arrays at 25,000.00.
KEY TRAJECTORY WAYPOINTS
Target 1: 25,750.00 | Type: Equilibrium / Initial Rebound | Probability: 90%
Target 2: 25,900.00 | Type: External Buy-Side Liquidity | Probability: 75%
Target 3: 26,100.00 | Type: Blue Sky Expansion | Probability: 40%
THE SHADOW REALITY
A 30% probability exists for the 'Bull Trap' scenario. In this reality, the news spikes price UP first into 25,850.00. If the first move is UP, fade it. The algorithm rarely gives the true move first during high-impact news.
RED
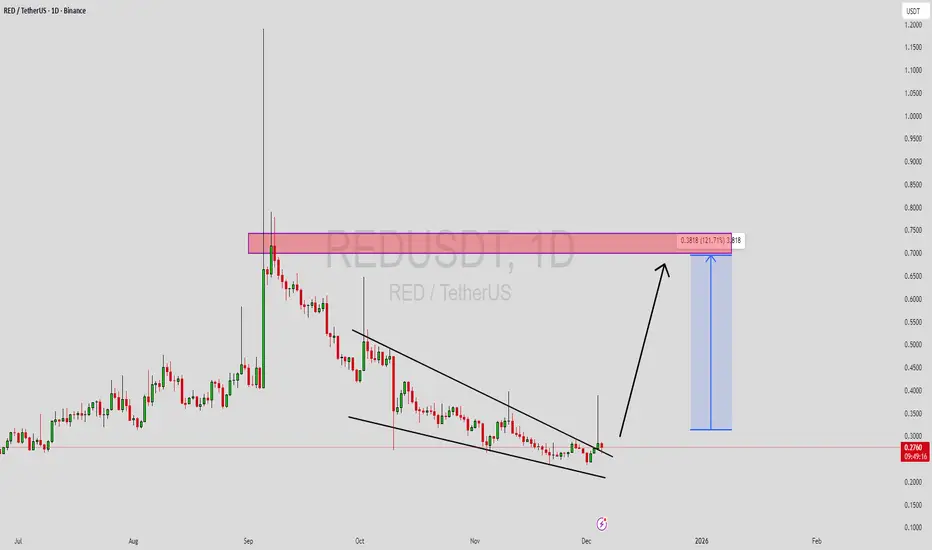
REDUSDT Forming Falling WedgeREDUSDT is forming a clear falling wedge pattern, a classic bullish reversal signal that often indicates an upcoming breakout. The price has been consolidating within a narrowing range, suggesting that selling pressure is weakening while buyers are beginning to regain control. With consistent volume confirming accumulation at lower levels, the setup hints at a potential bullish breakout soon. The projected move could lead to an impressive gain of around 90% to 100% once the price breaks above the wedge resistance.
This falling wedge pattern is typically seen at the end of downtrends or corrective phases, and it represents a potential shift in market sentiment from bearish to bullish. Traders closely watching REDUSDT are noting the strengthening momentum as it nears a breakout zone. The good trading volume adds confidence to this pattern, showing that market participants are positioning early in anticipation of a reversal.
Investors’ growing interest in REDUSDT reflects rising confidence in the project’s long-term fundamentals and current technical strength. If the breakout confirms with sustained volume, this could mark the start of a fresh bullish leg. Traders might find this a valuable setup for medium-term gains, especially as the wedge pattern completes and buying momentum accelerates.
✅ Show your support by hitting the like button and
✅ Leaving a comment below! (What is your opinion about this Coin?)
Your feedback and engagement keep me inspired to share more insightful market analysis with you!
BTC Enters Breakdown Area — Volume Could Push Back Below $110KBTC Enters Breakdown Area — Volume Could Push Back Below $110K ⚠️
The previous volume that took BTC before 101K has some trends of this volume, which has a manipulation views, the volume before that did took BTC below 101K ended with a fakeout.
Bitcoin has entered the breakdown area, showing early weakness as price struggles to hold momentum near $115K.
The recent volume spike looks more like distribution pressure than accumulation, signaling that a correction phase could be forming.
📉 Current outlook:
Breakdown zone between $116.3K – $109.7K is active.
Volume is rising, but without strong upward continuation — a sign of selling absorption.
If this pattern holds, BTC could retest the $110K zone or drop slightly below in the next move.
📊 Observation:
The market is testing the upper side of the breakdown range but lacks follow-through.
A close back under $114K would confirm weakness and invite further downside momentum.
💬 Summary:
BTC is inside its breakdown area, and current volume suggests pressure may build to drive price back below $110K if buyers fail to reclaim control soon.

Bitcoin lost its low time frame — red day pressure aheadBitcoin has lost the low time frame structure around the $114.6K – $114.8K zone, signaling a possible shift in short-term momentum.
The break below this area indicates weakness, and BTC is now testing the mid-range levels while showing signs of slowing volume.
📉 Short-term view:
Momentum has turned bearish after rejection from $115.8K.
Next support zone sits around $108K – $109K, where buyers may try to step in.
If this level fails to hold, BTC could revisit $103K support — the key demand area from the previous range.
📊 Technical observation:
BTC’s structure shows a completed short-term top followed by a lower high formation.
This setup often confirms a local downtrend and can lead to several red candles before a new base forms.
💬 Summary:
Bitcoin lost its low time frame momentum, and we could be entering a red session.
We’ll monitor how price reacts near the $108K support zone to evaluate if buyers can regain control or if a deeper correction begins.
We follow the data, at this moment the marketview seems to be red, we will follow if this continues in the coming hours.

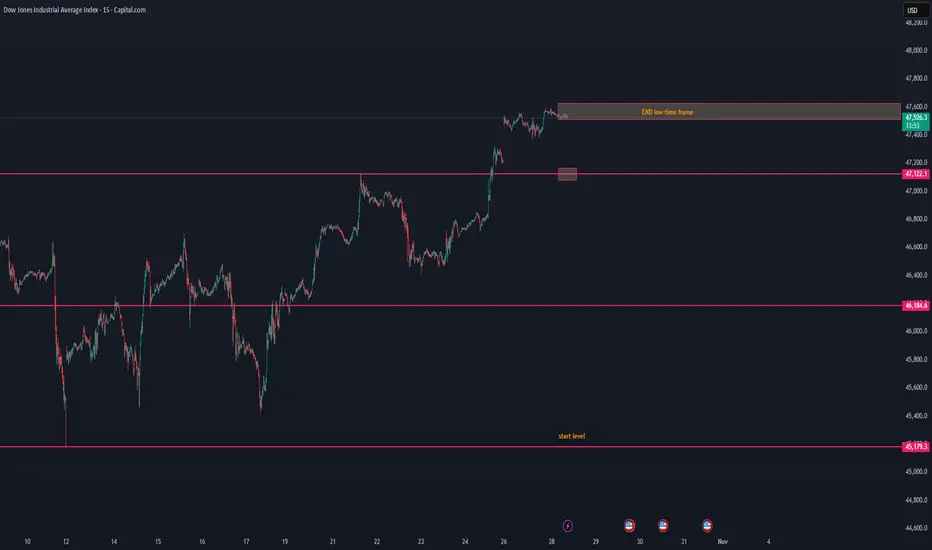
US30 lost its low time frame — possible breakdown aheadUS30 lost its low time frame — possible breakdown ahead ⚠️
US30 has lost its low time frame structure, showing early signs of weakness after the recent push to 47.5K.
The current price action suggests that momentum is fading, and sellers may start to take control.
📉 Short-term view:
Structure break below 47.5K zone confirms loss of bullish control.
The next visible support area sits around 47.1K, followed by 46.1K.
With time, price could continue to drift down toward the start level near 45.1K if buyers fail to defend.
📊 Observation:
Volume has started to cool off, and price is trading below the short-term EMA range — a typical setup before a gradual downward retrace.
💬 Summary:
US30 lost its low time frame momentum and looks to break down step by step toward the start level zone. We’ll monitor if buyers can react near 47.1K or if this becomes a broader correction phase.
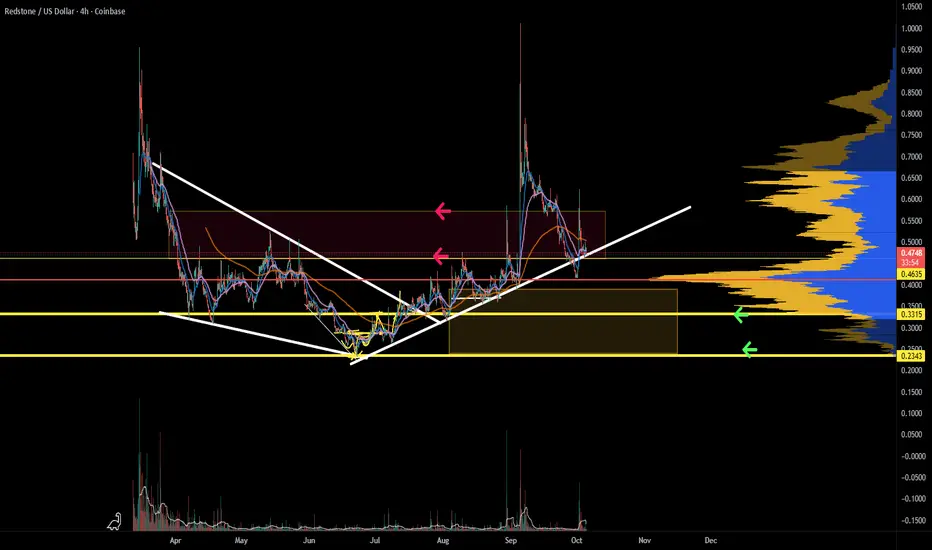
Redstone chart full of manipulationRED price action is clearly being manipulated for whale accumulation. Bottom prices may never come again; taking advantage of 2nd opportunities is key. The current market structure is not providing an edge. Spot accumulation is ideal.
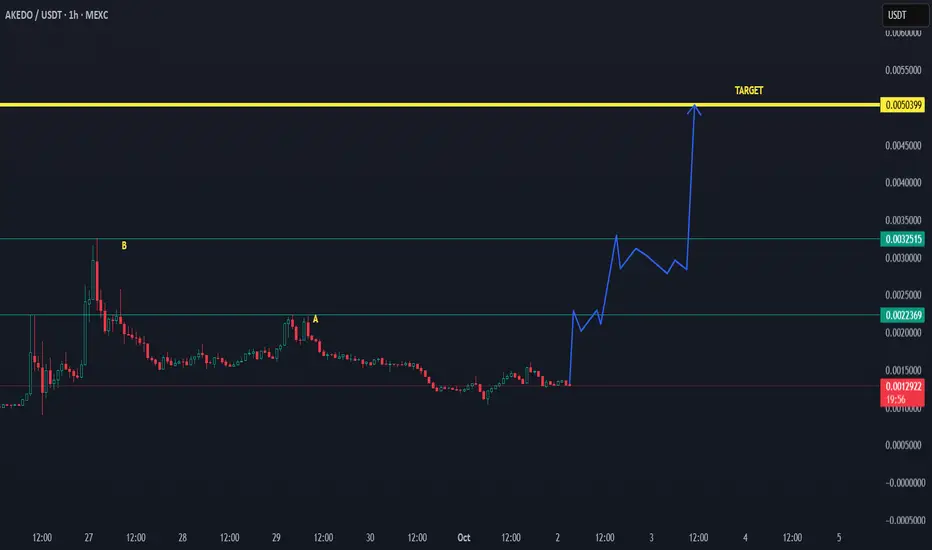
AKE/USDT STARTING TO MAKE A HISTORY.. UPDATE 02-10-2025📊AKEDO/USDT Trading Update
Price has been consolidating after a long decline, forming a potential cycle bottom.
The chart shows step-by-step breakout levels:
First resistance at 0.00223 USDT
Next confirmation level at 0.00325 USDT
If momentum continues and these levels flip into support, the structure supports a push toward the main target of $0.005.
✅ Outlook: As long as price stays stable and buyers hold the base, the chance of a strong breakout remains high. The pattern suggests a possible cycle rally with over 3x upside potential.
RCAT - Red Cat Holdings - $12.81 PTNASDAQ:RCAT has been consolidating from it's $12.81 since reaching that price level back in July '25. It's been having issues breaking above the $10.12 Price Level of Resistance, but if it does and finds support, we could see this running back to retest the $12.81.
This comes after Red Cat Drones are added to the NATO Catalog. With the recent upticks in concerns in the Middle East, as well as Europe, that could be a catalyst to continue pushing RCAT further up.

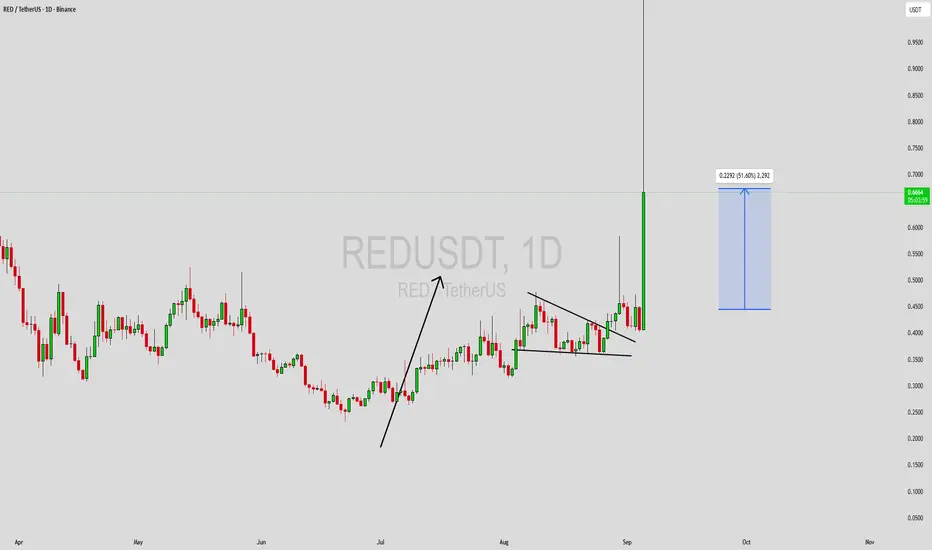
REDUSDT Forming Falling WedgeREDUSDT is currently forming a falling wedge pattern, a bullish reversal setup that often indicates the end of a downtrend and the beginning of a strong upward move. This structure reflects tightening price action, with lower highs and lower lows converging, typically followed by a breakout to the upside. Based on this setup, REDUSDT is positioned for a potential rally, targeting gains of around 40% to 50%+.
The trading volume is showing stability, which adds confidence to the wedge formation. A steady flow of volume suggests that accumulation is taking place, as investors quietly position themselves ahead of a possible breakout. If momentum builds and breaks past resistance, the move could accelerate quickly, validating the bullish outlook.
Market sentiment around REDUSDT is improving as more investors begin to recognize the strength of this technical setup. The project has been gaining traction, and investor interest is helping fuel speculation about its potential growth. With traders watching closely, a successful breakout could draw even more attention, increasing liquidity and supporting sustained price action.
In summary, REDUSDT is preparing for a significant opportunity, with the falling wedge pattern signaling the likelihood of a bullish move. Combined with solid volume and growing investor interest, the coin looks ready to deliver notable returns in the near future.
✅ Show your support by hitting the like button and
✅ Leaving a comment below! (What is You opinion about this Coin)
Your feedback and engagement keep me inspired to share more insightful market analysis with you!
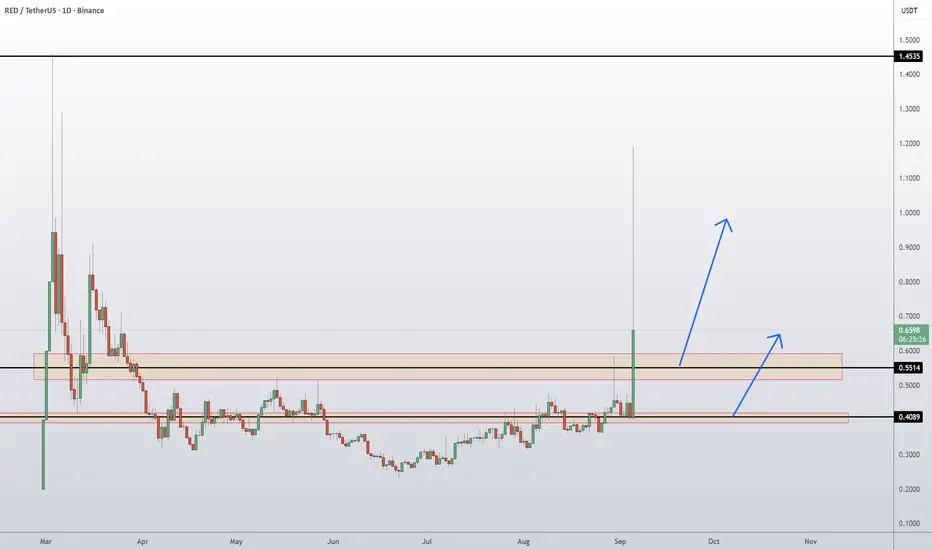
RED Coin RedStone Token Price Prediction and Technical AnalysisRED/USDT has broken out of its long consolidation phase with a sharp rally, showing strong momentum. Price surged above the 0.5514 resistance and is now trading around 0.6703, attempting to hold above this breakout structure. If buyers maintain control, continuation toward the major resistance at 1.4535 is possible. However, if price fails to sustain above the 0.5514–0.70 supply zone, a pullback to retest 0.4089 support could unfold before another leg higher.
📈 Key Levels:
Buy trigger: Successful retest/hold above 0.5514 support-turned-demand
Buy zone: 0.55 – 0.70 region
Target: 1.4535 major resistance
Invalidation: Daily close below 0.4089 (would negate bullish structure)
👉 Follow me for More Real Time Opportunities.
Share your Thoughts if you have any?
SPOT BREAKOUT ALERT - RED/USDT📈SPOT BREAKOUT ALERT 📈
BME:RED is up average +65% today, but I think bulls could push price much higher!
Quick stats:
✅ $2.4B+ TVL, 300k+ users
✅ Live on Binance Loans
✅ Integrated with 50+ protocols, securing 25+ DVNs
✅ Kelp: 2nd largest LRT on ETH
✅ Leading staking infrastructure on BNB Chain
Currently, I expect to see a short term bearish correction before to see a next big move upward!
Key demand zone:
0.570 - 05800 & 0.5300 - 0.500$

#RED/USDT – Too Late, or One More Chance?#RED
The price is moving within a descending channel on the 1-hour frame, adhering well to it, and is heading for a strong breakout and retest.
We have a bearish trend on the RSI indicator that is about to be broken and retested, supporting the upside.
There is a major support area (in green) at 0.4320, which represents a strong basis for the upside.
For inquiries, please leave a comment.
We are in a consolidation trend above the 100 moving average.
Entry price: 0.4478
First target: 0.4657
Second target: 0.4885
Third target: 0.5213
Don't forget a simple matter: capital management.
When you reach the first target, save some money and then change your stop-loss order to an entry order.
For inquiries, please leave a comment.
Thank you.

RED Market Update📊 RED Market Update
RED is currently retracing after its recent move 📉
If you missed the first entry or are looking for a re-entry / more accumulation, the smart play is to wait for price to reach the green support zone 🟢
👉 Volume Profile shows strong buyer accumulation at this level.
👉 If price pulls back and confirms a bounce, it could provide a high-probability long setup 🎯
⚠️ Reminder: Patience pays — entering at support with confirmation gives the best risk/reward.

REDUSDT Forming Falling WedgeREDUSDT is attracting fresh eyes in the crypto community as this pair sets up for what could be a remarkable bullish move. The recent chart shows price action consolidating within a falling channel, hinting at a potential breakout scenario if the resistance trendline is successfully breached. With a strong volume profile backing this setup, REDUSDT is showing signs of healthy accumulation, suggesting that market participants are quietly building positions in anticipation of a trend reversal.
Many crypto traders are now closely watching REDUSDT because of its high-risk, high-reward potential, with an expected gain of 90% to 100%+. If the breakout confirms, the upside move could be sharp and decisive, driven by both technical momentum and fresh investor sentiment. This aligns with broader market conditions where investors are increasingly hunting for altcoins that can deliver outsized returns in a short period.
What makes REDUSDT even more compelling is the growing interest among investors in the underlying project and its ecosystem. A surge in community engagement and positive developments could serve as fundamental catalysts to sustain this projected bullish momentum. For traders, this setup could present a unique opportunity to catch an early trend before it gains mainstream attention.
✅ Show your support by hitting the like button and
✅ Leaving a comment below! (What is You opinion about this Coin)
Your feedback and engagement keep me inspired to share more insightful market analysis with you!

RED looks bearish (4H)From the point where we placed the red arrow on the chart, the RED correction has begun.
It seems to be inside an ABC structure, and we are currently in wave C, which is bearish.
A demand zone is visible on the chart, which could temporarily reject the price upward.
Since wave B did not retrace more than 0.618 of wave A, it is expected that the low of wave A will be taken out.
For risk management, please don't forget stop loss and capital management
Comment if you have any questions
Thank You

RED New Update (4H)This analysis is an update of the analysis you see in the "Related publications" section
The previous analysis scenario has expired, and this update's scenario is valid.
Given the time correction of recent waves and the absence of sharp drops, this scenario for RED is valid, and buyers' footprints can be seen on the chart.
We expect a strong rejection to the upside from the green zone.
From the point where we placed the red arrow on the chart, it seems that RED's correction has started, which appears to be either a diametric or a triangle.
Wave C itself has formed a diametric, and it is expected to end in the green zone, leading to a bullish wave D.
The closure of a daily candle below the invalidation level will invalidate this analysis.
For risk management, please don't forget stop loss and capital management
When we reach the first target, save some profit and then change the stop to entry
Comment if you have any questions
Thank You

RED buy/long setup (4H)It is one of the new symbols with a bullish chart.
A bullish CH is present on the chart. A supply zone has been cleared. A strong demand zone is located at the bottom.
We are looking for buy/long positions in the demand zone.
Targets are marked on the chart.
A daily candle close below the invalidation level will invalidate this analysis
Do not enter the position without capital management and stop setting
Comment if you have any questions
thank you

redTo reach higher prices, the red box must be broken. We have a support area in the green box, if the price cannot be supported in this area, it can be led to the blue box and the process to break the red box will be difficult and tiring.

RED in Consolidation: Is a Breakout Around the Corner...?🚨 Current Market Update on RED 🚨
RED is currently consolidating between key levels:
💥 Resistance: 0.5925
💥 Support: 0.5670
We have two possible scenarios unfolding:
1️⃣ Bullish Breakout: If RED breaks through the resistance at 0.5925 and closes above it on the hourly chart, look for a potential long entry on the retest.
2️⃣ Bearish Breakdown: If RED breaks below 0.5670, we could see a sharp decline toward the next major support at 0.4000.
It's best to sit tight and enjoy your coffee ☕️ while we wait for a clear signal. 📊

BTC/USDT RED LOW TIME FRAMEThis is a low time frame update which shows that BTC has the chance to have a correction in the coming time frame, the weekend trend.
We will follow the trend and see if these red signals are confirmed in the coming time frame.
We followed the BTC before, from a 54K to 62K trend. as this below update shows
About the side where BTC is going, we can't know, since we only follow data.
we never hope for a trend where BTC can go since we always check all 2 sides and where data shows a high chance.
our statics show that we are the best of all coins with data in BTC long term.
Knowing this is BTC there can be always manipulation in trends that can make fake liquidity before it will enter the real liquidity, we have seen before at 56650 before increasing to 62K, in a different way can always happen. make always plan..
data shows there is a chance that 70% BTC will make first a correction

LONG Bitcoin during RED days always!Morning lads,
Figured I'd share my view on BTC for the following weeks.
There's a chance that instead of a channel, its a descending triangle on the daily, bringing prices to 50k.
But Im gonna keep that in mind and hope we move up!
This trade would help alts tremendously as well..
Trade thirsty, my friends..

RED! Long RED!Evening fellas,
This chart to me looks like one of the best.
I think its a cup and handle formation building-up.
Keep an eye on it.
Trade thirsty.

TOTAL -- red strong short arrowstrong short showing over the top of the week view of total crypto similar to Cryptex finance's TCAP. This is a new week and brand new candle signal.
