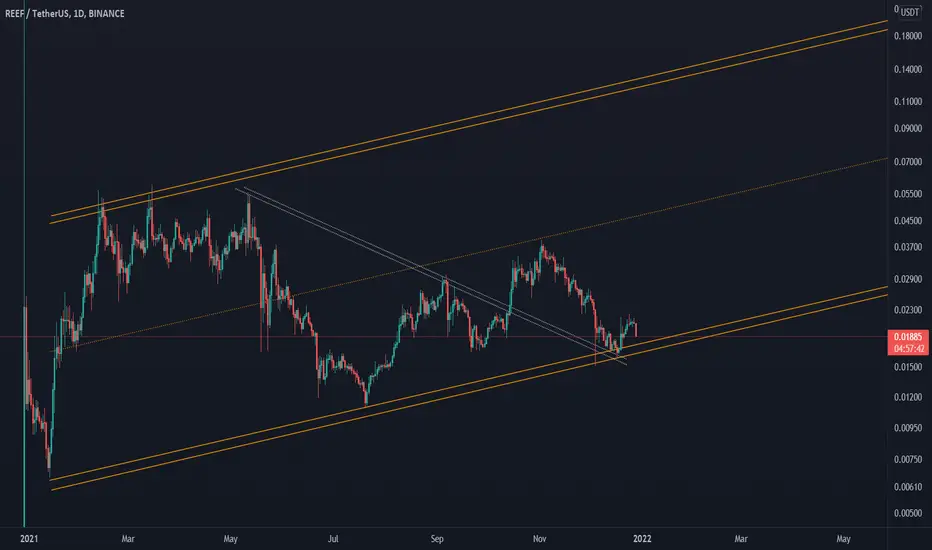
reefIt is on the bottom of the ascending channel and Trigger Price Action has activated itself It can go down to the bottom of the canal, but overall it is a long-term uptrend.Rby Aliirezaeii5
REEF BTC update predictions and analysisFollowing The DOT polkadot news on parachains next month I foresee good growth on the ecosystem and related projects On the chart I put some notes with some ideas regarding resistance levels and targets. Purple ascending channel nicely showing the uptrend continuation as well as fib retracements and extensions in confluence White trend line also just for indication of where the trend could lead in confluence with breakout 1.618 could just be the start of the major bull run. Timeline more or less in line with the rest of this year, with final TP4 around DecemberRLongby Andy1GPUpdated 10
REEF BTC 2022 new analysisDescription on chart Lengthening cycle in play REEF not dead yet have some hope ))RLongby Andy1GP4
REEFUSDT-LONGThere is a long position in REEFUSDT Reef REEFUSDT Reef 🔵Long Now or set on Key Level 0.02110 🟢Target 0.02215 ❌Stop loss 0.02070 #K_Level Please support our activity with your likes and comments. RLongby NamchaTa114
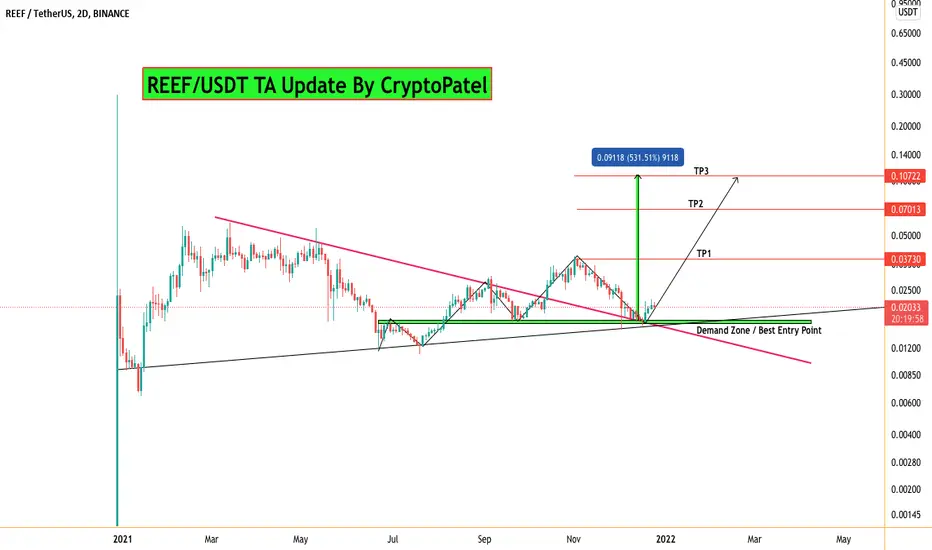
REEF/USDT Breakout and Retest done so Now Ready to 500% up move?#REEF/USDT TA Update:- $REEF currently trading at $0.0204 As per chart already broke out Resistance and Tested Retest level at Support. Now..? Now I am expecting Big move from here and I am expecting 500% gain from here in Near months. High Demand zone is Best Entry zone. Accumulation area= $0.0170-$0.020 Targets:- $0.0370/$0.0.07/$0.1 Stop Loss:- $0.0160 RLongby CryptoPatel1165
REEF breaks its downtrend for price and RSI. Recovery ahead?Reef Finance finally broke out of its latest downtrend that now lasted over a month. The support around 0.0165$ held and we got a nice bounce that pushed us through the downtrend trendline. Next resistance lines are at 0.036$ and 0.05$. We spot a similar pattern on the RSI where we expect the next resistance to be around 70. Currently 16 billion REEF tokens out of 20 billion are in circulation. This is good in terms of inflation risk, meaning there is basically none. The current price level looks like a nice entry for a long position. Feel free to comment or ask anything you like. Always do your own research and keep in mind that my charts and comments cannot be considered financial advice. Cheers CtumblerRLongby tumbler552210
REEF Dream ChartThe Reeffinance project is a good cryptocurrency. It has been on the decline for a long time. This is my dream chart. It contains only my opinion. NOT FİNANCAL ADVİCE / YATIRIM TAVSİYESİ DEĞİLDİR. RLongby alisanargun5
REEF almost bottom and potential to increase 250%DCA is the best strategy. DISCLAIMER: I am NOT a financial adviser. None of what I have communicated verbally or in writing here should be considered as financial advice; it is NOT. Do your own research(DYOR) before investing in any digital asset, and understand that investing in any cryptocurrency is risky. If you do, you need to be prepared to lose your entire investment.RLongby routinestation336
REEF is having a great updates very bullish newsReef is now in good zone for buying...buy in spot in two zones 0.018 to 0.017 and 0.010 to 0.012 and sell at 0.027 to 0.037 and this last one zone for selling is not sure hit or not but maybe hit 0.050 so don't take huge risk I'm not a financial advisor...I also watching btc is not in well area so that's why be careful and also do your own research.... update is Steam ecosystem basket development and launch.RLongby cryptopointpkk2
REEF potencial bull run?As you can see on the chart I have mark my RED POI ( KL ) that reacted very well for an entry, I secure a 200% return. REEF has been accumulating since the release of the token with a healthy supply and growing volume . What we expect? Currently price is moving back to our POI 0.012 - 0.010$ for another tap. If price respect this level I would be lookin a bull run between January-February. If price don"t respect my zone, there are possibilities for a Spring . Then I will open my ORDER on my rebound level. My TP : TP1: 0,10$ TP2: 0,25$ TP3: 0.40$ Depending on how the project goes and the complete progress of the roadmap, I will continue to hold REEF. Bull run expected to be in 2022. RLongby BRWGTRADING222
REEF at bottom and potential to increase 150%#REEF/USDT $REEF is above long term ascending support, holding this support can increase price to resistance zone, breaking this resistance will cause at least 150% increase. breaking down from current support will drop price to support zone.RLongby parissap337
REEFUSDT-SHORTThere is a short position in REEFUSDT REEFUSDT REEF 🔴Short Now or set on Key Level 0.01985 🟢Target 0.01590 ❌Stop loss 0.02100 #K_LevelRShortby NamchaTa115
🔥REEF long by trend#REEF/USD 🔥REEF long by trend, short stop loss. good patentialRLongby MoneyMakerTrade11
Reef looks strong on weekly!Reef is completing weekly correction, a huge pump could be expected within next 1-2 months. On the weekly it looks bullish, completed 'W' pattern. A double bottom on the daily should be considered though.RLongby poplach5
reef short termI show 2 possible scenarios with arrows. Reef still in accumulation lets go ! Rby OGLOG315
REEFUSDT-LONGThere is a long position in REEFUSDT REEF REEFUSDT REEF 🔵Long Now or set on Key Level 0.02375 🟢Target 1 0.02525 🟢Target 2 0.02700 🟢Target 3 0.02970 ❌Stop loss 0.02222 #K_LevelRLongby NamchaTa2
REEF Perfect ENTRY for a LONG Position.Reef is looking very good for a LONG position right here. REEF sits exactly at support level. ENTRY: between 0.024-0.025 STOP LOSS: 0.02063 TAKE PROFIT: 0.05616 *NOT FINANCIAL ADVICE* *DO YOUR OWN RESEARCH* RLongby f0xiEE8
REEF BUY IT NOW you know when it happens twice then its gone happen for the third time (look at the yellow highlight) , reef is going on a up trend channel and we should see the top again " ALWAYS USE TP AND SL , THIS DOESN'T MEAN THAT YOU DONT TRUST YOURSELF "RLongby aref009815
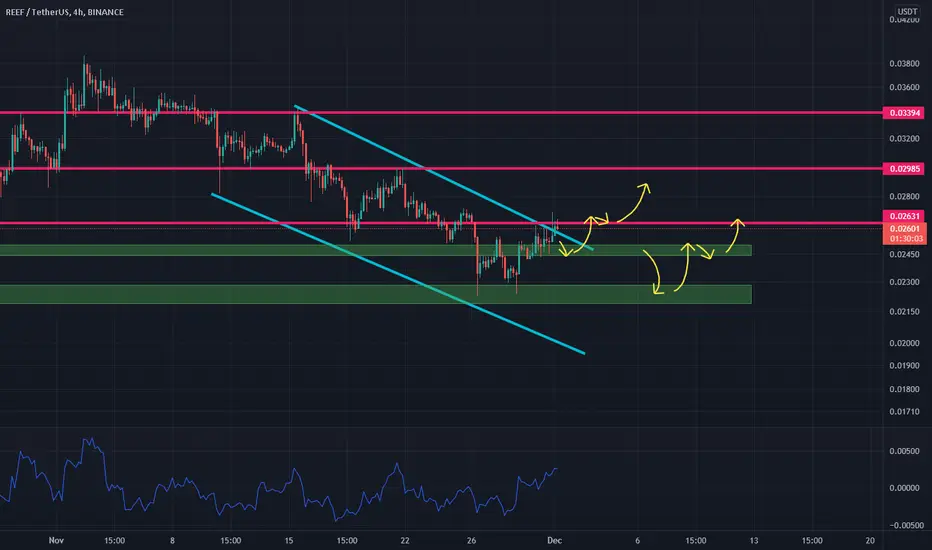
REEF in the support zone - could bounce here! Here's a quick Look at REEF 4 hr chart. As we can see, the price has been forming a bigger descending triangle and we could see a bigger break either way soon - BTC just need to get stable! Definitely one to keep an eye on. The best entry would be, when the price breaks above the descending triangle with good amount of volume . ------------------------------------------- The idea is: Buy the breakout from the descending triangle and take profits at the levels shown in the chart. Targets: 1. 0.0295$ 2. 0.032$ 3. 0.034$ 4. 0.038$ ------------------------------------------- What are triangles when it comes to trading? Key points: "1. In technical analysis , a triangle is a continuation pattern on a chart that forms a triangle-like shape. 2. Triangles are similar to wedges and pennants and can be either a continuation pattern, if validated, or a powerful reversal pattern, in the event of failure. 3. There are three potential triangle variations that can develop as price action carves out a holding pattern, namely ascending, descending, and symmetrical triangles." ------------------------------------------- If you like the content, then make sure to comment and like the post :D Follow me for daily profitable trading setups BTC dictates the market. If BTC falls, then Alts will fall as well. Trade safe!RLongby MBM_Crypto2227
REEF/USDT BULLISH TREND SCENARIOREEF/USDT Make HH twice, confirm REEF is bull trend Dont miss it REEF will EXPLODE SOON! Please use my IDEAS for your SIGHT, do not copy 100% from my chart Line on my chart is cluster and projection from the fibonacci WOW TODAY WE MAKE 4 IDEAS Im so happy can SHARE with you guys!! Lets make profit together #INDONESIA #tipsfortradingplanningRLongby Andreas_TTP2211
REEF USDTMy idea about REEF. what do you think about my idea? Long time go REEF to 0,005 - 0,007 usd. Later to the moon. Thanks for the comments.RShortby df777Updated 20204
ReefusdtElliott waves Principles Forecast Waiting For buy Trigger Sup and Res PriceactionRLongby Allver_Fx2
REEFUSDTHello Crypto Lovers, Mars Signals team wishes you high profits. We are in a daily time frame. As you can see, the price is fluctuating near the support line and below the resistance line. The RSI indicator shows a positive divergence that can lead to a price increase. But if the resistance line breaks and the price stabilizes above it, we can buy for higher targets, and if we lose the support, we consider more drops. Warning: This is just a suggestion and we do not guarantee profits. We advise you analyze the chart before opening any position. Wish you luckRby MarsSignals9