RENDER – Nvidia’s Favorite GPU Coin Testing Demand Zone RENDER – Nvidia’s Favorite GPU Coin Testing Demand Zone 🔍🎯
Render just kissed the $1.91–$2.00 demand zone — the base of the macro channel and a textbook long-term retest level.
This is not just any altcoin. Render powers the Las Vegas Virtual Dome and is the only crypto Nvidia has ever name-dropped — why? It uses thousands of AI GPUs. This is serious infrastructure-level tech.
Technically, we’ve got:
A macro bullish channel going back to 2021 📈
Touching the lower green trendline
Fib targets at $7.35 , $9.00 , and potentially $13.27 (0.618 golden zone) if this cycle ignites
The RSI and momentum indicators? Brutal lows. That’s how macro bottoms look.
If you believe in AI, decentralization, and GPU-based rendering — this is one of the most asymmetric plays out there right now.
Thought of the Day 💡
We keep chasing shiny altcoins when the real tech gems — the ones building AI infrastructure — are hiding in plain sight. Don’t sleep on conviction.
Disclaimer:
Disclaimer: Nothing I post is financial advice. It's perspective. I’ve mastered the art of prognosis, but you are the one behind the trigger. Always know your levels, and respect your risk.
One Love,
The FXPROFESSOR 💙
Render
The RENDER Chart Is Quietly Turning Constructive Again* The Render price looks like it’s settling down after the dip, with buyers starting to step in and defend higher levels.
* On-chain data indicates this move isn’t driven by panic or hype, but by a market that’s slowly finding balance again.
* Support and resistance zones are becoming clearer, which usually matters most right before the next meaningful move.
When you step back and look at what Render has been doing lately, the mood feels very different from before. There is no panic, no sudden plunge, no sensation of a market making a run for the exits.
After its bounce from the lower levels, it seems that the RENDER price has stopped moving downwards and has started moving in a horizontal fashion.
Over the last period, the Render price has stayed inside a fairly tight range. That kind of action can feel frustrating if you’re expecting quick follow-through. Volume cools off, momentum fades, and attention drifts because nothing dramatic seems to be happening.
But this is actually the part that matters. Render isn’t slipping back into its old downtrend. When price dips, buyers show up. When it moves higher, it pauses at resistance. Sellers aren’t pressing anymore, and buyers aren’t chasing.
What you’re seeing is balance, and balance often appears when a market is adjusting after a structural shift. This behavior is typical early in trend changes. Markets rarely move straight up after long declines. They pause, compress, and force patience before making their next decision.
On-chain data supports that view. Render’s market cap isn’t bleeding during this sideways phase. It’s holding steady, which suggests capital isn’t leaving the market.
What’s next for RENDER?
From here, structure matters more than hype. As long as the RENDER price holds higher support while grinding under resistance, the setup stays constructive. Render is quiet right now, but that kind of calm is often what shows up before a meaningful move.

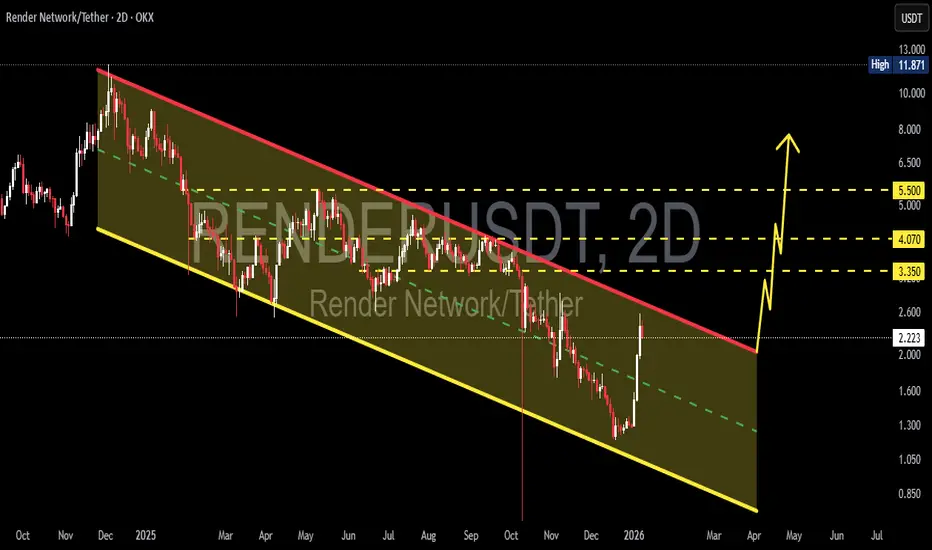
RNDR/USDT Analysis: Relief Rally or Early Breakout Signal?On the 2D timeframe, RNDR/USDT is still moving within a clear medium-term downtrend. Price action remains confined inside a Descending Channel, characterized by consistent lower highs and lower lows since the previous peak. The recent strong rebound from the lower boundary shows buying interest, but the overall market structure has not yet shifted to bullish.
---
Pattern Explanation – Descending Channel
The Descending Channel is a bearish continuation pattern, where:
The upper trendline (red) acts as dynamic resistance
The lower trendline (yellow) acts as dynamic support
Price tends to oscillate within the channel until a breakout or breakdown occurs
The current rebound originates from the lower boundary, but price is still below the channel midpoint and major resistance, meaning the downtrend structure remains intact.
---
Key Levels
Resistance Levels:
2.20 – 2.30 USDT → minor resistance / current reaction zone
3.35 USDT → key resistance inside the channel
4.07 USDT → major resistance / supply zone
5.50 USDT → upper resistance and strong distribution area
Support Levels:
1.30 – 1.20 USDT → lower channel support
0.85 – 0.90 USDT → extreme support in case of breakdown
---
Bullish Scenario
The bullish scenario becomes valid if:
Price breaks and closes strongly above the upper Descending Channel
Supported by increasing volume
Potential bullish targets:
3.35 USDT
4.07 USDT
5.50 USDT
A confirmed breakout would serve as an early trend reversal signal, indicating a potential shift from bearish to bullish market structure.
---
Bearish Scenario
The bearish scenario remains dominant if:
Price fails to break the upper channel
Rejection occurs around the 2.20 – 3.35 USDT resistance area
Downside targets:
1.30 USDT
0.90 USDT
As long as price stays inside the Descending Channel, any upward move should be considered a corrective bounce or pullback rather than a confirmed trend reversal.
---
Conclusion
RNDR/USDT is currently experiencing a technical rebound within a Descending Channel. Despite the strong bounce from the lower boundary, the primary trend remains bearish until a confirmed breakout above channel resistance occurs. Traders are advised to wait for clear breakout confirmation before shifting to a bullish bias.
---
#RNDR #RNDRUSDT #RenderNetwork #CryptoAnalysis #TechnicalAnalysis #DescendingChannel #BearishTrend #AltcoinAnalysis #CryptoTrading
RENDER / USDT – Trade ideaPrice is still trading inside a range after a strong sell-off.
Market shows indecision, but structure is holding for now.
This trade is already active, based on confluence with the Total Market Cap analysis.
Market conditions align with a potential relief move, as long as structure holds.
Technical View
* Price is reacting around a key support zone
* Multiple rejections from range lows
* Break above range highs could confirm continuation
* Loss of support would invalidate the setup
Do you expect continuation from this range or a breakdown first?
MrC

RENDER Analysis (4H)After sweeping a liquidity pool at the lows, price moved strongly to the upside and formed a bullish CH.
Now, on the pullback, we are looking for buy/long positions around the support zones.
I have two entry points, and the position should be built using DCA.
Targets are marked on the chart.
If you would like us to analyze a coin or altcoin for you, first like this post, then comment the name of your altcoin below.

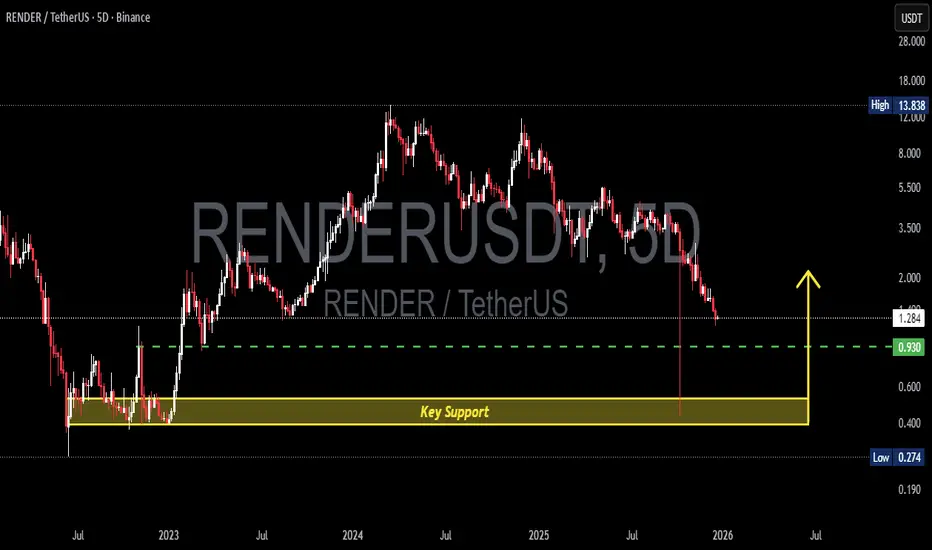
RENDER/USDT – Major Long-Term Support Test After Deep CorrectionRENDER/USDT on the 5-Day timeframe is currently in a strong bearish condition, following a prolonged distribution phase after failing to maintain a higher-high structure. Price has dropped aggressively and is now approaching a critical historical demand zone, highlighted by the yellow block at 0.52 – 0.39.
This zone previously acted as a strong accumulation area before a major bullish expansion, making it a high-confluence support area for potential price reaction.
---
Market Structure & Trend
Primary Trend: Bearish (Lower Highs & Lower Lows)
Structure Shift: Bearish structure break confirmed after price failed to reclaim previous resistance
Momentum: Strong downside momentum, driven by a breakdown from mid-range consolidation
Price is currently trading below key psychological and structural levels, indicating that sellers remain in full control.
---
Pattern Explanation
Distribution Phase: RNDR formed a broad topping structure after peaking around the 13.8 area
Structure Breakdown: Failure to hold higher lows triggered a bearish continuation
Support Retest Pattern: Current price action shows a retest of the base accumulation zone (0.52 – 0.39)
This is not a reversal pattern yet, but rather a support-testing phase, where reaction and confirmation are required.
---
Key Levels to Watch
Major Support Zone: 0.52 – 0.39 (Yellow Block / Historical Demand)
Intermediate Resistance: 0.93
Major Resistance: 1.28
Previous ATH Zone: 13.83 (Long-term reference)
---
Bullish Scenario
Price holds above the 0.52 – 0.39 zone with clear rejection signals
Formation of a base structure, such as:
Double Bottom
Rounded Bottom
Bullish Divergence (if confirmed)
A break and close above 0.93 acts as the first bullish confirmation
Continuation targets:
1.28 as the major structural resistance
Higher targets only become valid after reclaiming trend structure
This scenario represents a high-risk, high-reward accumulation area, suitable only with strong confirmation.
---
Bearish Scenario
A clean breakdown below 0.39
Strong bearish candle closes with continuation volume
Loss of historical demand confirms:
Failed accumulation
Long-term bearish continuation
Next downside targets:
New cycle lows
Downside price discovery phase
In this case, RNDR enters a structural reset phase, and long positions should be avoided.
---
Conclusion
RENDER/USDT is currently at a make-or-break level. The 0.52 – 0.39 zone is a critical long-term support where traders should focus on reaction rather than prediction. Until a valid bullish confirmation appears, the overall bias remains bearish to neutral, with market control still in sellers’ hands.
Patience and confirmation are key at this level.
---
#RNDR #RENDERUSDT #Render #RenderToken #CryptoAnalysis #AltcoinAnalysis #TechnicalAnalysis #MarketStructure #SupportAndResistance #BearishTrend #AccumulationZone #CryptoTrading
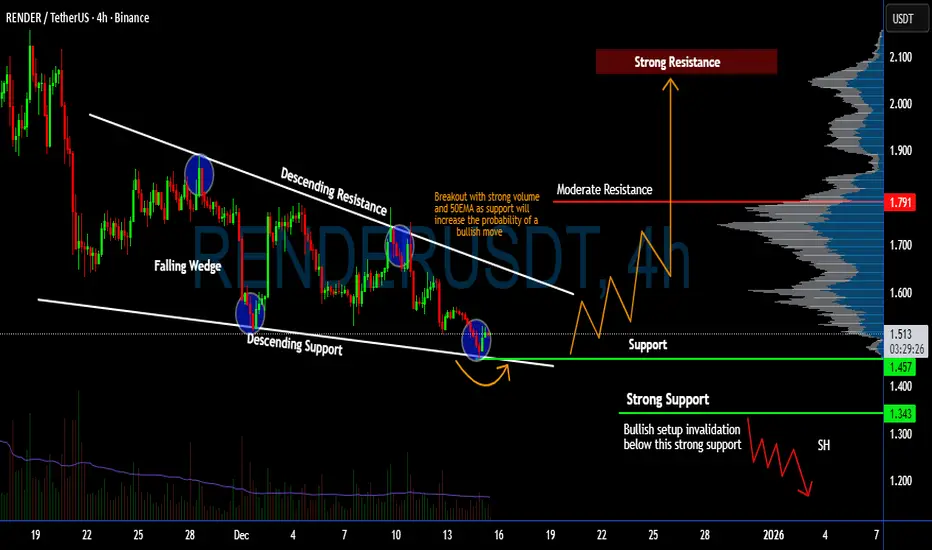
Will #RENDER Recover From Here or Not? Major Signs FlashingYello, Paradiser! Are you watching how #RENDERUSDT is respecting this falling wedge structure? Is a recovery on the horizon? Let's view the #Render setup:
💎#RENDERUSD is currently sitting right at the wedge's descending support after multiple rejections from the upper resistance trendline. Each touch of this support has triggered buyer interest, and if we see a breakout with strong volume, especially reclaiming the 50EMA, it could confirm a bullish shift.
💎This exact price action setup, a falling wedge paired with volume contraction, is a classic pre-breakout scenario. If the price pushes above the descending resistance with strength, it opens the path toward the moderate resistance around $1.79, with a potential continuation toward the strong resistance zone near $2.10.
💎On the downside, the strong support at $1.34 is critical. If we see a clean breakdown below that level with no recovery, it would invalidate this bullish setup and open the door for a deeper retracement into the low $1.20s. So far, however, buyers are stepping in aggressively whenever price dips into this support range — a sign of ongoing accumulation.
💎The next 1-2 candles will be crucial. A breakout above the wedge with volume confirmation could trigger a fast squeeze as short positions unwind and momentum buyers rush in. But patience is key, wait for the breakout and retest for the highest probability setup.
Trade smart, Paradisers. This setup will reward only the disciplined.
MyCryptoParadise
iFeel the success🌴
RENDER/USDT : SELL LIMITHello friends
Given the downward trend we are having, you can see that the power is in the hands of the sellers.
Now, if the price reaches the resistance areas, it is a good opportunity to sell. Be careful that if the structure breaks, it is no longer logical to sell.
So we should see the power of the buyers in the resistance area, but most likely we will see a price correction.
This analysis is purely technically reviewed and is not a buy or sell recommendation, so do not act emotionally and observe capital management.
*Trade safely with us*
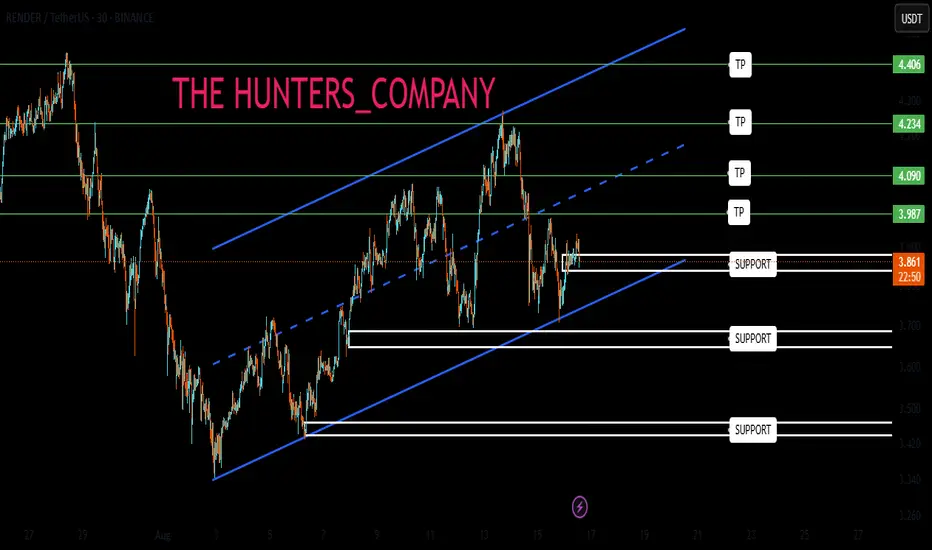
RENDER/USDT Who wouldn't love to bank in %30 growthThis one is pretty simple and self explanatory.
Buy from current price.
• TP1: $2.435
• TP1: $2.584
• TP1: $2.760
Stop Loss: Close below $1.84

RENDER: Slightly higherRENDER recently managed to push higher once again. Currently, within the larger turquoise wave Y—which is developing as a five-wave move in magenta—it is expected to continue its upward momentum in the near term. As a key initial step, price should break above resistance at $5.51.

Render , black FridayGetting a chance to buy Render in -80% is truly a gift . With all the hype around AI and all the good news coming from Render it’ll blow when time comes , right now climbing in a long term channel hitting the floor and indications of massive move ahead , I’m in and waiting.
Remember , DYOR .

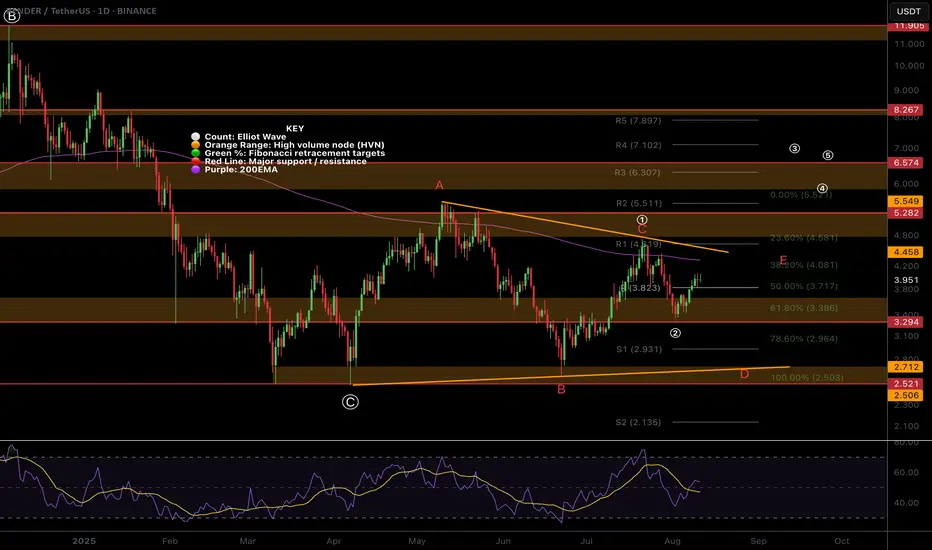
RENDER Analysis (1W)It seems that wave C of the weekly diametric pattern on RENDER has completed, and we are now entering wave D.
The price, through a time–price correction, may move toward the green zone over the coming weeks until the time and price structure of this major diametric pattern is complete.
The targets are based on the weekly timeframe, and it will take time for the price to reach them.
For risk management, please don't forget stop loss and capital management
When we reach the first target, save some profit and then change the stop to entry
Comment if you have any questions
Thank You

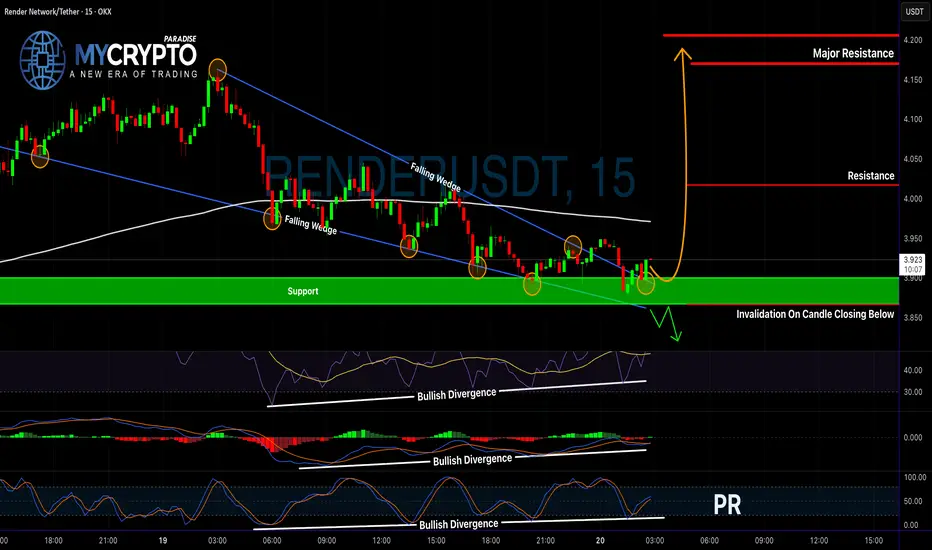
Is RENDER About to Explode?Yello Paradisers, are you watching closely? RENDERUSDT just completed a textbook breakout—and it might be your best shot at catching a high-probability move before the crowd even notices.
💎RENDERUSDT has officially broken out of a falling wedge—a powerful bullish pattern—confirmed by bullish divergence on the RSI, MACD, and Stochastic RSI. When all three indicators align like this, the probability of a strong upside move significantly increases.
💎Even better, price action has already retested the wedge breakout, and from the current levels, the market is offering a favorable risk-to-reward (RR) setup.
💎Now, if you’re looking for additional confirmation, a more cautious play would be to wait for a pullback into the nearest support zone, and then enter on a bullish candlestick formation. This approach could not only boost your confidence but also improve your overall RR.
💎However, stay sharp—if price breaks and closes below the support and our invalidation level, the entire setup gets invalidated. In that case, patience is key. Wait for stronger price action before considering re-entry.
🎖Strive for consistency, not quick profits. Treat the market as a businessman, not as a gambler. Be patient, stay focused, and let the market come to you, Paradisers. That’s how the winners play this game long-term.
MyCryptoParadise
iFeel the success🌴
RENDER Market Update📊 EURONEXT:RNDR Market Update
EURONEXT:RNDR is testing the red resistance zone 🔴
👉 If a breakout happens, the first target will be the green line level 🎯
⚡ Confirmation is key before entering.

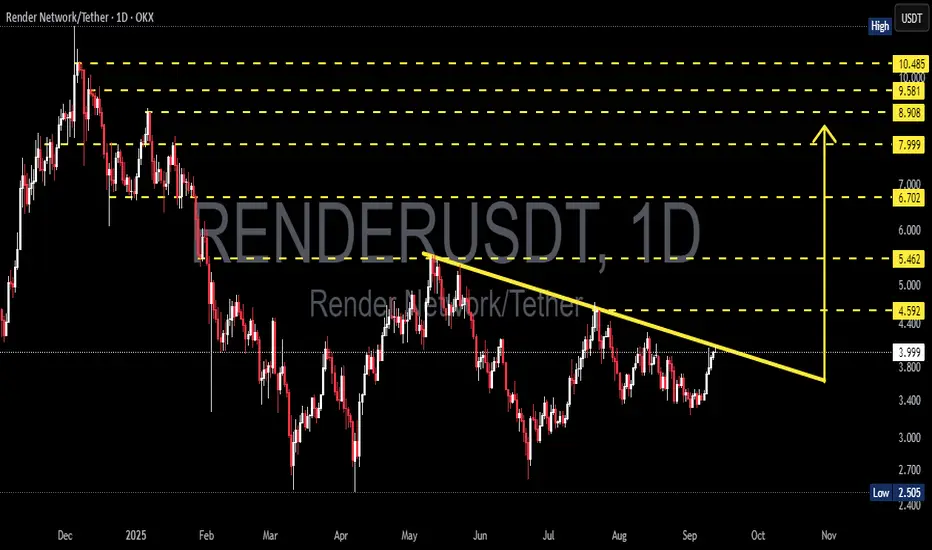
RENDER/USDT — Time Decide: Major Breakout or Another Rejection?RENDER is now at a critical point after being suppressed for months by the descending trendline (yellow). Each rally attempt has been rejected at this line — but once again, price is testing it. This zone will decide the next major move.
---
🔎 Technical Overview
Main trend: Since the peak at $10.485, RENDER has formed consistent lower-highs under the descending resistance.
Key support: $2.505 (major historical low).
Critical resistance:
$4.592 → the “gateway” to a bullish reversal.
$5.462 and $6.702 → next bullish targets if breakout is confirmed.
$7.999 – $10.485 → major supply zone from previous highs.
In short, the $4.5 – $4.6 area is the decision point: a confirmed breakout could flip the trend.
---
🐂 Bullish Scenario
If RENDER can close a daily candle above $4.592 with strong volume, we could see:
Target 1: $5.462 (+36% from current levels).
Target 2: $6.702 (+67%).
Target 3 (extension): $7.999 – $8.908 (+100% to +120%).
A breakout here may spark a short squeeze and trigger broader bullish momentum.
---
🐻 Bearish Scenario
If the trendline once again rejects price around $4.5–$4.6, the descending triangle structure remains intact:
First support: $3.40.
Major bearish target: $2.505 (–37% from current levels).
A breakdown below $2.5 would likely lead to a deeper correction and bearish continuation.
---
🔔 Pattern & Dynamics
Current structure resembles a Descending Triangle — classically bearish, but in crypto it often acts as an accumulation before a strong breakout.
Volume confirmation is key: without it, any breakout risks being a false move.
The more times a trendline is tested, the weaker it becomes — momentum is building.
---
🎯 Conclusion
Bullish case: breakout above $4.592 opens the path to $5.46 → $6.70 → $8+.
Bearish case: rejection keeps RENDER inside the triangle, aiming for $3.4 → $2.5.
RENDER is now at a decision point — the next daily close will be crucial for direction.
---
📌 Trading Notes
Aggressive traders: may enter near current levels with a stop below $3.40.
Conservative traders: should wait for a confirmed daily close above $4.592.
Risk management: always size positions wisely, use clear stop losses, and scale profits at key levels.
---
#RENDER #RENDERUSDT #RenderNetwork #CryptoBreakout #Altcoins #TechnicalAnalysis #PriceAction #CryptoCharts #MarketOutlook
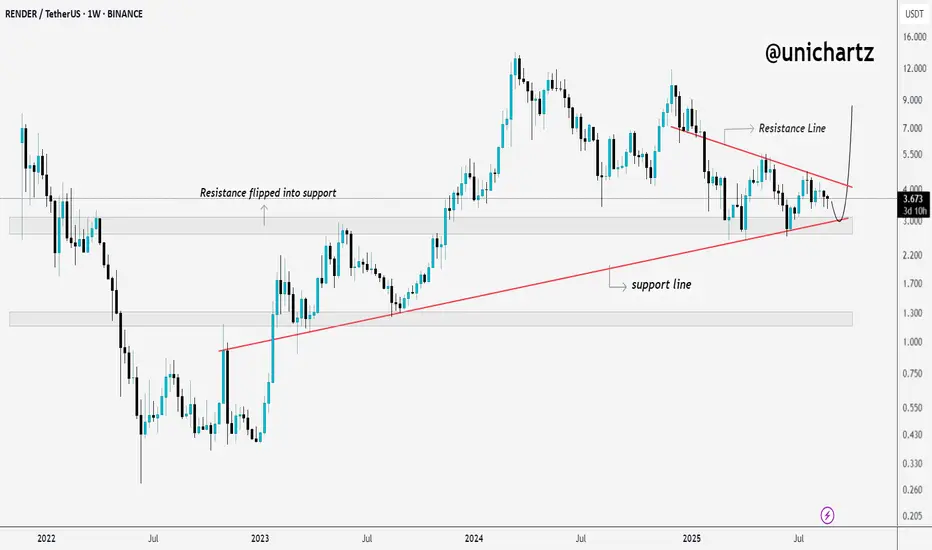
Watch This Zone – RNDR Weekly Setup Heating UpCRYPTOCAP:RENDER is trading within a tightening wedge, squeezed between a descending resistance and a rising support line, a setup hinting at a potential breakout.
The previously broken resistance has flipped into support and continues to hold. If bulls maintain this level and break above the wedge, we could see a swift move toward $5.50+.
A breakdown below support, however, may lead to further consolidation.
DYOR, NFA
RENDER: Buyers arrivedHello friends
Given the decline we had, we see that buyers entered and created an ascending channel.
Now that we are at the bottom of the channel, we are in an important support area.
Of course, two other important support areas are also located further up, which if supported by the price, can move to the specified resistances.
*Trade safely with us*
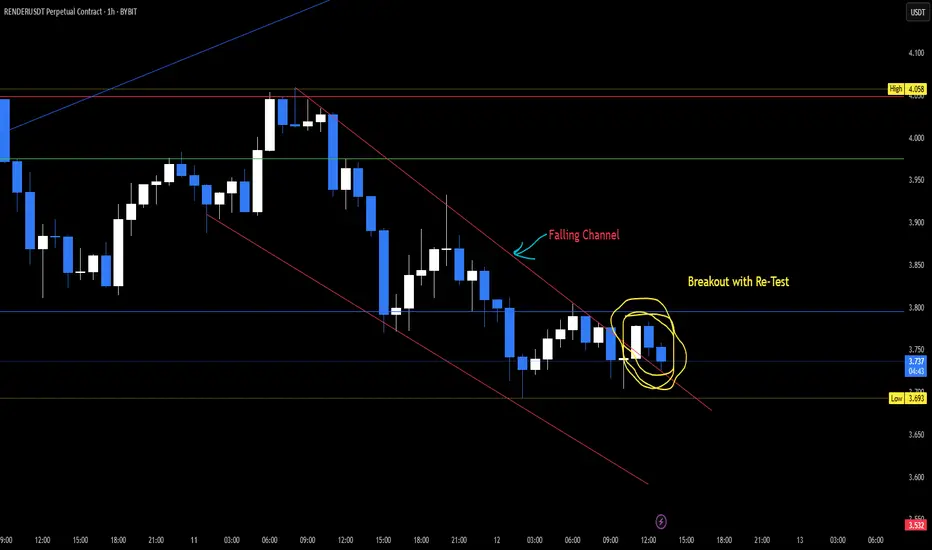
RENDER BreakoutI saw the breakout and retest of the descending channel, so the price might continue up from here at least to the previous high trying to break the resistance again.
NOT AN ADVICE. For educational and experimental purpose only.
$RENDER bearish triangle or motif wave?I have 2 local Elliot Wave counts for CRYPTOCAP:RENDER the bearish triangle yet to complete wave D which would result in a final thrust down before a new macro uptrend and a (1) (2) with wave (3) started.
The overlapping and slow price action does not suggest RENDER is in a wave as it is not moving impulsively.
Many alts have failed to move from the bottom while others have shined like ETH and XRP etc..
Either this is the new normal behaviour for 'alt season' or we are not actually in alt-season yet with a big move lower around the corner!
Safe trading
RENDER Approaching Key Support – Swing Trade OpportunityRENDER is currently retracing and approaching a significant support zone, offering a potential long swing trade setup. This level has historically acted as a demand area, and price action around it could provide a favorable risk-to-reward entry.
💰 Entry Zone: $3.280 – $3.030
🎯 Targets:
• TP1: $4.00
• TP2: $4.500
🛑 Stop Loss: $2.950
Trade management will be key – look for bullish reversal signals like strong volume, bullish engulfing patterns, or RSI confirmation before entry. Maintain disciplined risk control with your stop loss below the key zone.
#RENDER #CryptoTrading #SwingTrade #Altcoins #TechnicalAnalysis #CryptoSetup #Bullish #SupportZone #CryptoSignals #RENDERUSDT #RiskReward #CryptoMarket

RENDER gaining momentum As it reclaimed the 89 EMA and now it's acting as support, it might retest it once more before moving up to reclaim EMA 200
So I would say RENDER is gaining momentum again into the upper direction after showing a strong support on the green zone from the chart.
DYOR / NAFA

RNDR/USDT at a Critical Turning Point: Golden Pocket as the Key?✨ Overview:
Render Token (RNDR) is currently testing a crucial support zone — the Golden Pocket Fibonacci Retracement between 0.5 (3.616) and 0.618 (3.385). This zone not only represents a significant retracement level but has historically acted as a strong demand area, often serving as a springboard for major price reversals.
---
🧠 Detailed Technical Analysis:
🔸 Support Zone & Golden Pocket
Price has retraced back to the 0.5 – 0.618 Fibonacci zone, a high-probability reversal area.
This zone has acted as a demand base multiple times since February 2025.
How the price reacts here will likely define the next major trend direction.
🔸 Market Structure
The overall structure shows a mid-term downtrend, marked by lower highs and lower lows.
However, the current price action shows slowing bearish momentum, indicating potential hidden accumulation.
A potential double bottom pattern could be forming, hinting at a bullish reversal if confirmed.
---
📈 Bullish Scenario:
1. Strong Rebound from the Golden Pocket
Watch for bullish candlestick patterns (e.g., pin bar, bullish engulfing) near $3.38–$3.61.
Initial resistance levels: $4.16 – $4.72
If broken, mid-term targets could extend to $5.47 – $6.68
2. Double Bottom Confirmation
A confirmed double bottom with a neckline breakout around $4.16 would greatly strengthen bullish momentum.
3. Increased Buying Volume
A spike in volume during the rebound would validate bullish sentiment and potential trend reversal.
---
📉 Bearish Scenario:
1. Breakdown Below the Golden Pocket
If the price breaks below $3.385 with strong volume, we could see a move down toward $2.77, the next significant support.
2. Weak Bounce / Lower High
A failed breakout above $4.16 may indicate a bearish continuation after a temporary relief rally.
---
📌 Summary:
RNDR is currently at a technically sensitive zone. The Golden Pocket between $3.38 and $3.61 is the key area to watch. A strong bullish reaction could signal the start of a trend reversal, while a breakdown could trigger further downside continuation. Traders are advised to wait for clear confirmation via price action before committing to any strong positions.
---
🔖 Key Levels to Watch:
Level Description
3.38 – 3.61 Golden Pocket (Potential Buy Zone)
4.16 Minor Resistance
4.72 Bullish Breakout Trigger
5.47 – 6.68 Mid-Term Reversal Targets
2.77 Strong Support if Breakdown Occurs
---
🧩 Chart Patterns Observed:
Potential Double Bottom – early bullish reversal signal.
Golden Pocket Reaction Setup
Descending Structure – still intact but weakening.
---
🔍 Trade Ideas:
🔄 Wait-and-see approach: Wait for clear bullish confirmation on daily candles.
🎯 Aggressive Long Entry: Around 3.40–3.60 with a tight stop-loss.
⚠️ Short Opportunity: If a strong breakdown below 3.38 occurs with volume confirmation.
#RNDR #RenderToken #RNDRUSDT #CryptoAnalysis #GoldenPocket #FibonacciRetracement #DoubleBottom #PriceAction #SupportResistance #AltcoinSetup #CryptoSignals #TechnicalAnalysis

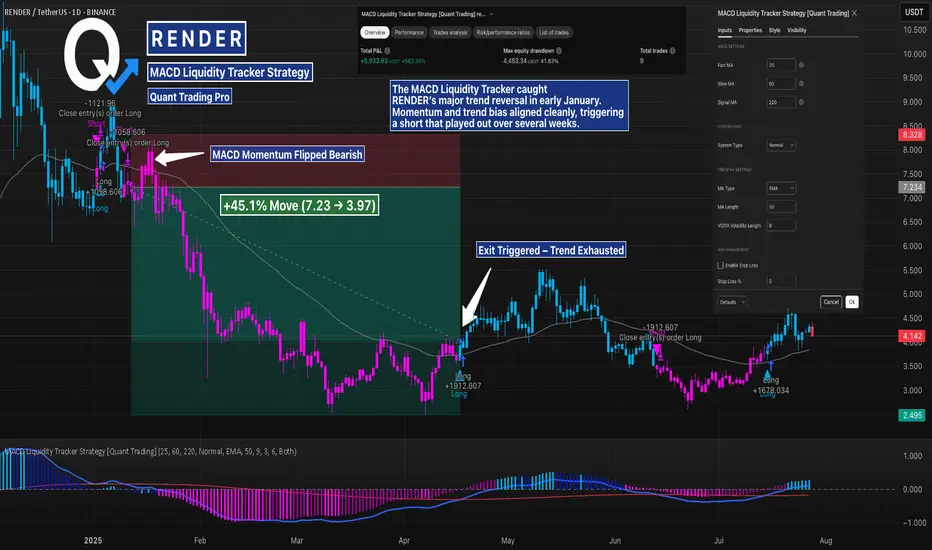
RENDER MACD Liquidity Tracker Strategy – Trend Reversal Catch 1DThis RENDER 1D chart highlights how the MACD Liquidity Tracker Strategy detected a major trend reversal in early 2025. A short was triggered around $7.23, right as MACD momentum flipped bearish and the 60/220 EMAs confirmed downside bias. The position was held until structure and momentum flattened near $3.97, closing out the trade as the downtrend began to exhaust.
What made this setup work:
Bearish MACD confirmation before the breakdown
EMA alignment to confirm trend direction
Strategy stayed with the move through an extended decline
Visual clarity from the pink/blue trend bias kept decision-making simple
This chart is part of our ongoing visual series exploring how momentum + trend filters work across different market conditions. Whether it’s continuation or reversal, structure and signal timing matter.