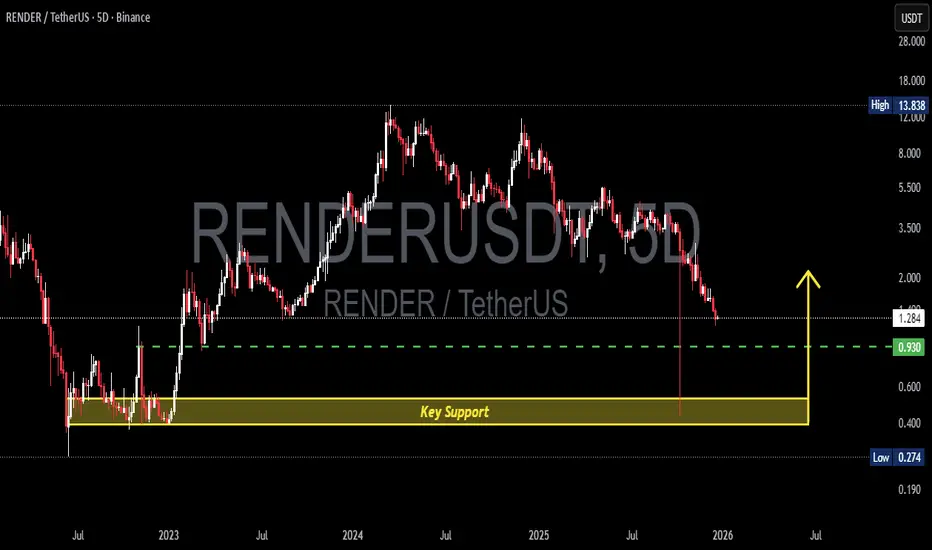
RENDER/USDT – Major Long-Term Support Test After Deep CorrectionRENDER/USDT on the 5-Day timeframe is currently in a strong bearish condition, following a prolonged distribution phase after failing to maintain a higher-high structure. Price has dropped aggressively and is now approaching a critical historical demand zone, highlighted by the yellow block at 0.52 – 0.39.
This zone previously acted as a strong accumulation area before a major bullish expansion, making it a high-confluence support area for potential price reaction.
---
Market Structure & Trend
Primary Trend: Bearish (Lower Highs & Lower Lows)
Structure Shift: Bearish structure break confirmed after price failed to reclaim previous resistance
Momentum: Strong downside momentum, driven by a breakdown from mid-range consolidation
Price is currently trading below key psychological and structural levels, indicating that sellers remain in full control.
---
Pattern Explanation
Distribution Phase: RNDR formed a broad topping structure after peaking around the 13.8 area
Structure Breakdown: Failure to hold higher lows triggered a bearish continuation
Support Retest Pattern: Current price action shows a retest of the base accumulation zone (0.52 – 0.39)
This is not a reversal pattern yet, but rather a support-testing phase, where reaction and confirmation are required.
---
Key Levels to Watch
Major Support Zone: 0.52 – 0.39 (Yellow Block / Historical Demand)
Intermediate Resistance: 0.93
Major Resistance: 1.28
Previous ATH Zone: 13.83 (Long-term reference)
---
Bullish Scenario
Price holds above the 0.52 – 0.39 zone with clear rejection signals
Formation of a base structure, such as:
Double Bottom
Rounded Bottom
Bullish Divergence (if confirmed)
A break and close above 0.93 acts as the first bullish confirmation
Continuation targets:
1.28 as the major structural resistance
Higher targets only become valid after reclaiming trend structure
This scenario represents a high-risk, high-reward accumulation area, suitable only with strong confirmation.
---
Bearish Scenario
A clean breakdown below 0.39
Strong bearish candle closes with continuation volume
Loss of historical demand confirms:
Failed accumulation
Long-term bearish continuation
Next downside targets:
New cycle lows
Downside price discovery phase
In this case, RNDR enters a structural reset phase, and long positions should be avoided.
---
Conclusion
RENDER/USDT is currently at a make-or-break level. The 0.52 – 0.39 zone is a critical long-term support where traders should focus on reaction rather than prediction. Until a valid bullish confirmation appears, the overall bias remains bearish to neutral, with market control still in sellers’ hands.
Patience and confirmation are key at this level.
---
#RNDR #RENDERUSDT #Render #RenderToken #CryptoAnalysis #AltcoinAnalysis #TechnicalAnalysis #MarketStructure #SupportAndResistance #BearishTrend #AccumulationZone #CryptoTrading
RENDERUSDC
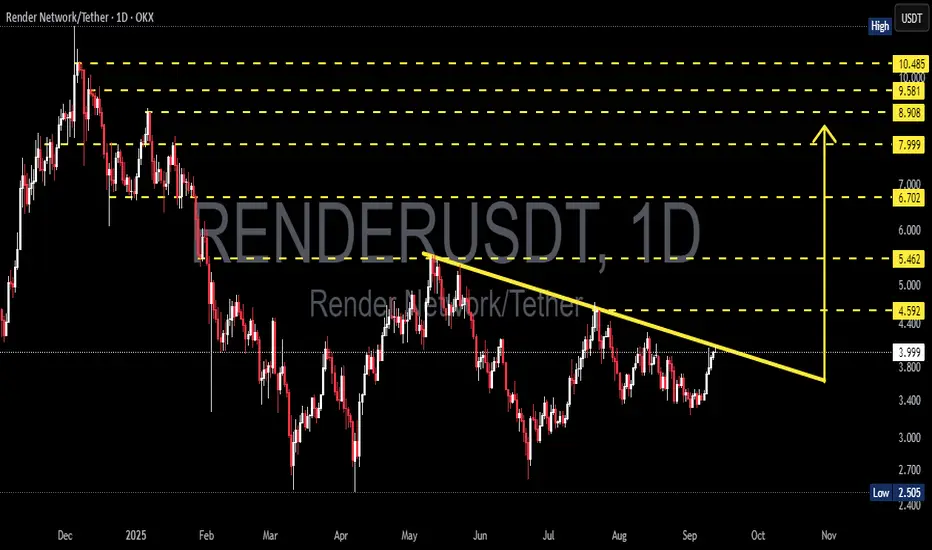
RENDER/USDT — Time Decide: Major Breakout or Another Rejection?RENDER is now at a critical point after being suppressed for months by the descending trendline (yellow). Each rally attempt has been rejected at this line — but once again, price is testing it. This zone will decide the next major move.
---
🔎 Technical Overview
Main trend: Since the peak at $10.485, RENDER has formed consistent lower-highs under the descending resistance.
Key support: $2.505 (major historical low).
Critical resistance:
$4.592 → the “gateway” to a bullish reversal.
$5.462 and $6.702 → next bullish targets if breakout is confirmed.
$7.999 – $10.485 → major supply zone from previous highs.
In short, the $4.5 – $4.6 area is the decision point: a confirmed breakout could flip the trend.
---
🐂 Bullish Scenario
If RENDER can close a daily candle above $4.592 with strong volume, we could see:
Target 1: $5.462 (+36% from current levels).
Target 2: $6.702 (+67%).
Target 3 (extension): $7.999 – $8.908 (+100% to +120%).
A breakout here may spark a short squeeze and trigger broader bullish momentum.
---
🐻 Bearish Scenario
If the trendline once again rejects price around $4.5–$4.6, the descending triangle structure remains intact:
First support: $3.40.
Major bearish target: $2.505 (–37% from current levels).
A breakdown below $2.5 would likely lead to a deeper correction and bearish continuation.
---
🔔 Pattern & Dynamics
Current structure resembles a Descending Triangle — classically bearish, but in crypto it often acts as an accumulation before a strong breakout.
Volume confirmation is key: without it, any breakout risks being a false move.
The more times a trendline is tested, the weaker it becomes — momentum is building.
---
🎯 Conclusion
Bullish case: breakout above $4.592 opens the path to $5.46 → $6.70 → $8+.
Bearish case: rejection keeps RENDER inside the triangle, aiming for $3.4 → $2.5.
RENDER is now at a decision point — the next daily close will be crucial for direction.
---
📌 Trading Notes
Aggressive traders: may enter near current levels with a stop below $3.40.
Conservative traders: should wait for a confirmed daily close above $4.592.
Risk management: always size positions wisely, use clear stop losses, and scale profits at key levels.
---
#RENDER #RENDERUSDT #RenderNetwork #CryptoBreakout #Altcoins #TechnicalAnalysis #PriceAction #CryptoCharts #MarketOutlook
RNDR/USDT at a Critical Turning Point: Golden Pocket as the Key?✨ Overview:
Render Token (RNDR) is currently testing a crucial support zone — the Golden Pocket Fibonacci Retracement between 0.5 (3.616) and 0.618 (3.385). This zone not only represents a significant retracement level but has historically acted as a strong demand area, often serving as a springboard for major price reversals.
---
🧠 Detailed Technical Analysis:
🔸 Support Zone & Golden Pocket
Price has retraced back to the 0.5 – 0.618 Fibonacci zone, a high-probability reversal area.
This zone has acted as a demand base multiple times since February 2025.
How the price reacts here will likely define the next major trend direction.
🔸 Market Structure
The overall structure shows a mid-term downtrend, marked by lower highs and lower lows.
However, the current price action shows slowing bearish momentum, indicating potential hidden accumulation.
A potential double bottom pattern could be forming, hinting at a bullish reversal if confirmed.
---
📈 Bullish Scenario:
1. Strong Rebound from the Golden Pocket
Watch for bullish candlestick patterns (e.g., pin bar, bullish engulfing) near $3.38–$3.61.
Initial resistance levels: $4.16 – $4.72
If broken, mid-term targets could extend to $5.47 – $6.68
2. Double Bottom Confirmation
A confirmed double bottom with a neckline breakout around $4.16 would greatly strengthen bullish momentum.
3. Increased Buying Volume
A spike in volume during the rebound would validate bullish sentiment and potential trend reversal.
---
📉 Bearish Scenario:
1. Breakdown Below the Golden Pocket
If the price breaks below $3.385 with strong volume, we could see a move down toward $2.77, the next significant support.
2. Weak Bounce / Lower High
A failed breakout above $4.16 may indicate a bearish continuation after a temporary relief rally.
---
📌 Summary:
RNDR is currently at a technically sensitive zone. The Golden Pocket between $3.38 and $3.61 is the key area to watch. A strong bullish reaction could signal the start of a trend reversal, while a breakdown could trigger further downside continuation. Traders are advised to wait for clear confirmation via price action before committing to any strong positions.
---
🔖 Key Levels to Watch:
Level Description
3.38 – 3.61 Golden Pocket (Potential Buy Zone)
4.16 Minor Resistance
4.72 Bullish Breakout Trigger
5.47 – 6.68 Mid-Term Reversal Targets
2.77 Strong Support if Breakdown Occurs
---
🧩 Chart Patterns Observed:
Potential Double Bottom – early bullish reversal signal.
Golden Pocket Reaction Setup
Descending Structure – still intact but weakening.
---
🔍 Trade Ideas:
🔄 Wait-and-see approach: Wait for clear bullish confirmation on daily candles.
🎯 Aggressive Long Entry: Around 3.40–3.60 with a tight stop-loss.
⚠️ Short Opportunity: If a strong breakdown below 3.38 occurs with volume confirmation.
#RNDR #RenderToken #RNDRUSDT #CryptoAnalysis #GoldenPocket #FibonacciRetracement #DoubleBottom #PriceAction #SupportResistance #AltcoinSetup #CryptoSignals #TechnicalAnalysis

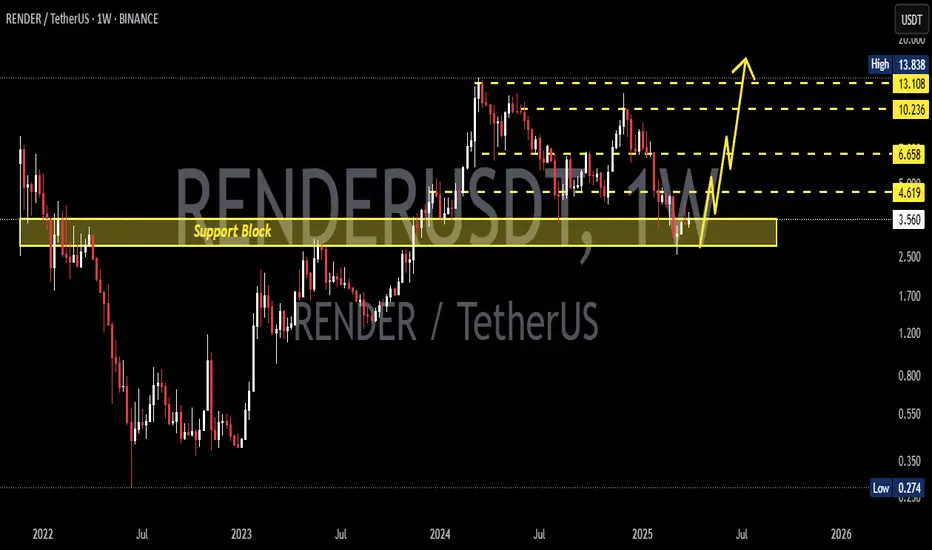
RENDERUSDT 1W AnalysisRENDER ~ 1W Analysis
#RENDER Buy gradually from here with a short term target of at least 20%++ from this support block.

RENDERUSDT 1D AnalysisRENDER ~ 1D Analysis
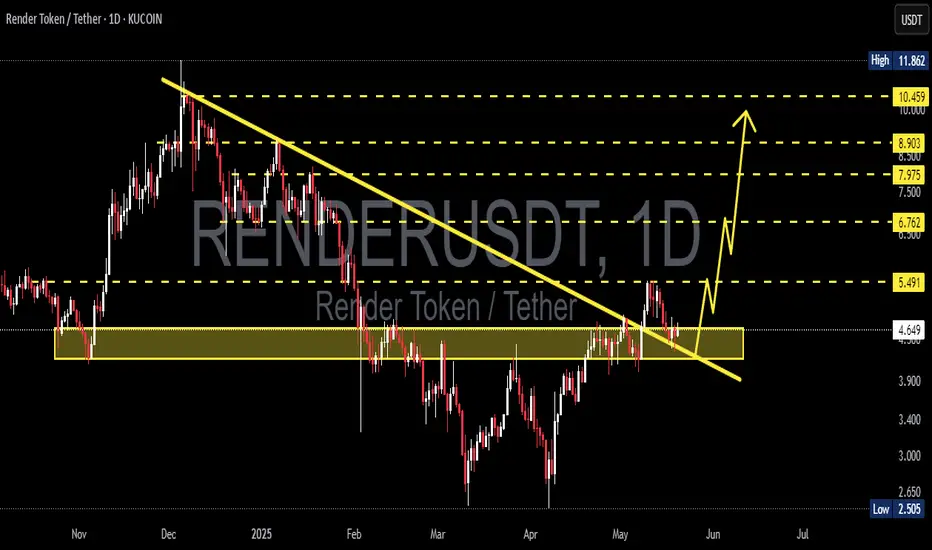
#RENDER Buy back gradually from this support block with short term target of at least 15%+ , Long term target $11

RENDERUSDT 1D Analysis RENDER ~ 1D Analysis
#RENDER Buy gradually from here if you still have confidence in this coin with a short term target of at least 10%++ from here.
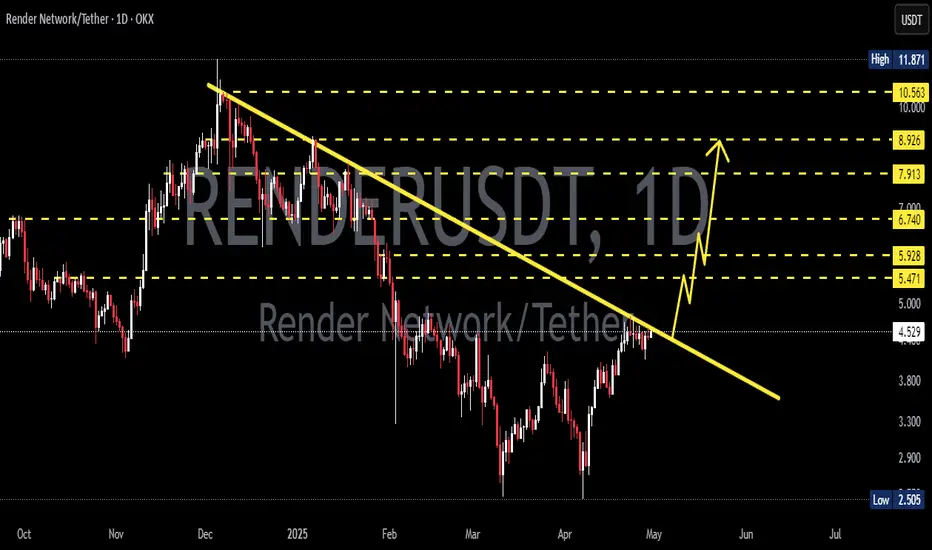
RENDERUSDT 1D AnalysisRENDER ~ 1D Analysis
#RENDER Buy after successfully penetrating this resistant line with a short -term target of at least 10%+ from here.
RENDERUSDT 1WRENDER ~ 1W Analysis
#RENDER Buy gradually from here with a short -term target of at least 20%++.
RENDERUSDT 1WRENDER ~ 1W Analysis
#RENDER If you still have a Conviction on this coin. Maybe this support block you can consider to start buying back with a short -term target 20%+.

RENDERUSDT 1WRENDER Update ~ 1W
#RENDER As long as still maintain this support block,. Bullish still maintains its structure. If using the Elliott Wave pattern,. this is the 2nd wavy. Buy in stages with a minimum target of 20%+
