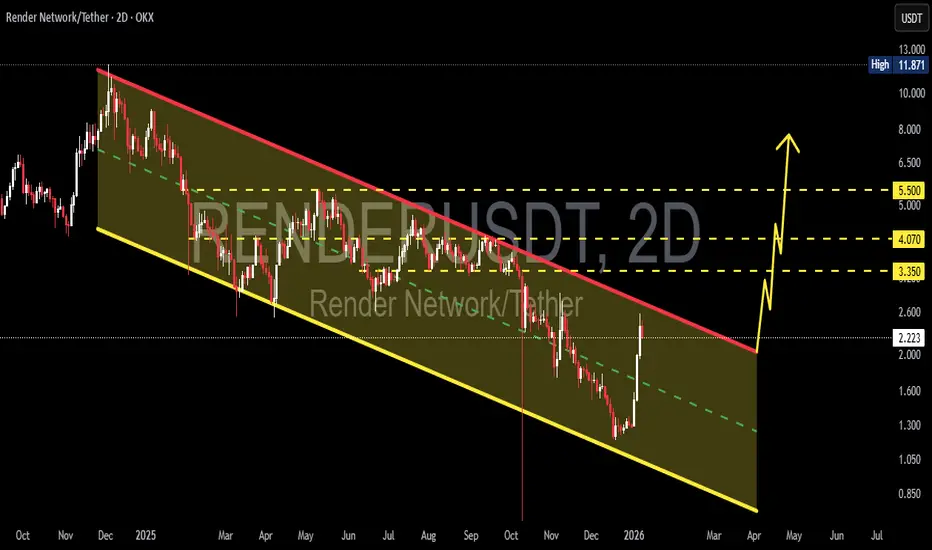
RNDR/USDT Analysis: Relief Rally or Early Breakout Signal?On the 2D timeframe, RNDR/USDT is still moving within a clear medium-term downtrend. Price action remains confined inside a Descending Channel, characterized by consistent lower highs and lower lows since the previous peak. The recent strong rebound from the lower boundary shows buying interest, but the overall market structure has not yet shifted to bullish.
---
Pattern Explanation – Descending Channel
The Descending Channel is a bearish continuation pattern, where:
The upper trendline (red) acts as dynamic resistance
The lower trendline (yellow) acts as dynamic support
Price tends to oscillate within the channel until a breakout or breakdown occurs
The current rebound originates from the lower boundary, but price is still below the channel midpoint and major resistance, meaning the downtrend structure remains intact.
---
Key Levels
Resistance Levels:
2.20 – 2.30 USDT → minor resistance / current reaction zone
3.35 USDT → key resistance inside the channel
4.07 USDT → major resistance / supply zone
5.50 USDT → upper resistance and strong distribution area
Support Levels:
1.30 – 1.20 USDT → lower channel support
0.85 – 0.90 USDT → extreme support in case of breakdown
---
Bullish Scenario
The bullish scenario becomes valid if:
Price breaks and closes strongly above the upper Descending Channel
Supported by increasing volume
Potential bullish targets:
3.35 USDT
4.07 USDT
5.50 USDT
A confirmed breakout would serve as an early trend reversal signal, indicating a potential shift from bearish to bullish market structure.
---
Bearish Scenario
The bearish scenario remains dominant if:
Price fails to break the upper channel
Rejection occurs around the 2.20 – 3.35 USDT resistance area
Downside targets:
1.30 USDT
0.90 USDT
As long as price stays inside the Descending Channel, any upward move should be considered a corrective bounce or pullback rather than a confirmed trend reversal.
---
Conclusion
RNDR/USDT is currently experiencing a technical rebound within a Descending Channel. Despite the strong bounce from the lower boundary, the primary trend remains bearish until a confirmed breakout above channel resistance occurs. Traders are advised to wait for clear breakout confirmation before shifting to a bullish bias.
---
#RNDR #RNDRUSDT #RenderNetwork #CryptoAnalysis #TechnicalAnalysis #DescendingChannel #BearishTrend #AltcoinAnalysis #CryptoTrading
Renderusdtanalysis
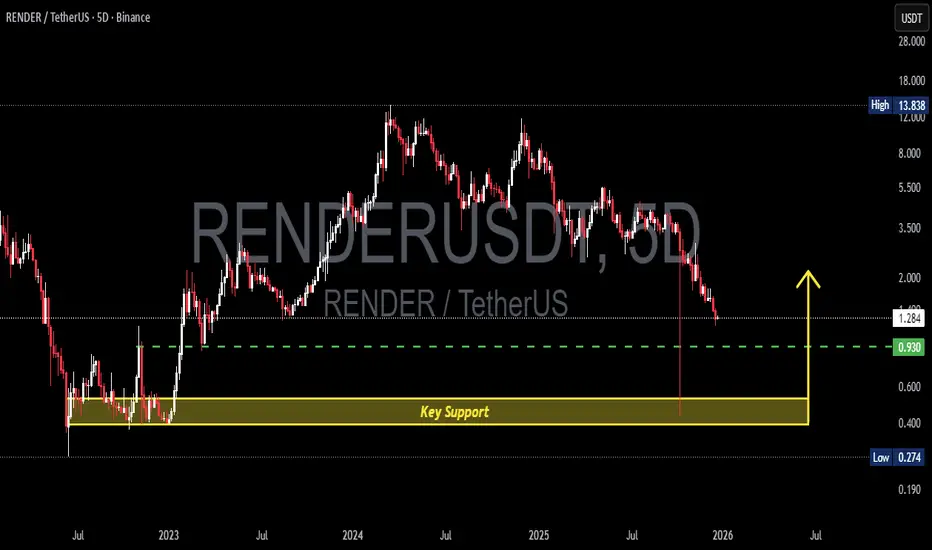
RENDER/USDT – Major Long-Term Support Test After Deep CorrectionRENDER/USDT on the 5-Day timeframe is currently in a strong bearish condition, following a prolonged distribution phase after failing to maintain a higher-high structure. Price has dropped aggressively and is now approaching a critical historical demand zone, highlighted by the yellow block at 0.52 – 0.39.
This zone previously acted as a strong accumulation area before a major bullish expansion, making it a high-confluence support area for potential price reaction.
---
Market Structure & Trend
Primary Trend: Bearish (Lower Highs & Lower Lows)
Structure Shift: Bearish structure break confirmed after price failed to reclaim previous resistance
Momentum: Strong downside momentum, driven by a breakdown from mid-range consolidation
Price is currently trading below key psychological and structural levels, indicating that sellers remain in full control.
---
Pattern Explanation
Distribution Phase: RNDR formed a broad topping structure after peaking around the 13.8 area
Structure Breakdown: Failure to hold higher lows triggered a bearish continuation
Support Retest Pattern: Current price action shows a retest of the base accumulation zone (0.52 – 0.39)
This is not a reversal pattern yet, but rather a support-testing phase, where reaction and confirmation are required.
---
Key Levels to Watch
Major Support Zone: 0.52 – 0.39 (Yellow Block / Historical Demand)
Intermediate Resistance: 0.93
Major Resistance: 1.28
Previous ATH Zone: 13.83 (Long-term reference)
---
Bullish Scenario
Price holds above the 0.52 – 0.39 zone with clear rejection signals
Formation of a base structure, such as:
Double Bottom
Rounded Bottom
Bullish Divergence (if confirmed)
A break and close above 0.93 acts as the first bullish confirmation
Continuation targets:
1.28 as the major structural resistance
Higher targets only become valid after reclaiming trend structure
This scenario represents a high-risk, high-reward accumulation area, suitable only with strong confirmation.
---
Bearish Scenario
A clean breakdown below 0.39
Strong bearish candle closes with continuation volume
Loss of historical demand confirms:
Failed accumulation
Long-term bearish continuation
Next downside targets:
New cycle lows
Downside price discovery phase
In this case, RNDR enters a structural reset phase, and long positions should be avoided.
---
Conclusion
RENDER/USDT is currently at a make-or-break level. The 0.52 – 0.39 zone is a critical long-term support where traders should focus on reaction rather than prediction. Until a valid bullish confirmation appears, the overall bias remains bearish to neutral, with market control still in sellers’ hands.
Patience and confirmation are key at this level.
---
#RNDR #RENDERUSDT #Render #RenderToken #CryptoAnalysis #AltcoinAnalysis #TechnicalAnalysis #MarketStructure #SupportAndResistance #BearishTrend #AccumulationZone #CryptoTrading
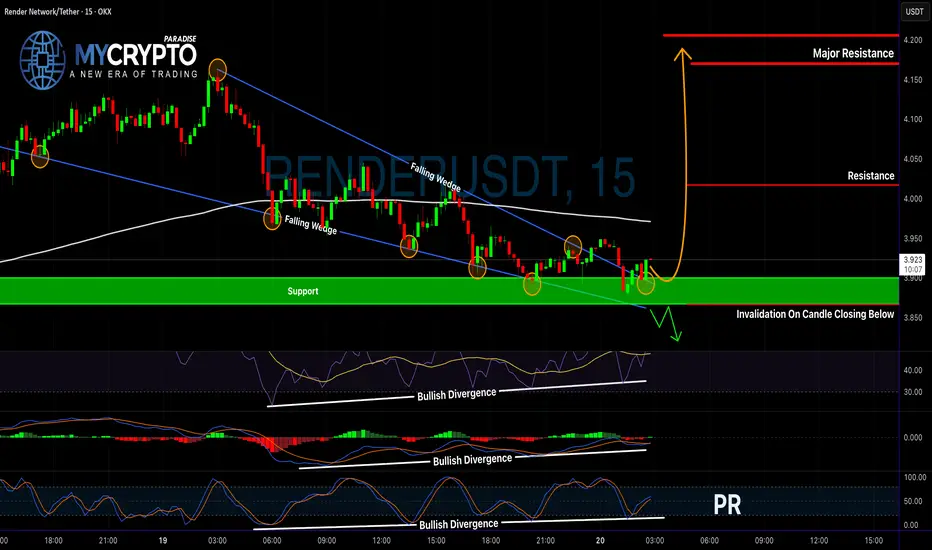
Is RENDER About to Explode?Yello Paradisers, are you watching closely? RENDERUSDT just completed a textbook breakout—and it might be your best shot at catching a high-probability move before the crowd even notices.
💎RENDERUSDT has officially broken out of a falling wedge—a powerful bullish pattern—confirmed by bullish divergence on the RSI, MACD, and Stochastic RSI. When all three indicators align like this, the probability of a strong upside move significantly increases.
💎Even better, price action has already retested the wedge breakout, and from the current levels, the market is offering a favorable risk-to-reward (RR) setup.
💎Now, if you’re looking for additional confirmation, a more cautious play would be to wait for a pullback into the nearest support zone, and then enter on a bullish candlestick formation. This approach could not only boost your confidence but also improve your overall RR.
💎However, stay sharp—if price breaks and closes below the support and our invalidation level, the entire setup gets invalidated. In that case, patience is key. Wait for stronger price action before considering re-entry.
🎖Strive for consistency, not quick profits. Treat the market as a businessman, not as a gambler. Be patient, stay focused, and let the market come to you, Paradisers. That’s how the winners play this game long-term.
MyCryptoParadise
iFeel the success🌴
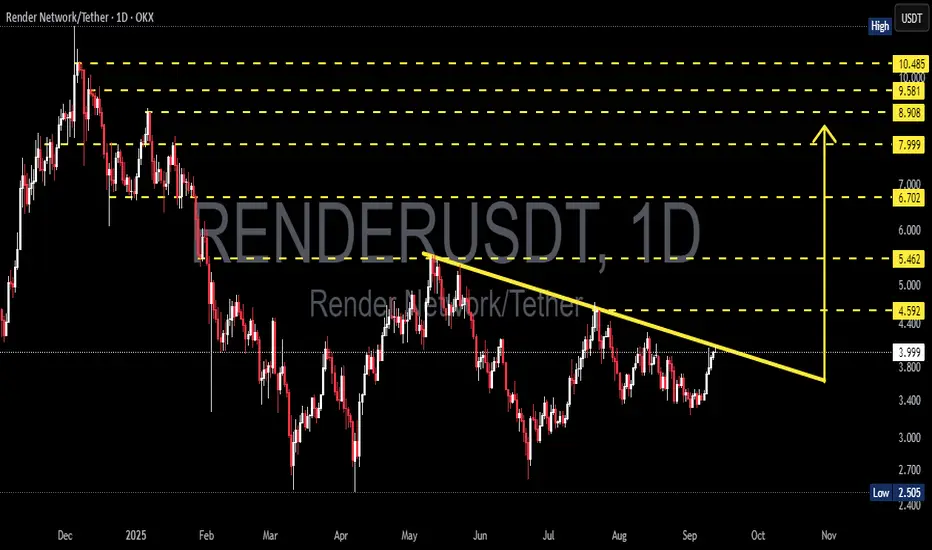
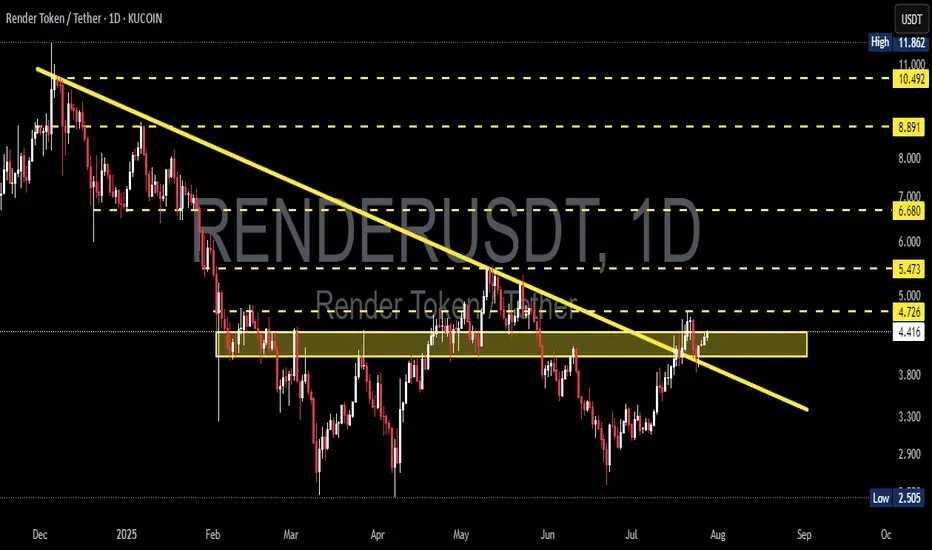
RENDER/USDT — Time Decide: Major Breakout or Another Rejection?RENDER is now at a critical point after being suppressed for months by the descending trendline (yellow). Each rally attempt has been rejected at this line — but once again, price is testing it. This zone will decide the next major move.
---
🔎 Technical Overview
Main trend: Since the peak at $10.485, RENDER has formed consistent lower-highs under the descending resistance.
Key support: $2.505 (major historical low).
Critical resistance:
$4.592 → the “gateway” to a bullish reversal.
$5.462 and $6.702 → next bullish targets if breakout is confirmed.
$7.999 – $10.485 → major supply zone from previous highs.
In short, the $4.5 – $4.6 area is the decision point: a confirmed breakout could flip the trend.
---
🐂 Bullish Scenario
If RENDER can close a daily candle above $4.592 with strong volume, we could see:
Target 1: $5.462 (+36% from current levels).
Target 2: $6.702 (+67%).
Target 3 (extension): $7.999 – $8.908 (+100% to +120%).
A breakout here may spark a short squeeze and trigger broader bullish momentum.
---
🐻 Bearish Scenario
If the trendline once again rejects price around $4.5–$4.6, the descending triangle structure remains intact:
First support: $3.40.
Major bearish target: $2.505 (–37% from current levels).
A breakdown below $2.5 would likely lead to a deeper correction and bearish continuation.
---
🔔 Pattern & Dynamics
Current structure resembles a Descending Triangle — classically bearish, but in crypto it often acts as an accumulation before a strong breakout.
Volume confirmation is key: without it, any breakout risks being a false move.
The more times a trendline is tested, the weaker it becomes — momentum is building.
---
🎯 Conclusion
Bullish case: breakout above $4.592 opens the path to $5.46 → $6.70 → $8+.
Bearish case: rejection keeps RENDER inside the triangle, aiming for $3.4 → $2.5.
RENDER is now at a decision point — the next daily close will be crucial for direction.
---
📌 Trading Notes
Aggressive traders: may enter near current levels with a stop below $3.40.
Conservative traders: should wait for a confirmed daily close above $4.592.
Risk management: always size positions wisely, use clear stop losses, and scale profits at key levels.
---
#RENDER #RENDERUSDT #RenderNetwork #CryptoBreakout #Altcoins #TechnicalAnalysis #PriceAction #CryptoCharts #MarketOutlook
RNDR/USDT at a Critical Turning Point: Golden Pocket as the Key?✨ Overview:
Render Token (RNDR) is currently testing a crucial support zone — the Golden Pocket Fibonacci Retracement between 0.5 (3.616) and 0.618 (3.385). This zone not only represents a significant retracement level but has historically acted as a strong demand area, often serving as a springboard for major price reversals.
---
🧠 Detailed Technical Analysis:
🔸 Support Zone & Golden Pocket
Price has retraced back to the 0.5 – 0.618 Fibonacci zone, a high-probability reversal area.
This zone has acted as a demand base multiple times since February 2025.
How the price reacts here will likely define the next major trend direction.
🔸 Market Structure
The overall structure shows a mid-term downtrend, marked by lower highs and lower lows.
However, the current price action shows slowing bearish momentum, indicating potential hidden accumulation.
A potential double bottom pattern could be forming, hinting at a bullish reversal if confirmed.
---
📈 Bullish Scenario:
1. Strong Rebound from the Golden Pocket
Watch for bullish candlestick patterns (e.g., pin bar, bullish engulfing) near $3.38–$3.61.
Initial resistance levels: $4.16 – $4.72
If broken, mid-term targets could extend to $5.47 – $6.68
2. Double Bottom Confirmation
A confirmed double bottom with a neckline breakout around $4.16 would greatly strengthen bullish momentum.
3. Increased Buying Volume
A spike in volume during the rebound would validate bullish sentiment and potential trend reversal.
---
📉 Bearish Scenario:
1. Breakdown Below the Golden Pocket
If the price breaks below $3.385 with strong volume, we could see a move down toward $2.77, the next significant support.
2. Weak Bounce / Lower High
A failed breakout above $4.16 may indicate a bearish continuation after a temporary relief rally.
---
📌 Summary:
RNDR is currently at a technically sensitive zone. The Golden Pocket between $3.38 and $3.61 is the key area to watch. A strong bullish reaction could signal the start of a trend reversal, while a breakdown could trigger further downside continuation. Traders are advised to wait for clear confirmation via price action before committing to any strong positions.
---
🔖 Key Levels to Watch:
Level Description
3.38 – 3.61 Golden Pocket (Potential Buy Zone)
4.16 Minor Resistance
4.72 Bullish Breakout Trigger
5.47 – 6.68 Mid-Term Reversal Targets
2.77 Strong Support if Breakdown Occurs
---
🧩 Chart Patterns Observed:
Potential Double Bottom – early bullish reversal signal.
Golden Pocket Reaction Setup
Descending Structure – still intact but weakening.
---
🔍 Trade Ideas:
🔄 Wait-and-see approach: Wait for clear bullish confirmation on daily candles.
🎯 Aggressive Long Entry: Around 3.40–3.60 with a tight stop-loss.
⚠️ Short Opportunity: If a strong breakdown below 3.38 occurs with volume confirmation.
#RNDR #RenderToken #RNDRUSDT #CryptoAnalysis #GoldenPocket #FibonacciRetracement #DoubleBottom #PriceAction #SupportResistance #AltcoinSetup #CryptoSignals #TechnicalAnalysis

RENDERUSDT Breaks Major Downtrend – Will Bulls Sustain!🧠 Market Context & Structure:
RENDERUSDT is currently presenting one of the most technically compelling setups in recent months. After enduring a prolonged downtrend since late 2024, price action has finally broken above the major descending trendline that has acted as dynamic resistance for over 7 months.
This breakout signals a potential shift in market control from sellers to buyers, marking a critical phase transition from bearish pressure to a possible bullish reversal.
---
📊 Key Technical Levels:
Descending Trendline (Breakout Confirmed): Clean breakout with bullish momentum—first signal of a structural shift.
Major Consolidation Zone (Supply Zone): $4.41 – $4.72
↪ Previously acted as strong resistance; now being tested as potential support reclaim.
Critical Support (Retest Area): $3.80 – $4.00
↪ If the breakout fails, this zone will be the next major defense for the bulls.
Upside Resistance Targets:
⚡ $5.47 – Minor horizontal resistance
🚀 $6.68 – Key resistance from prior swing highs
🧨 $8.89 and $10.49 – Mid-term bullish targets if trend continuation holds
---
🔍 Pattern Analysis:
Descending Trendline Breakout
A textbook reversal pattern, where a successful breakout above the long-term trendline signals a shift in momentum.
Supply Zone Reclaim
Price is now attempting to reclaim a previously rejected supply zone. If successful, it may indicate the beginning of a Wyckoff-style markup phase.
---
🟢 Bullish Scenario (Optimistic Outlook):
Price holds above $4.72, validating the breakout with strength and possibly retesting the area as new support.
A clear continuation may drive the price toward $5.47 and $6.68 in the short to medium term.
Rising volume and strong bullish candlesticks (e.g., marubozu or bullish engulfing) will further confirm momentum.
---
🔴 Bearish Scenario (Caution Required):
If price fails to hold above $4.41 – $4.72 and closes back below the breakout zone:
This would suggest a false breakout (bull trap).
Potential downside toward $4.00 or even $3.50.
Selling pressure could re-emerge, especially if broader market sentiment turns negative.
---
🧠 Market Psychology:
Traders are watching closely to see if this breakout is real or a trap.
This is a decision zone, where early profit-taking clashes with new momentum entries.
A strong close above $4.72 with increasing volume may invite more participation and confirmation of a trend reversal.
---
🧭 Conclusion:
RENDERUSDT is at a critical technical crossroads. The breakout from the long-standing descending trendline is a major bullish signal—but the real test lies in whether bulls can hold and flip resistance into support.
If successful, we could witness the early stages of a mid-term bullish trend, with potential targets reaching up to $10.49 in the coming weeks. However, caution is advised in case of a breakdown back below the key zone.
#RENDERUSDT #RenderToken #CryptoBreakout #TrendReversal #TechnicalAnalysis #BullishBreakout #DescendingTrendline #SupportResistance #CryptoCharts #WyckoffMethod #Altcoins
RENDERUSDT 1W AnalysisRENDER ~ 1W Analysis
#RENDER Buy gradually from here with a short term target of at least 20%++ from this support block.

RENDERUSDT 1D AnalysisRENDER ~ 1D Analysis
#RENDER Buy back gradually from this support block with short term target of at least 15%+ , Long term target $11

RENDERUSDT likely to head towards 7 and beyondThis one looks very promising.
The price is trading between weekly resistance WR1 and weekly support WS1.
The price may hit WS1 again before making a bounce and aiming for WR1.
With resistance facing some pullback at WR1, it is likely to attempt that resistance again only to break it this time and continue its journey to further upward.
Very nice long opportunity from WS1 zone.
I am loading this one heavy on WS1 hit.
