ETH — Using Fibonacci for High-Precision TradingUnderstanding Tools, Confluence & Today’s Setup
I’ve been getting a lot of DMs asking what the best indicator is.
The truth? There is no universal “best indicator” because indicators are tools, and every tool serves a different purpose. Trading is like carrying a toolbox: the skill isn’t in having the tools, but in knowing when and how to use them.
Educational Segment: Why Fibonacci Should Be Your Foundation
After years of studying different systems, I’ve come to a very simple conclusion:
👉 Fibonacci tools are the most powerful and reliable in my entire arsenal.
Why?
They help you spot reversal zones with precision
They work across all market conditions
They are rooted in natural ratios that markets consistently gravitate toward
They create predictable targets, retracements, extensions, and even timing when used correctly
Indicators like oscillators etc. are best used as confirmation, not as the primary signal.
If I had to pick one indicator besides Fibonacci, it would absolutely be the VWAP.
Why the Anchored VWAP Is Incredibly Underrated
It shows where true volume-weighted market support + resistance lies
It adapts dynamically
It works extremely well as a dynamic support/resistance line
It is fantastic as a trailing stop-loss tool
It helps identify institutional footprints in price structure
Fibonacci + VWAP is one of the strongest forms of confluence you can build.
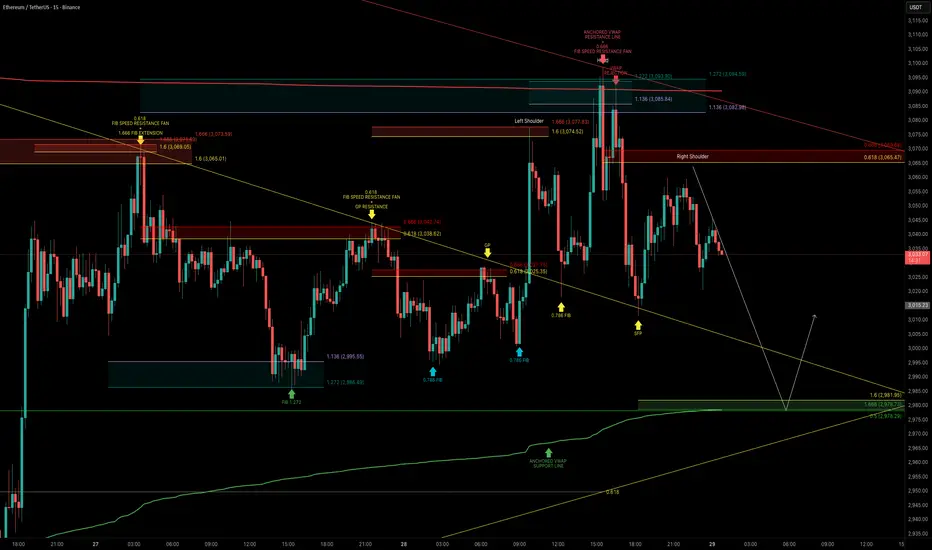
ETH Technical Breakdown
Today, ETH attempted a breakout but the move failed, and the rejection was clean.
ETH rejected at the anchored VWAP aligned with Fibonacci reversal zone:
ETH tested the anchored VWAP near $3,090 twice, coinciding with the 1.136–1.272 Fibonacci Reversal Zone.
This confluence acted as a strong resistance, leading to a swift selloff soon after.
Key Confluence Level Below:
My next major downside target lines up with a cluster of confluences:
1.6-1.666 Fibonacci extension
0.5 Fibonacci retracement
Anchored VWAP (green support line)
Liquidity zone (demand area)
0.618 Fibonacci speed fan support
Educational Takeaway → Confluence Is King
If there’s one lesson to internalize:
The more factors that align at the same level or zone, the higher the probability of a successful trade.
This ETH range has provided several high-quality setups for anyone who understands how to read price through Fibonacci.
Final Notes
ETH remains in a well-defined trading range use confluence, stay patient, and let the market come to your level.
_________________________________
💬 If you found this helpful, drop a like and comment!
Reversalzones
BTCUSD Mind Mapping Analysis (MMC) + Structure Mapping + Target🕵️♂️ Introduction
Welcome traders! In today’s BTCUSD analysis, we dive deep into the Mind Mapping Concept (MMC) with curve-based support, smart money structure shifts, and mapped liquidity levels. This chart reveals how institutional players moved price through liquidity traps, accumulation zones, and major breakout points, culminating in a reversal zone.
This breakdown is ideal for traders using:
Smart money concepts (SMC)
Curve theory
Liquidity sweeps
Structure mapping
🔍 Detailed Breakdown of the Chart:
🔹 1. Ellipse Zone – Liquidity Trap Phase
The blue ellipse on the left shows a clear area of price compression and indecision.
This is where retail traders often enter prematurely, expecting reversal.
Smart money exploits these zones to collect liquidity — this is not yet a trend shift, but a trap.
You can observe multiple wicks and fakeouts, signaling manipulation and preparation for expansion.
🔹 2. Expanding Channel – Volatility Phase
Following the trap, price enters an expanding pattern (also known as a megaphone).
These structures indicate uncertain market behavior, often manipulated to clear both highs and lows.
Smart money uses this to exhaust both buyers and sellers before deciding the real trend direction.
🔹 3. Previous Target & SR Flip Zone
Price reaches the previous downside target, completing a downward liquidity move.
From here, the market forms a support-resistance flip (SR-Interchange) — a textbook zone for institutional entries.
Once this zone holds, it confirms that buyers are absorbing sell orders.
The curve starts forming, indicating deeper market structure realignment.
🔹 4. Black Curve – Mind Mapping Curve Support
One of the most important elements of MMC — the curve — acts as a psychological and algorithmic support line.
The curve captures the accumulation structure in a flowing manner.
Repeated touches and rejections confirm its strength.
As long as price respects the curve, the bullish momentum remains intact.
🔹 5. Breakout Confirmation
Price breaks through mid-range consolidation and hits Target 1.
This move confirms a shift in market sentiment from indecision to bullish control.
The breakout is supported by volume, structure alignment, and curve acceleration.
🔹 6. Major Breakout Zone
A major resistance line is broken — this marks a shift in macro structure.
At this point, we label the zone as “Major Breakout” — any retest of this can offer a high-RR entry.
🔹 7. Next Reversal Zone (Supply Zone)
Price is now inside the Next Reversal Zone, which is a potential supply area or liquidity magnet.
Institutional traders may use this zone for profit-taking or to initiate a deeper retracement.
Watch for rejection signs, such as long wicks, engulfing patterns, or volume divergence.
If this zone is absorbed (i.e., broken cleanly), expect another leg higher.
💡 MMC Summary (Flow Recap):
Trap → Expansion → Liquidity Target → SR Flip → Curve Accumulation → Breakout → Target Hit → Reversal Zone
Each stage reflects smart money behavior and follows the natural cycle of manipulation → accumulation → distribution.
📊 What to Watch Next?
Confirmation Rejection in Reversal Zone? Short entries could be valid with curve re-entries.
Bullish Continuation? A clean break above reversal zone = new weekly highs likely.
Retest of Curve? If price pulls back, watch for rejections on the curve for safer long positions.
🚨 Trade Tips Based on This Setup:
✅ Use multi-timeframe confluence (M30 + H1 or H4)
✅ Always mark out previous liquidity zones
✅ Place SL below the curve or zone rejections
✅ Avoid entering trades inside expanding zones – wait for structure confirmation
🔖 Conclusion
This BTCUSD setup showcases a masterclass in smart money behavior using the Mind Mapping Concept (MMC). From trap to breakout, every move is cleanly mapped, providing a strong edge to traders who understand institutional footprints.
Whether you're a scalper, day trader, or swing trader, incorporating MMC curve support and liquidity logic can take your trading precision to the next level.

GBPAUD I Potential short from reversal zoneWelcome back! Let me know your thoughts in the comments!
**GBPAUD - Listen to video!
We recommend that you keep this pair on your watchlist and enter when the entry criteria of your strategy is met.
Please support this idea with a LIKE and COMMENT if you find it useful and Click "Follow" on our profile if you'd like these trade ideas delivered straight to your email in the future.
Thanks for your continued support!
Brian & Kenya Horton, BK Forex Academy
