XRP/USD Analysis | Smart Entry, Risk, and Exit Plan🚨 XRP/USD: The Great Crypto Heist Plan (Swing/Day Trade) 🤑💰
Asset: XRP/USD (Ripple vs. U.S. Dollar)
Vibe: Bullish Bandit Mode
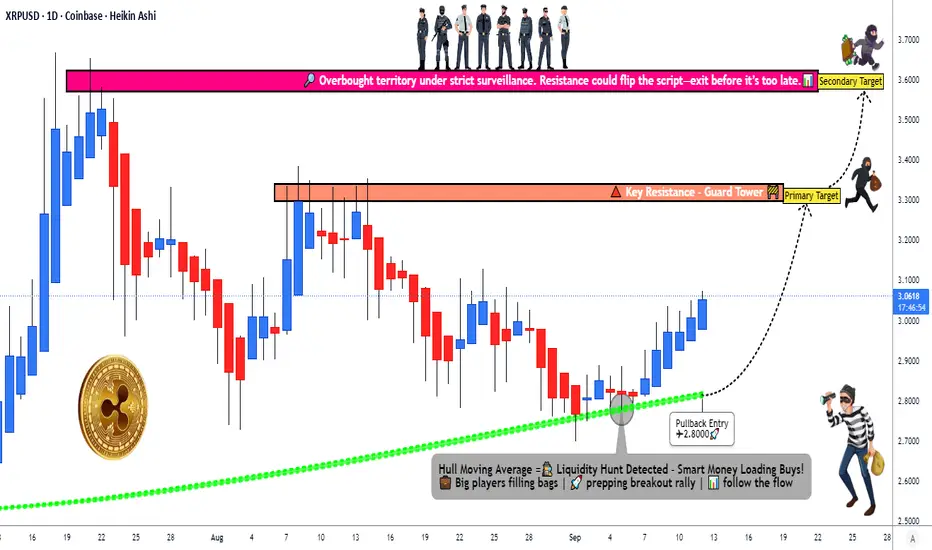
😎Plan: Steal the profits with a slick swing/day trade setup using the Thief Layering Strategy! The Hull Moving Average (HMA) is flashing green 📈, signaling a buy trend, and institutional players are sneaking in. Time to execute the heist! 🕵️♂️
📜 The Heist Plan: Key Details
🎯 Entry (The Sneaky Break-In):Deploy the Thief Layering Strategy with multiple buy limit orders to maximize your loot:
🪜 Layer 1: $2.9000
🪜 Layer 2: $2.9500
🪜 Layer 3: $3.0000
🪜 Layer 4: $3.0500
Pro Tip: Stack more layers based on your risk appetite and market conditions. Be the slickest thief in the crypto game! 😏
🛑 Stop Loss (The Getaway Car):Set your escape plan at $2.8000 after the breakout confirms. Dear Ladies & Gentlemen (Thief OGs), tweak your SL based on your strategy and risk tolerance. This is your heist, so protect your loot! 🚗💨
Note: I’m not your financial consigliere—set your SL wisely to avoid getting caught! ⚠️
🎉 Targets (The Big Score):Watch out for the police barricade (resistance + overbought zones + traps)! 🕴️
💰 Primary Target: $3.3000 — Grab your profits and slip away.
💎 Secondary Target: $3.6000 — For the bold thieves aiming for the jackpot!
Note: Don’t get greedy, Thief OGs! These are my suggested TPs, but take profits at your own risk and style. 💸
🔍 Related Pairs to Watch 👀
📊 BTC/USD: Bitcoin often leads the crypto market. If BTC pumps, XRP might follow the bullish vibe.
🦄 ETH/USD: Ethereum’s moves can influence altcoins like XRP. Watch for similar bullish signals.
🧩 ADA/USD: Cardano’s price action often correlates with XRP due to similar market dynamics.
Why Watch These?These pairs can act as your lookout crew. If BTC or ETH shows strength, it could boost XRP’s breakout potential. Conversely, if they tank, be ready to pivot your getaway plan! 🚨
🧠 Key Points & Correlations
📈 Hull Moving Average (HMA): The HMA is our trusty lookout, confirming the bullish trend with its smooth, low-lag signals.
💼 Institutional Flow: Big players are entering, adding fuel to XRP’s upward momentum. Follow the smart money!
🌊 Market Correlation: XRP often dances in sync with BTC and ETH. A rising tide in crypto could lift XRP to our targets faster.
⚖️ Risk Management: The Thief Layering Strategy spreads your entries to reduce risk, but always adjust SL/TP based on your own heist style.
🚨 Risk Disclaimer
Dear Thief OGs, this is a high-stakes crypto heist! I’m sharing my setup, but you’re the mastermind of your trades. Set your SL and TP based on your risk tolerance, and never bet the farm. Trade smart, stay sharp, and escape with profits! 😎
✨ “If you find value in my analysis, a 👍 and 🚀 boost is much appreciated — it helps me share more setups with the community!”
#XRPUSD #CryptoTrading #SwingTrading #DayTrading #ThiefStrategy #Bullish
Ripple
xrp long idea/classic patternI have been trading this pattern for a long time now, and I am waiting for a 3 top to form, the highest in the 3.55 zone from where a strong decline could occur. We have been preparing for a strong uptrend on the hrp at 40% for quite some time now

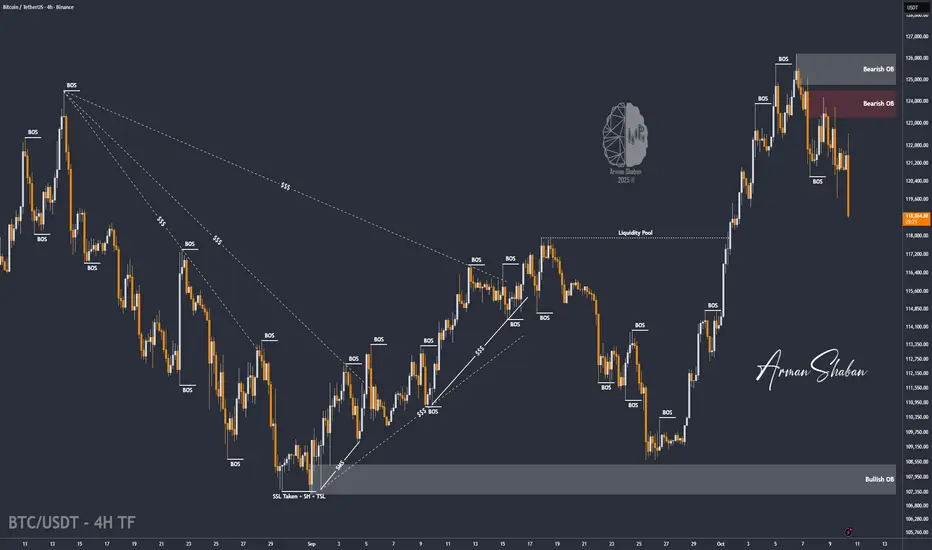
BTC/USDT | BTC Correction in Play – Will $117K Hold the Line?By analyzing the Bitcoin (BTC) chart on the 4-hour timeframe, we can see that after rallying up to $126,000 and setting a new all-time high (ATH), the price faced a sharp correction and is now trading around $119,000.
This drop could extend further toward $117,000, which is a key level to watch closely. If Bitcoin manages to hold above this zone, we could see the next bullish wave begin. Otherwise, the next major demand zones are at $115,000, $113,500, and $112,120.
Please support me with your likes and comments to motivate me to share more analysis with you and share your opinion about the possible trend of this chart with me !
Best Regards , Arman Shaban
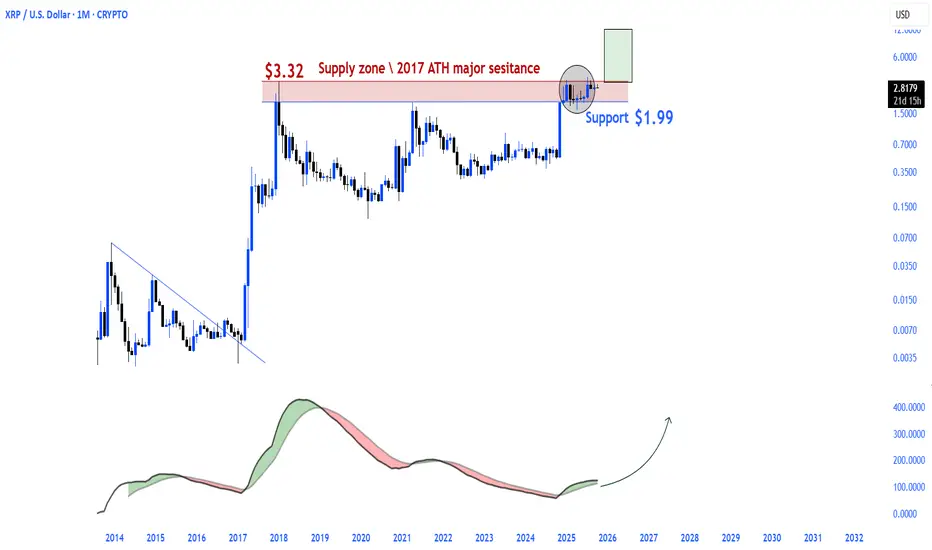
$XRP Explosion After Re-Accumulation.XRP has been strengthening in a horizontal consolidation pattern for quite some time.
The $3.32 region, which was the 2017 peak, was retested on the monthly chart and rejected.
This level was a significant resistance area in the past, but it is now a pivot point that could potentially open the door to a new parabolic rise.
Major support at $1.99, staying above this level confirms the bullish reversal of the structure.
The momentum indicator is in an area where it could move upward.
This table may signal the awakening of a giant that has been silent for a long time.
Emerging from the re-accumulation phase is not always without surprises.
XRP Daily – Can the 0.236 Fib Hold Again?XRP Daily – Testing Support at the 0.236 Fib Level
XRP is once again trading in the green support area that has held since the beginning of August.
This zone aligns with the 0.236 Fibonacci level and forms the base of a descending triangle, with the series of lower highs creating its upper boundary.
Price has also lost the 50MA, and from a system perspective, the structure confirms a short-term downtrend, with Price < MLR < SMA < BBcenter.
If this triangle breaks to the downside, the next significant support sits at the 200MA at $2.60.
Momentum indicators remain weak:
RSI is below its moving average and trending downward, while MACD has already turned red, showing fading strength.
With the broader market showing signs of consolidation after BTC ATH,
XRP reaction here could reveal how altcoins handle pressure at key supports.
For now, this support zone remains key; losing it would confirm a bearish breakout from the triangle pattern.
Bias: Short-term bearish, watching the 0.236 Fib and 200MA as critical levels for reaction.
Always take profits and manage risk.
Interaction is welcome.

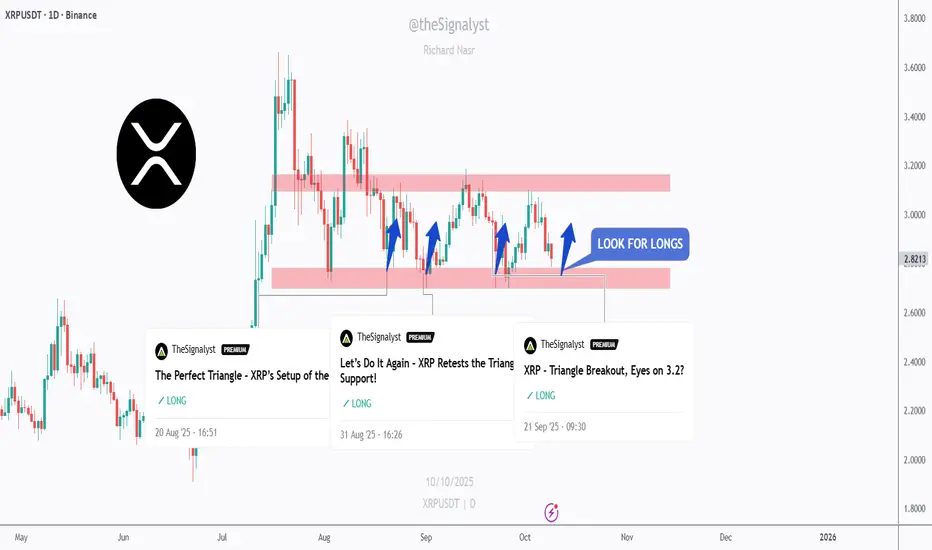
$XRP – Let’s Do It Again!!XRP is once again retesting its daily support zone around $2.60–$2.80, the same level that triggered multiple bullish impulses in recent months.
As long as this red support zone holds, I’ll keep looking for long setups targeting the $3.10–$3.20 supply area.
A daily close below $2.60 would invalidate the setup and shift focus toward the $2.30 support before any potential rebound.
It’s the same play, same level, and the same structure. Let’s see if XRP delivers again! 💪
⚠️ Disclaimer: This is not financial advice. Always do your own research and manage risk properly.
📚 Stick to your trading plan regarding entries, risk, and management.
Good luck! 🍀
All Strategies Are Good; If Managed Properly!
~Richard Nasr
XRPUSD - A Realistic Indicator?This indicator predicts a massive increase for XRP with tops at $100
That is a massive move on this Weekly timeframe
What do you think?
Indicator Idea

XRP - 20% move is COMING!! BIG OI rise!!XRP - 20% move is COMING!! BIG OI rise!!
open interest increased by 154m Xrp coins
many times fater such thing price did significant move
in a case of break donw it could reach 2.4

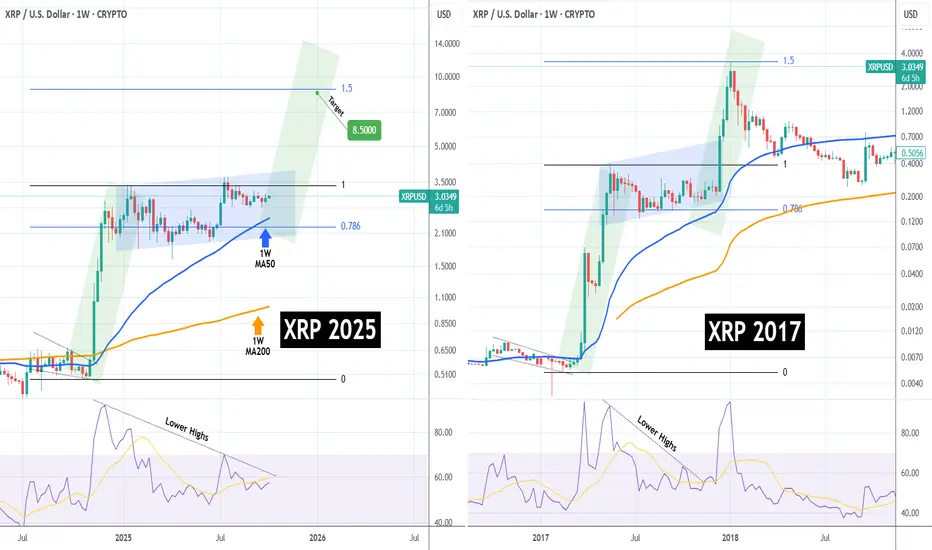
XRPUSD getting ready for its NOW-or-NEVER moment to $8.500XRP (XRPUSD) has been trading sideways since the July 14 2025 High in a growth pattern that resembles 2017. As it approaches the 1W MA50 (blue trend-line), the market gets closer to its now-or-never moment as the 1W MA50 is expected to hold and provide a bullish boost similar to December 11 2017, which made the price rally to its 1.5 Fibonacci extension.
With even the 1W RSI sequences among the two fractals also looking identical, we can see XRP peaking around $8.500 (Fib 1.5 ext), if this model repetition is completed.
-------------------------------------------------------------------------------
** Please LIKE 👍, FOLLOW ✅, SHARE 🙌 and COMMENT ✍ if you enjoy this idea! Also share your ideas and charts in the comments section below! This is best way to keep it relevant, support us, keep the content here free and allow the idea to reach as many people as possible. **
-------------------------------------------------------------------------------
💸💸💸💸💸💸
👇 👇 👇 👇 👇 👇
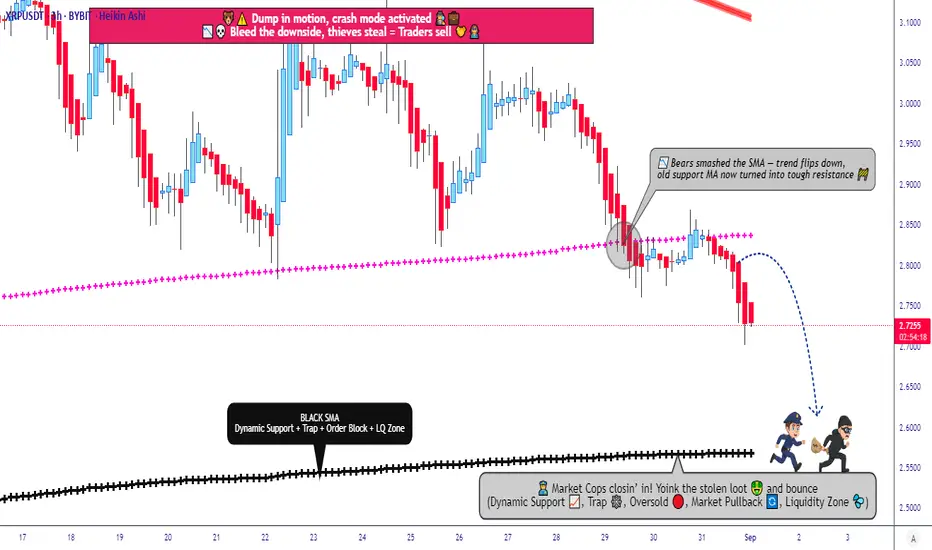
XRP/USDT Market Report + Strategic Entry Levels🚀 XRP/USDT Market Report & Layered Trading Plan (Day/Scalping Trade) 📊
Current Price Snapshot 💰
XRP/USDT is trading at $2.81, down slightly 0.04% over the last 24 hours amid broader market consolidation. Daily volume is strong at over $3B, showing steady interest. Market cap sits around $167B, ranking XRP in the top 4 cryptocurrencies. Support has held near $2.80 over the past week, with potential for a rebound if key levels break.
📈 Trading Plan: Bearish (Layered Strategy)
Entry : Any price level; use multiple limit orders (layering strategy) for controlled exposure. Example layers: 2.7500 | 2.7700 | 2.8000 | 2.8200. Adjust layers based on your own risk/reward preference.
Stop Loss 🛑: Suggested 2.8800. Adjust according to your personal strategy.
Target 🎯: 2.5700. Use smart exits and scale out of positions based on market momentum.
✅ Layered entries help reduce risk while maximizing opportunity. Ideal for scalping/day trades.
😊 Investor Mood & Sentiment
Overall Bullishness: 65%
Retail Traders: 70% bullish – excitement over payments utility, ETF expectations, partnerships.
Institutional Traders: 55% bullish – whale accumulation + cautious optimism, with some profit-taking.
Fear & Greed Index ⚖️: 48 (Neutral) – market steady, volatility at 4.27%. Consolidation phase ideal for strategic positioning.
🏗️ Fundamental Score: 85/100
Strengths: High adoption (300+ partners, $1.3T yearly transactions), fast XRPL settlements (3-5s), low fees, escrowed supply cap, burned fees reduce circulating supply.
Weaknesses: Competition from stablecoins like USDC could cap growth if banks shift focus.
🌍 Macro Score: 75/100
Bullish Drivers: Fed rate cuts, crypto-friendly policies, ETF approvals likely.
Challenges: Trade tensions, inflation, emerging market pressures.
Net positive: adoption in Asia/Africa outweighs headwinds for now.
🔮 Overall Market Outlook
Bullish (60% probability) 🟢 – potential to test $3.35 resistance, with $4 possible if ETF news hits.
Key Watch: Break above $3.00 confirms strength. Buy dips near $2.72 support for upside.
🗂 Related Pairs to Monitor
ETH/USDT | BTC/USDT | LTC/USDT | ADA/USDT
#XRPUSDT #Ripple #CryptoTrading #Scalping #DayTrade #LayeredStrategy #CryptoAnalysis #MarketReport #CryptoSentiment
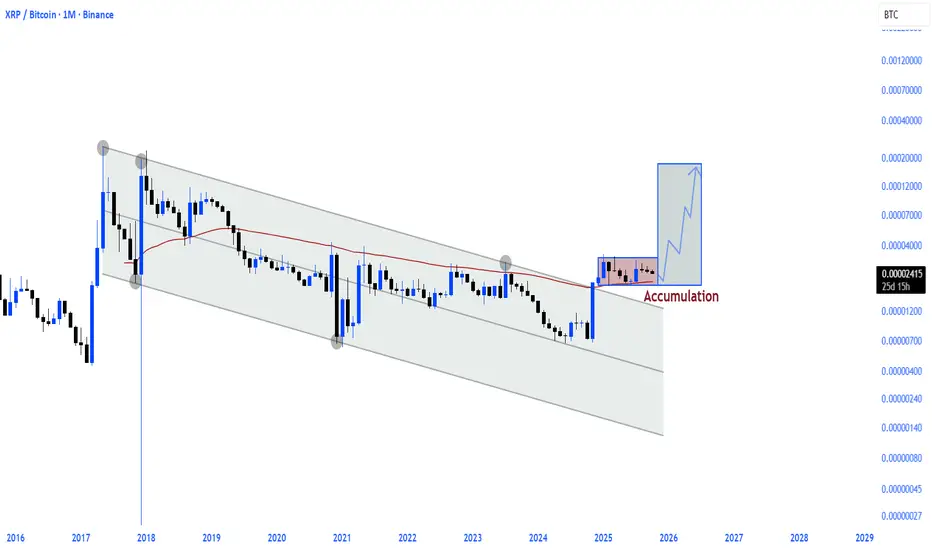
$XRP / $BTCThe 7.5-year descending channel broke in November 2024
The resistance level (50EMA), which served as a significant barrier, was broken in November 2024 after 5.5 years, and accumulation is currently occurring above this level.
The Ripple rally is definitely going to be very hot.
XRP 1H Analysis - Key Triggers Ahead☃️ Welcome to the cryptos winter , I hope you’ve started your day well.
⏰ We’re analyzing XRP on the 1-Hour timeframe .
👀 On the 1-hour timeframe, XRP recently completed a solid bullish rally, reaching resistance around $3.06, before retracing toward its local support zone near $2.94. The coin has tested its top level about three times, getting rejected each time under selling pressure. After the latest rejection and rebound from the $2.94 zone, a short-term trigger has formed around $2.98 — a breakout above this level could significantly increase the likelihood of a resistance breakout.
🧮 The RSI oscillator shows that after ranging below the 50 zone, it has now crossed above it and is heading upward. A 1-hour candle close above the trigger zone would confirm bullish momentum; otherwise, the move risks failing.
🕯 The recent candle structure on the 1-hour chart has been relatively range-bound, partly due to low market activity during holidays. However, with increasing volume and the larger size of recent bullish candles, there’s potential for stronger upward continuation.
🧠 For XRP positions, traders can consider low-risk entries once a candle closes above the marked trigger zone in this analysis. Rising volume and strong candle closures may fuel volatility and expand long opportunities.
❤️ Disclaimer : This analysis is purely based on my personal opinion and I only trade if the stated triggers are activated .

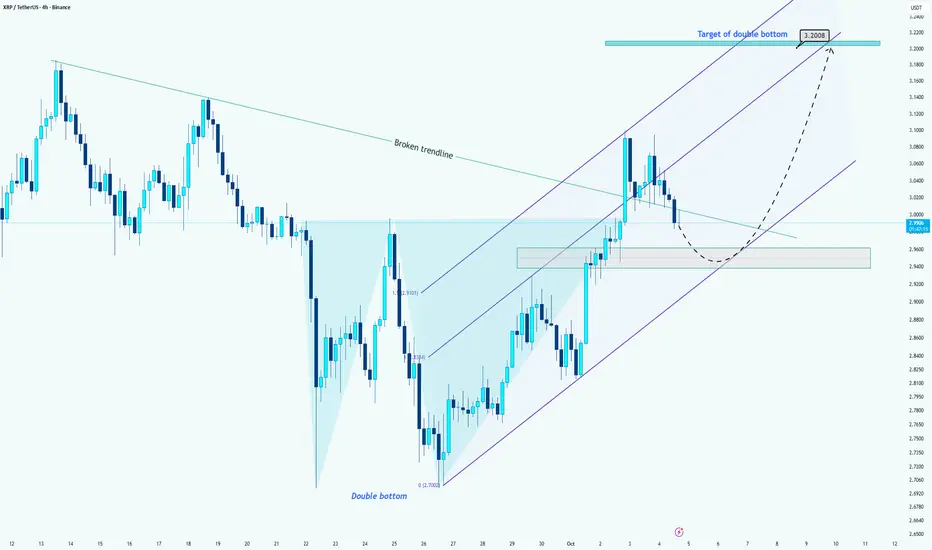
XRP/USDT –> Double Bottom Formation Confirmed!Hi guys!
After breaking above the descending trendline, XRP has confirmed a double bottom pattern around the 2.70 area.
Currently, the price is moving inside an ascending channel, but after facing resistance near 3.10, it has entered a correction phase. The 2.94–2.96 area now acts as a key support zone, aligning with both the previous neckline and the channel’s midline.
If this support holds, we can expect the price to bounce upward and resume its bullish momentum toward the 3.20 area, which represents the target of the double bottom.
However, if the 2.94 support breaks down, we might see a deeper correction toward the lower channel boundary before any continuation move.
🎯 Targets:
First target: 3.20 USDT (double bottom projection)
Extended target: 3.30 USDT (upper channel resistance)
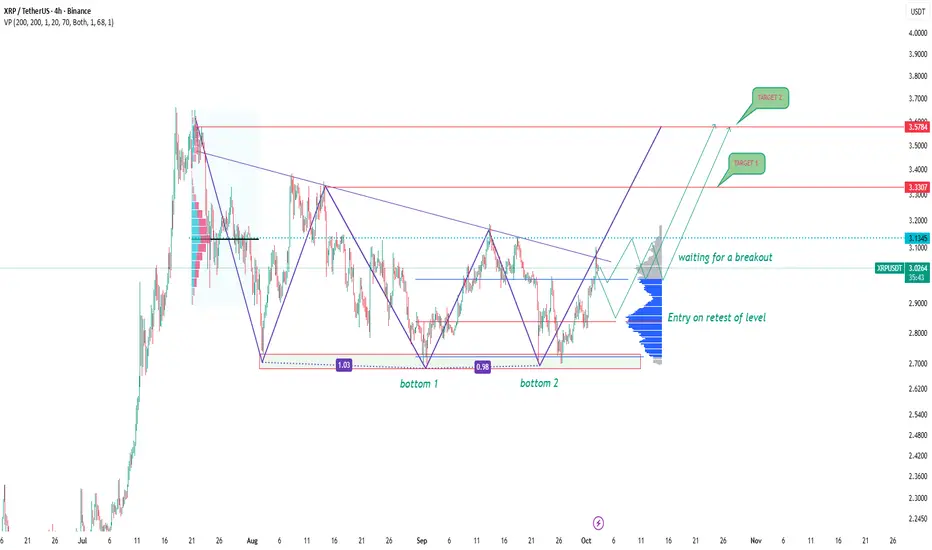
XRPUSDT: double bottom and waiting for a breakoutOn the 4H chart, XRPUSDT is shaping a double bottom around the 1.00 level, and the price is now approaching the key resistance area at 3.14–3.32. A breakout above this zone would be a strong confirmation that the bearish phase is losing momentum.
Technically, the scenario suggests a breakout above 3.14, followed by a retest, and then continuation toward 3.32 and 3.57. This fits the classic pattern where accumulation turns into momentum-driven buying.
From a fundamental perspective, XRP still draws attention thanks to Ripple’s legal battle with the SEC and the use of the token in cross-border transactions. Positive headlines can accelerate the rally, though broader crypto market corrections or regulatory pressure could put the brakes on growth.
This is exactly the kind of setup where expectations and reality may diverge. The structure looks bullish, but without a confirmed breakout, the market can easily roll back. Better to wait for confirmation and trade with discipline.
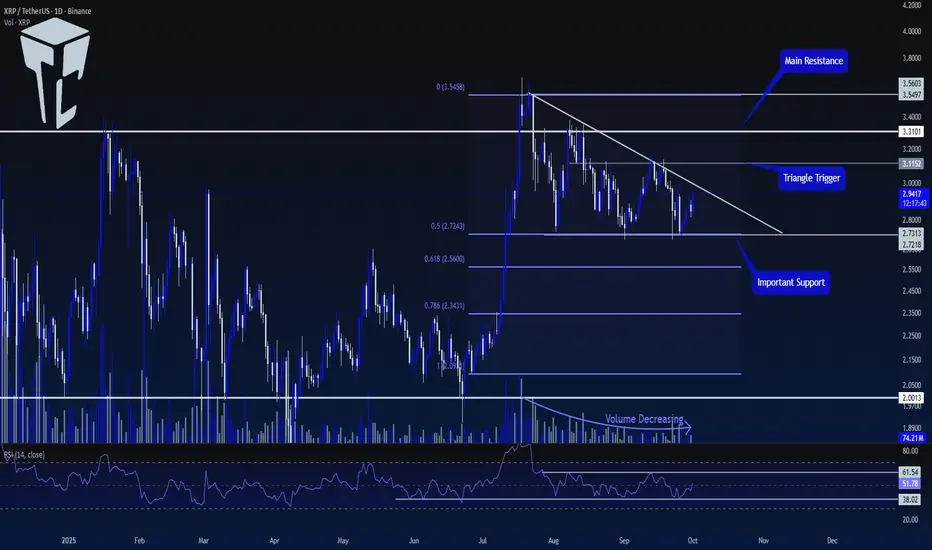
TradeCity Pro | XRP: Key Support and Resistance Zones Testing👋 Welcome to TradeCity Pro!
In this analysis, I will review the XRP coin. One of the oldest crypto projects, XRP aims to align crypto transactions with the SWIFT system. The coin has a market cap of $173 billion and is ranked 4th on CoinMarketCap.
📅 Daily Timeframe
After getting support at the 2.0013 level, XRP made a bullish move up to the 3.5603 resistance. Now, it has formed a descending triangle, and the volume has been decreasing as the price moves down.
⚡️ Currently, a crucial support zone has formed at 2.7218, which overlaps with the 0.5 Fibonacci level, forming a PRZ for us.
🧩 A descending trendline has also been created, and the price has touched it several times, making lower highs.
📊 To confirm the next bullish move for this coin, the first confirmation we need is the breakout of the trendline. The trendline breakout trigger is at 3.1152.
✨ Once this level is broken, we can open a long position. This trigger is the first long position trigger and is considered risky since we haven't yet received the main confirmation for a bullish trend.
🔍 The main trigger for the start of a new bullish trend is the breakout of the 3.3101 level. Breaking this level could start a new upward move for XRP.
💥 A very important confirmation for both long and short positions on the RSI is the breakout of the range between 38.02 and 61.54.
🎲 As long as the RSI remains between these two levels, the probability of hitting stop losses is high. Therefore, for a long position, we can wait for the 61.54 level on the RSI to be broken.
🔽 For a short position, the 38.02 level on the RSI is a good momentum trigger. We can also use the 2.7218 level as a trigger, but keep in mind that the main market momentum is bullish, so this short trigger is considered risky.
📝 Final Thoughts
Stay calm, trade wisely, and let's capture the market's best opportunities!
This analysis reflects our opinions and is not financial advice.
Share your thoughts in the comments, and don’t forget to share this analysis with your friends! ❤️
XRP Swing Long Opportunity - LRKZ MODELXRP Swing Long Opportunity
📊 Market Sentiment
FED has resumed its rate-cutting cycle, starting with a 0.25% cut in September, with two more 0.25% cuts expected in the coming months. Additionally, institutional liquidity inflows have accelerated as the U.S. officially adopts crypto as part of its reserves. While inflation remains elevated, the weakening labor market is forcing the FED to ease, driving more capital into risk-on assets.
📈 Technical Analysis
Price made a new all-time high and is currently retracing before pushing higher again.
Price ran the weekly swing liquidity at $2.70 and closed above with a wick, confirming manipulation before expansion.
Price also retested the broken HTF Demand zone at $2.69, which was strong resistance previously and now acts as strong support.
These confluences strongly suggest rejection and continuation higher.
📘 Model to be used – HTF Liquidity Run into HTF Key Zone (LRKZ Model)
In this model, I first define the HTF trend. Then, I look for the most significant liquidity that lies opposite to the HTF trend (swing highs or lows). These zones often contain enough liquidity to trigger reversals or strong bounces. When price sweeps this liquidity and retests an HTF Key Zone (where strong limit orders sit), it creates a high-probability setup. Confirmation on LTF then provides the entry trigger.
📌 Game Plan
Price already closed above the $2.70 level, confirming entry. Looking for continuation higher with structured targets.
🎯 Setup Trigger
Setup is active long position valid after the daily close above $2.70.
📋 Trade Management
Stoploss: Daily close below $2.70 or hard stop at $2.50.
Targets:
TP1: $3.18
TP2: $3.37
TP3: $3.66 (ATH)
After TP1 is secured, I will move stoploss to breakeven and scale profits as price moves toward higher targets.
💬 Like, follow, and comment if this breakdown supports your trading! More setups and market insights coming soon — stay connected!
⚠️ Disclaimer: This content is for informational and educational purposes only and does not constitute financial, investment, or trading advice. Always DYOR before making any financial decisions.

XRPUSD TRADE IDEA, 30 SEPT 2025.The Ripple seems to be moving in the same direction like the Eth, cause the analytical framework seems identical and looks the same, but the for four most stable leading coins follow each other as the take lead from the over ring leader bitcoin, all the four stable coins are still on a short retracement downward but the question is if the movement downward would hold.

Will Ripple (XRP) continue to sell XRP – Distribution Pattern & Elliott Wave Roadmap
We’ve now tapped this support line five times. The structure looks like another Lower High (LH) forming inside a distribution pattern.
• Bullish scenario: If price breaks above the LH structure, we could see continuation toward a new all-time high.
• Bearish scenario: If lower highs persist, I don’t expect a sixth touch of this support. Instead, a decisive break lower would confirm the top of Wave (5) and start a larger correction.
That correction should complete as a 3-wave structure, setting up the Super Cycle Wave (1) top. From there, leg 2 develops before a true leg 3 rally begins. Based on my count, that rally zone could emerge from $0.05 – $0.14.
This chart is part of my overall Elliott Wave view (see my first post). I’ll update that main chart when a minor leg one within this corrective phase is confirmed.
⚠️ CRYPTO:XRPUSD Stay tuned—updates will follow as CRYPTO:XRPUSD defines its path.

$XRP are we back run it.As supported by momentum on the XRP side, upward momentum is accelerating with the reaction from the demand zone.

XRP Still consolidating below all time highCRYPTOCAP:XRP continues to consolidate below all time high with no significant drop yet on the macro.
I expect this drop to come to complete wave 2 but with a shallow correction to the weekly pivot at $1.7 between the 0.236 and 0.382 Fibonacci retracement.
My previous analysis still stands about this being a terminal move due to the macro triangle (an Elliot wave pattern that comes before a final thrust) that would see price long term returning to the triangle bottom during a prolonged bear market $0.3-0.5.
For now the trend is up! Have an exit plan! I will be looking for long a those key levels.
Safe trading

BUY AND HOLDHello friends
You see that after the good rise we had, the price has entered a correction and it is a good opportunity to buy in a stepwise manner in the price correction with capital and risk management and move with it to the specified goals.
Ripple is a currency whose holders have a good expertise in disappointing short-term traders.
Note that the holding period is at least 3 months, so be patient and observe capital management.
*Trade safely with us*

Descending channel/Bull flag on xrpusd revealedAfter the most recent resistance was found I was able to find the channel xrpusd price action is currently in which also is functioning as a bullflag. My guess is the uptrend will resume in October but we will know soon enough *not financial advice*

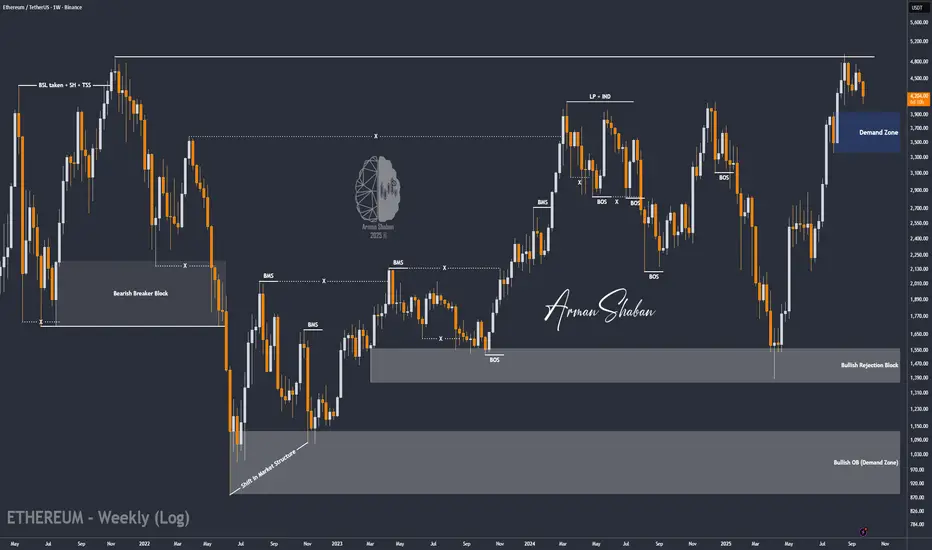
ETH/USDT | Correction Over? Big Rally Loading After Demand ZoneBy analyzing the Ethereum chart on the weekly timeframe, we can see that after Bitcoin’s heavy dump , ETH also corrected and is now trading around $4,200 .
Based on the previous analysis, the $3,300–$3,900 zone is still a key demand area. If the price enters this zone, I expect Ethereum to start its next bullish wave.
The possible upside targets for this rally are $5,100, $5,500, and $6,000.
Please support me with your likes and comments to motivate me to share more analysis with you and share your opinion about the possible trend of this chart with me !
Best Regards , Arman Shaban