XRPUSDT - Time to be bearish!!Did you know that the XRP chart has turned bearish and is looking pretty grim?
A lot of indicators are pointing in that direction right now.
It recently formed a triangle pattern, broke out, rallied, and hit a new ATH — which coincided with the fifth and final wave of the Elliott Wave impulse.
Now it has shifted into an ABC corrective structure, and wave B seems to have completed, setting the stage for the main corrective move with wave C, which is expected to deliver around a 30% pullback from this point.
Another red flag for me is that XRP barely managed to break into a new ATH, only to quickly reverse and is now retesting the previous ATH, which lines up with the 1.00 Fibonacci level. Based on this, I strongly expect a major correction in XRP from here.
Sure, a lot of die-hard XRP believers won’t like this take — but let them ride it down. You can always buy back cheaper, my friend.
take a look to this post
As I told you earlier in a previous post, I recommended buying it at that time(3 months ago), which was the perfect entry. It has now risen by 50%, so I’m telling you to sell if you still hold it.
Best regards:
Ceciliones🎯
Ripple

XRP - The Unpopular Analysis!XRP printed a macro triangle from 2021-2024. Triangles are an Elliot wave pattern resulting in a terminal thrust up in a motif wave before price returns to the bottom of the triangle at $0.28! Now this seems extremely unlikely given whats going on fundamentally but I don't make the rules so don't shoot the messenger!
The motif wave appears to have completed wave 4 bull flag at the $1.6 swing low and wave 5 is underway (which can overextend). Elliot wave count would suggest we are near a major top after one more push up to new highs. More realistic price targets for a deep retracement would be $1.6 again which the ascending weekly 200EMA would catch up to for confluence.
Interested to hear from the other Elliot wave specialists on this count!
Analysis is invalidated below $1.6
New long signals are building in the DEMA PBR and Price Action strategies so keep an eye out on the Trade Signals Substack as we have made very good profits lately in these markets!
Safe trading

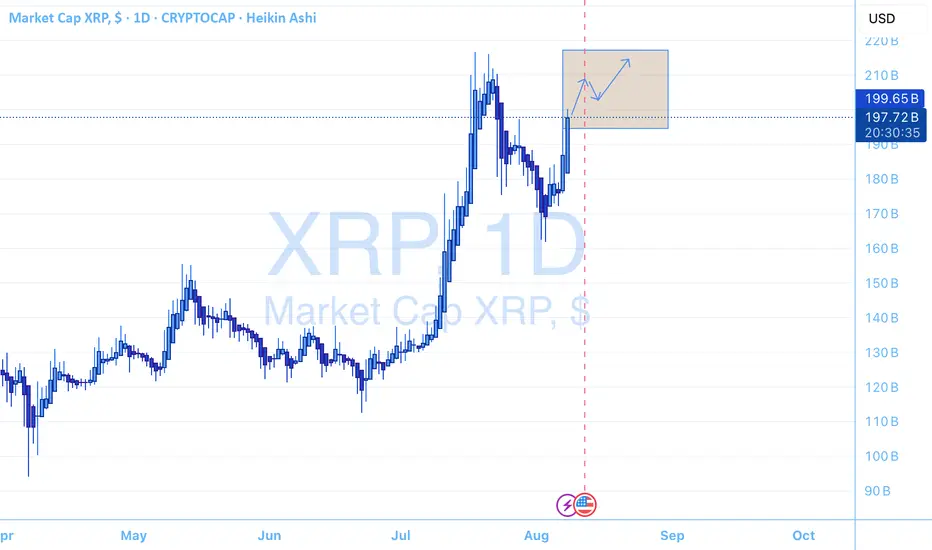
Can XRP hit 10$ in 2025 ?Can XRP hit 10$ ???
if you see this XRP CRYPTOCAP:XRP chart, all 12 years of history, you can see simple & clean,
12 years ago XRP price was 0.00286$ only, and recentl XRP created ATH 3.66$
in 2017 XRP Price 0.003$ and from there XRP Showing big Rally
The past 8 years 1,22,000% price increase
i'm highly confident we can see 10$ mark as well,
The next target is already mentioned in the chart, along with price details.
Share with others and follow now @GlobalRashid for more content like this.

XRP | Ripple Game Plan - Swing Long Idea📊 Market Sentiment
Overall sentiment remains bullish, supported by expectations of a 0.25% rate cut in the upcoming FOMC meeting. The weakening USD and increased risk appetite across global markets are creating favorable conditions for further upside in crypto assets.
📈 Technical Analysis
Price broke the bearish trendline that had been driving the downtrend since July 18th.
A strong breakout and close above the trendline confirmed the move.
The breakout area also aligns with a significant HTF key level, adding strength to this zone.
📌 Game Plan
Looking for a quick retest of the broken trendline and HTF key level before a rejection.
🎯 Setup Trigger
Confirmation will come from a clear 1H break of structure after the retest.
📋 Trade Management
Stoploss: Below the 1H swing structure that caused the break of structure
Targets: TP1: 3.57 | TP2: 3.66
Will trail stop aggressively to secure profits as the move develops.
💬 Like, follow, and comment if this breakdown supports your trading!
More setups and market insights coming soon — stay connected!

All in XRPRegulatory Shift: Barriers for Ripple and XRP are easing, clearing the path for dominance in crypto/blockchain markets.
End of Retail Bubble: The retail-driven crypto era is fading, with institutional players paving the way for entry.
XRP ETF Progress: Eight XRP spot ETF applications from major funds await SEC approval, expected within months.
Ripple Lawsuit Nearing End : Resolution is imminent, setting a precedent for other crypto projects.
Blockchain as Infrastructure: The new U.S. Treasury Secretary and SEC Director recognize blockchain as critical national infrastructure, comparable to railroads and the internet in its transformative potential. This perspective aligns with the rhetoric of global financial authorities like the IMF, BIS, and WEF, as well as leading consulting firms, which have championed blockchain’s role in revolutionizing finance and cross-border transactions over the past few years.
Market Trends : Stablecoins, CBDCs, tokenization, and cross-border payments will drive growth, settling on public blockchains.
XRP’s Advantage : Stress-tested by global banks and governments for over a decade, XRP is uniquely equipped for large-scale enterprise adoption. Backed by Ripple, a leading fintech with connected leadership and top talent, XRP leverages unmatched expertise and a global network of bank and payment partners, driving innovation and solidifying its enterprise-grade infrastructure.
Market Performance: Post-election, XRP surged 500%, outperforming all coins, with stop-loss hunting below $3 likely over.
Conclusion and price prediction XRP remains largely unnoticed by mainstream media, its transformative potential yet to resonate with the broader public. Compared to Bitcoin, XRP is still in its infancy as a store of value and speculative asset for retail investors. Yet, as market dynamics shift and critical developments unfold, a potent blend of utility-driven demand and speculative momentum could propel XRP to $10 by the end of 2025. If Ripple’s vision of an Internet of Value takes root—enabling seamless, instant, and low-cost global transactions, capturing a substantial portion of SWIFT’s payment flows, and harnessing the power of tokenization—XRP could emerge as a cornerstone digital asset commodity, potentially soaring to triple-digit valuations by 2030 and fundamentally redefining its role in the global financial ecosystem.
TON/USDT | Toncoin Rebounds from Support – Bullish Targets AheadBy analyzing the Toncoin chart on the 3-day timeframe, we can see that the price found support around $3.123 and started to push higher, now trading near $3.36. Given the current momentum, I expect further short-term upside from this cryptocurrency. The next short- to mid-term bullish targets are $3.74, $4.20, and $4.68.
Please support me with your likes and comments to motivate me to share more analysis with you and share your opinion about the possible trend of this chart with me !
Best Regards , Arman Shaban

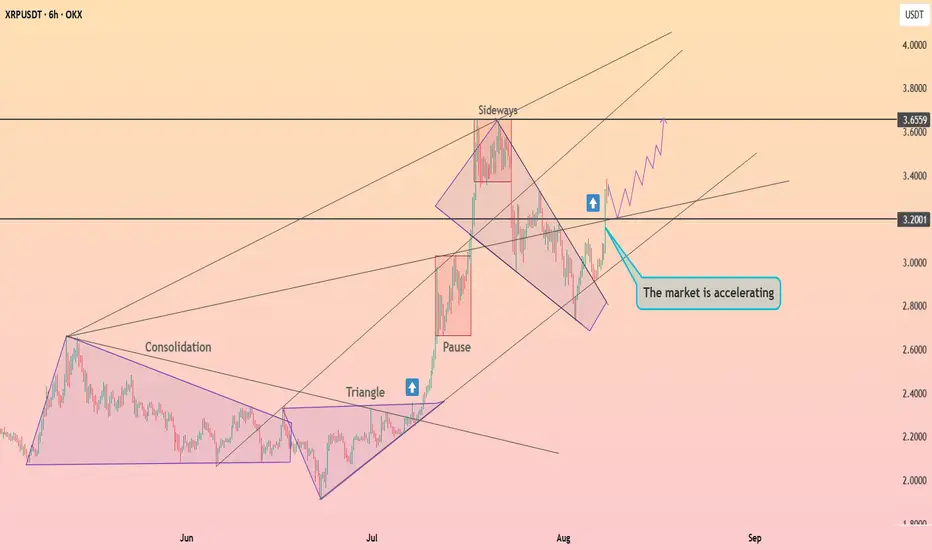
XRP is accelerating ┆ HolderStatOKX:XRPUSDT snapped back above 3.20 after a corrective slide from the 3.65–3.70 supply band. Structure shows a strong leg up out of a large triangle base, a brief “pause,” then a channel‑style pullback that just broke to the upside. As long as the market holds 3.10–3.20, upside magnets are 3.35, 3.50 and the key cap at 3.66. A decisive close above 3.66 would validate a fresh trend leg; a loss of 3.10 would likely revisit 2.95–3.00 demand. Momentum favors continuation while higher lows stack above reclaimed trend support.
Bullish on XRPCurrently all eyes are on ETH, but XRP is doing the same thing. Its ultra strong (at least as strong as ETH), bullish on all timeframes, trading above major EMAs. Showed off a 10% growth since the EMA crossover. Now let it cool down a little bit and wait for a entry around 3.20$. From there we may catch the next leg up 3.90$.
For more trade ideas check and insights check our profile.
Disclamer: only entertaining purpose, no financial advice - trading is risky.

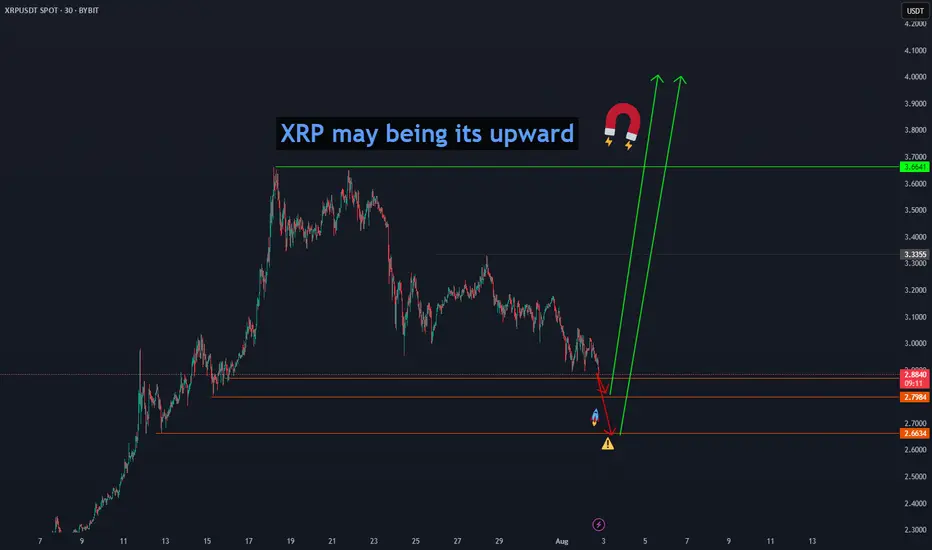
XRP may being its upward" Ripple (XRP) may begin its upward move from the price levels of 2.8865, 2.7984, and 2.6634, aiming for a first confirmed target at 3.6641 and then $4." BINANCE:XRPUSDT

Potential BUYSEC case has closed and with news from china over the last two days we've managed to see a big DIP causing the markets to go down, with the new bills that has passed as well in this closing XRP will do a massive break out and go Bullish.
XRP and 200% proif After a 100% gain in the previous signal, Ripple has a target of more than 200% ahead, and with a good buy, you can make a great profit.

Back to $4 - XRP weekly update August 7 - 13thXRP is currently advancing within a Minor Wave 3, which forms part of an Intermediate Wave 5 — itself completing a larger Primary Wave 1. This alignment across multiple degrees of trend suggests that XRP may be in the early stages of a broader bullish cycle with meaningful upside potential. The structure of the preceding Intermediate Wave 3 is clearly impulsive, which supports the idea of sustained continuation.
There is, however, some ambiguity in the early part of this current impulse — particularly in the development of Minor Wave 1. This leaves room for an alternative scenario that assumes a more complex correction may still be in progress. This would only be confirmed if the Wave 4 low is breached, thereby invalidating the current impulsive count.
Sentiment and market data currently favour the bullish outlook. Funding rates are positive, showing that the market is leaning long, and open interest is rising, indicating increased trader participation. Furthermore, the liquidity heatmap shows a notable cluster of liquidity above current price, which could serve as a magnet during a third wave — typically the most dynamic part of an impulsive move.
On a broader level, this anticipated momentum could also be fueled by macroeconomic developments. For much of the year, capital inflows into crypto were restricted by the Federal Reserve’s reluctance to lower interest rates. However, that could change soon: according to the CME Group’s FedWatch Tool, there’s a 93.6% probability of a rate cut at the upcoming FOMC meeting in September. Markets tend to front-run such events, and this expectation could trigger renewed retail buying — precisely the kind of sentiment shift that often fuels Wave 3 advances.
Importantly, institutional players appear to have already positioned themselves earlier, as evidenced by the formation of order blocks near the end of Wave 2. This suggests that what we’re witnessing now may be retail-driven momentum building on top of smart money accumulation — a classic dynamic in developing third waves.
As long as the current structure remains intact and the Wave 4 low holds, XRP is well-positioned for further upside — with the $3.50–$3.88 zone as a near-term target. The technicals, sentiment, liquidity positioning, and macro backdrop all point in the same direction: higher.

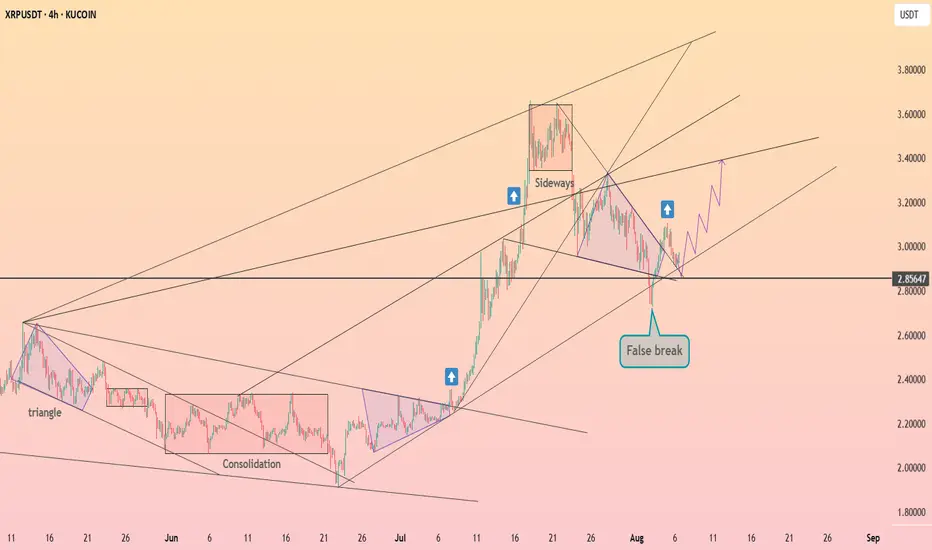
XRP go out from the wedge ┆ HolderStatKUCOIN:XRPUSDT faked a breakdown below 2.85 and is now recovering back into range. This aligns with previous bullish setups following consolidation. As long as the false break holds, price may attempt to move toward 3.40–3.50 again.
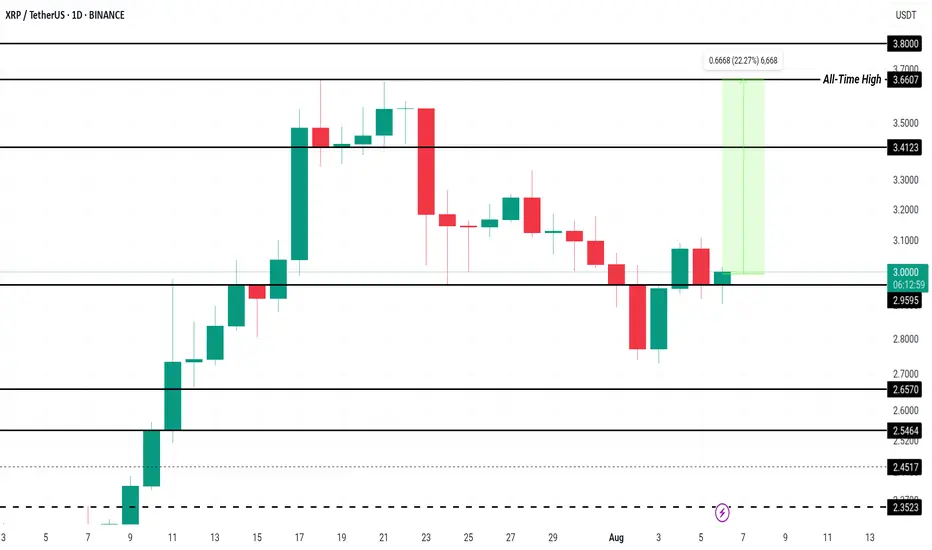
XRP Price Struggles as Key Holders’ Outflows Hit 7-Month HighBINANCE:XRPUSDT is currently priced at $2.99 , sitting just below the $2.95 resistance. The bearish market sentiment and outflows are evident, making it difficult for the altcoin to break through this resistance. A continuation of the current trend may lead to further downward pressure on the price.
BINANCE:XRPUSDT longer-term outlook is also influenced by its HODLer net position change, which has reached a seven-month low . The LTHs, who have a significant impact on the price of XRP, are seeing their positions decrease
BINANCE:XRPUSDT is likely to test the support of $2.65 in the coming days, unless investors shift their sentiment. If this support level fails to hold, XRP may experience further losses, putting additional strain on the altcoin and its investors.
To recover, BINANCE:XRPUSDT will need to reclaim $2.95 as support and break through the $3.00 mark . A successful breach of these levels could pave the way for a move towards $3.41, ultimately invalidating the current bearish outlook and offering hope for a potential recovery.
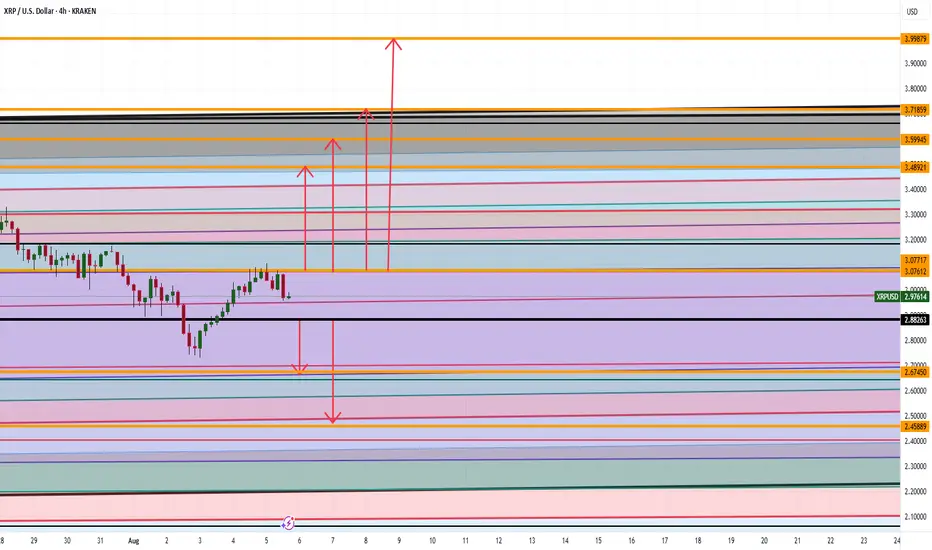
XRP ARE WE GOING TO $4 ANALYSIS Good afternoon
So looking at XRP we can spot a couple things :
Bullish Side: If we can break the high at 3.07 then 3.48,3.59,3.71, and 3.99 makes sense
Bearish Side: If we go below 2.88 then a drop down to 2.67 then 2.45 makes sense
Trade Smarter Live Better
Kris
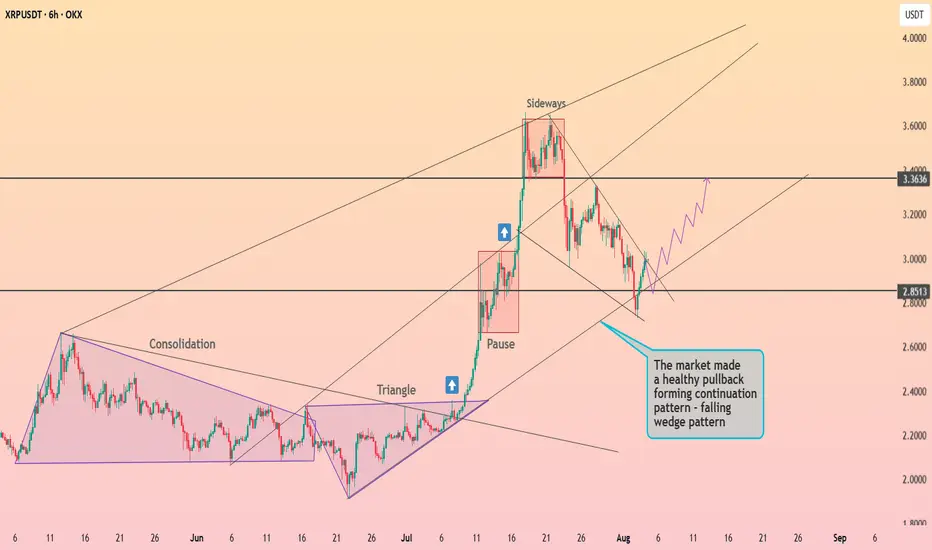
XRP is preparing to exit the wedge ┆ HolderStatOKX:XRPUSDT is forming a falling wedge after a sharp breakout and pullback. Price is stabilizing near $2.85, a key former resistance level. If bulls reclaim momentum here, a move toward $3.36 becomes a high-probability scenario.
ETH/USDT | ETH Under Pressure – Watch $3500 Support!By analyzing the Ethereum chart on the weekly timeframe, we can see that after reaching the $3940 zone, ETH faced selling pressure and is now trading around $3540. If the price fails to hold the key $3500 support, a deeper decline is likely, with potential targets at $3040 first and possibly $2680 as the second bearish target.
Please support me with your likes and comments to motivate me to share more analysis with you and share your opinion about the possible trend of this chart with me !
Best Regards , Arman Shaban

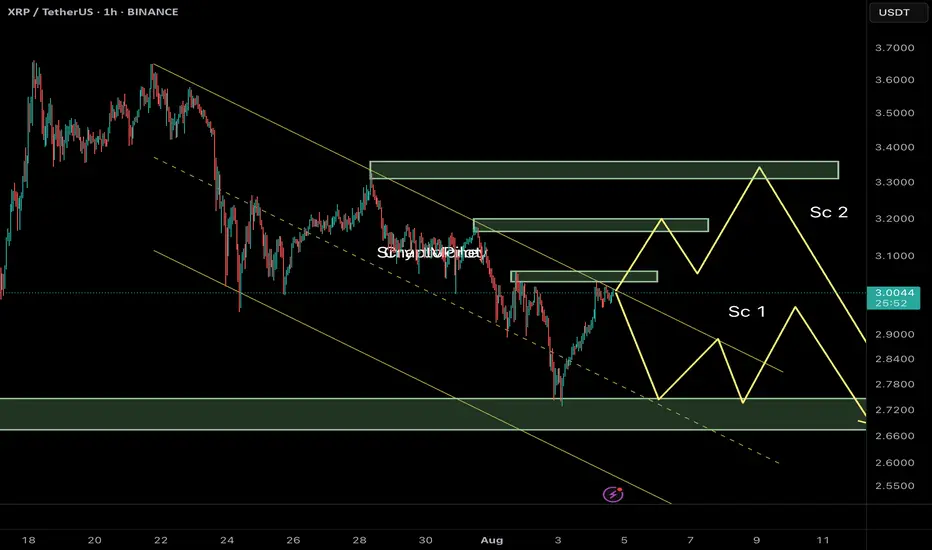
Ripple (XRP/USDT) Technical Analysis – 1H Timeframe🔰 Current Market Context:
After breaking below the ascending channel near $3.50, XRP has entered a corrective phase within a descending channel. Price is now hovering around a mid-range resistance zone, and we can outline two key potential scenarios from here:
⸻
📌 Scenario 1 (Sc1) – Immediate Rejection and Bearish Continuation
In this case:
• Price gets rejected from the current resistance zone ($3.05–$3.10).
• A quick corrective pattern (likely a Zigzag or Flat) plays out.
• XRP moves down to test the next demand zone near $2.70–$2.65, breaking below recent swing lows.
✅ This scenario aligns with the current weak structure and visible sell-side pressure. Liquidity above recent highs has likely been swept, creating a setup for continuation downward.
⸻
📌 Scenario 2 (Sc2) – Extended Correction with a Final Bull Trap
In this case:
• Price pushes higher toward a deeper resistance zone near $3.30–$3.40.
• A liquidity grab above the prior highs triggers a sharper reversal afterward.
• The overall structure could form a Diametric or Complex Correction, suggesting a deeper and more time-consuming wave before resuming the bearish trend.
⛔ This scenario requires strength and acceptance above $3.15, and should be treated as an alternative unless proven by price action.
⸻
🎯 Summary & Trade Strategy:
Scenario 1 is currently more probable unless we see a strong break and close above $3.10. Expectation: XRP may head toward the $2.70–$2.65 demand zone if resistance holds.
⚠️ Avoid entering early. Wait for confirmation via internal BOS (Break of Structure), bearish engulfing near OB zones, or signs of rejection with volume at resistance.
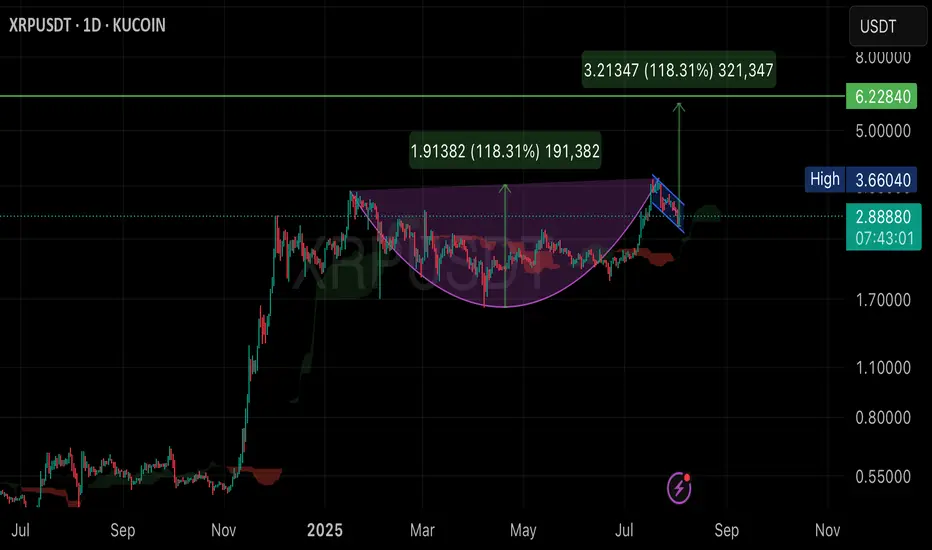
XRP doing Cup with handle pattern?technical analysis chart of the XRP/USDT using daily data (1D). Here are the main details:
• Cup and Handle Pattern: The chart displays a “cup and handle” formation, which is a bullish continuation pattern suggesting further upward movement. The rounded shape below represents the “cup” (running from roughly February to July 2025), and the small channel to the right is the “handle.”
• Target Price:
• The chart shows a projected breakout target from the handle region—from about 2.88 USDT to 6.22 USDT.
• The value 1.91382 (118.31%) is the measured move—calculated from the bottom of the cup to the neckline, then projected upwards from the breakout point.
• Another label, 3.21347 (118.31%), shows a similar projected percent gain (about 118.31%) from the breakout point.
• Support and Resistance Lines:
• Horizontal lines mark key levels, such as 3.66 (recent high) and 6.22 (target).
• Other Indicators:
• The chart uses a red moving average and Ichimoku cloud to highlight trend support and resistance zones.
• Current Status:
• The current price is 2.88881 USDT (up 4.30% on the day).
• A blue channel represents the consolidation phase before an anticipated breakout.
Summary:
This chart suggests that, if there’s a breakout from the “cup and handle” pattern as shown, the next target price for XRP is around 6.22 USDT, representing an estimated 118% gain from the breakout point. The analysis uses technical patterns and indicators to project possible future price movements.
Ripple XRP Bullish Reversal📈 CRYPTO:XRPUSD dropped in 3 swings vs June low, now in buy zone $2.78–$2.47. Marginal lows still possible, but bounce expected next week from this extreme area.
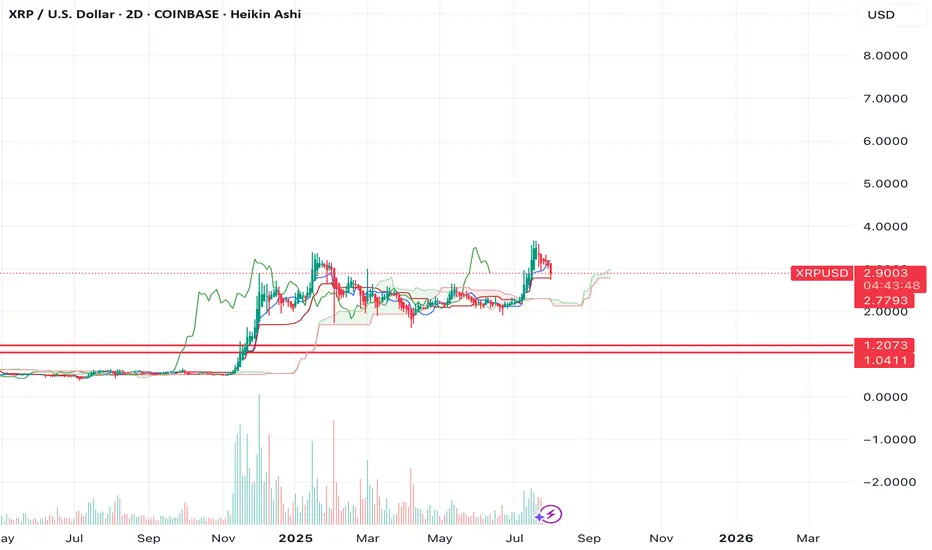
$XRP ENJOYERRRs see ya at $1.04-$1.20If we look at the chart of XRP, you can see that since the move in fall of 2024, we've had a massive lack of balance on the chart.
We ran up quickly without testing any levels as support.
That makes me think we're going to see the lack of balance get corrected and the same move is now going to happen in the opposite direction.
The $1.04-1.20 region looks like a good area of support to me.
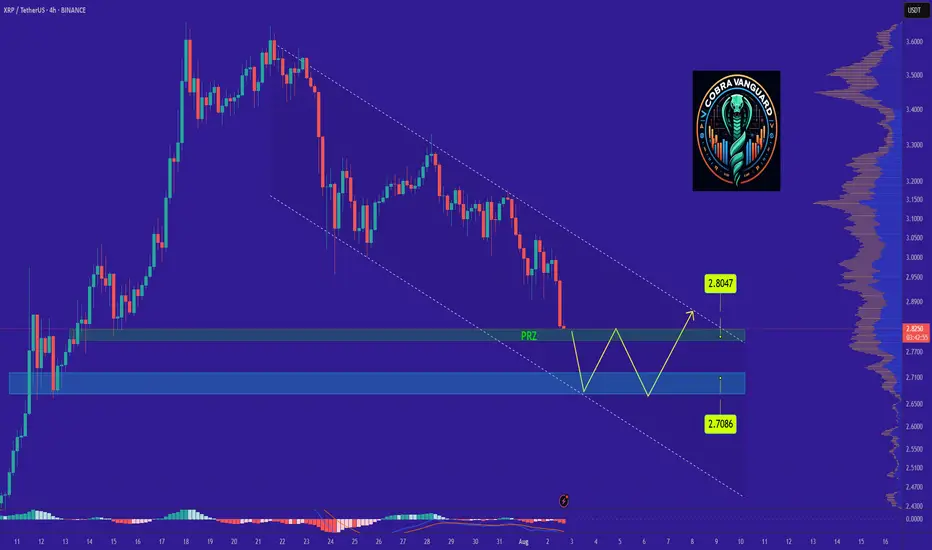
XRPs Situation (Daily) !!!If the price loses the PRZ range, it will drop to the bottom of the channel and then rise to the top of the ascending channel, which will take some time.
Best regards CobraVanguard.💚