XRP Ripple Technical Analysis and Trade IdeaXRP / Ripple has now broken market structure to the upside 📈🚀.
This is clearly visible on both the Daily and 4H timeframes 📊👀.
I’m now looking for a potential buy opportunity 🟢 if price pulls back into my optimal entry zone, as explained in the video 🎥📍.
As always, patience is key — I want price to come to my levels and confirm the setup 🧠✅.
⚠️ Not financial advice. Trade responsibly and manage risk at all times 💰🛡️.
Rippleanalysis

Ripple: Downtrend ContinuesRipple’s XRP has continued its downward trajectory, further developing the blue bearish structure we primarily anticipate. This move is expected to ultimately bring XRP into the green Target Zone between $1.03 and $0.38, where the larger turquoise wave B is projected to complete. We still assign a 30% probability to the alternative scenario in which turquoise wave alt.B has already finished. This alternative could be confirmed if XRP breaks above the resistance levels at $3.19 and $4.09.

XRP RoadMap (1D)Let's take a look at Ripple to see what fluctuations it may experience over the next month or two.
We considered the upward move in 2024 as Wave A, the following correction as Wave B, and the third rise as a terminal 5-wave structure.
The sharp downward move is considered a post-pattern terminal, and now the waves we are in are regarded as a bearish cycle, forming an expanding/diametric/symmetrical triangle.
Whatever the larger pattern is, in aggregation it seems that the price will move downward from the red zone to the short-term targets marked on the chart.
The targets are marked on the chart.
A daily candle closing above the invalidation level will invalidate this analysis
For risk management, please don't forget stop loss and capital management
When we reach the first target, save some profit and then change the stop to entry
Comment if you have any questions
Thank You

XRP Eyes $2.072 if Support BreaksFenzoFx—XRP is down 3.30% today, trading around $2.2330. Immediate support lies at $2.2230, backed by the anchored VWAP. So far, the price hasn’t closed below this level on the daily chart.
Technically, a close beneath VWAP could trigger further downside toward $2.072. If selling pressure continues, the next support is $1.922. The market outlook remains bearish while XRP trades below the descending trendline.

XRP Faces Bearish Gap PressureFenzoFx—Ripple (XRP) lost its bullish bias after dipping below $2.940 support, triggering a bearish fair value gap on the 4-hour chart. Selling pressure eased near $2.796 liquidity void, where volume dropped sharply—signaling reduced momentum and potential consolidation.
Technically, XRP/USD may consolidate toward $2.9570, the mean threshold of the bearish gap. If price holds below this level, a new downtrend could emerge, targeting the equal lows at $2.690. Please note that the bearish outlook remains valid unless XRP forms a new higher high.

XRP May Extend Bearish MomentumFenzoFx—XRP (Ripple) is in a bear market, trading around $2.847 after failing to hold above the bearish FVG resistance at $2.966. It dipped and tested lows at $2.699.0. The outlook remains bearish while XRP/USD trades below the fair value gap. If this level holds, price may break below $2.6990, with potential downside extending to $2.339 if selling pressure increases.
Please note, the bearish view is invalidated only if price closes and stabilizes above the $4,250.0 resistance.

XRP Forms Head and Shoulders At PremiumFenzoFx—Ripple (XRP) displaced above $2.900, confirming a bullish trend. It now trades around $2.978, filling a bearish fair value gap and forming a head and shoulders pattern. On the 4-hour chart, equal lows at $2.934 and a liquidity void at $2.912 suggest a potential downside move.
Please note that $2.912 remains in the premium zone, however, it could trigger a bullish wave targeting $3.037. A break below $2.912 may extend the decline toward the fair value gap at $2.837. Traders should monitor these levels closely for bullish setups.

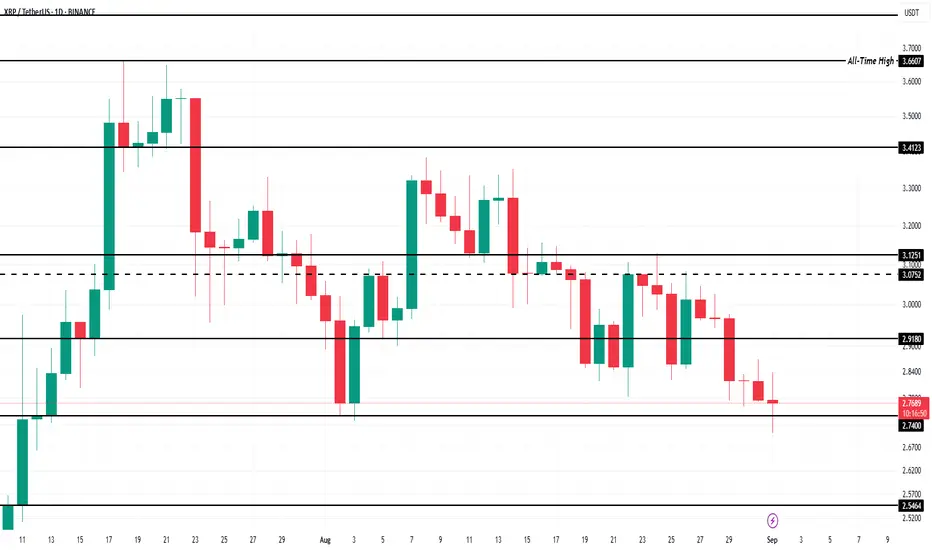
XRP Could Hit All-Time High In September 2025BINANCE:XRPUSDT is trading at $2.81 , maintaining support above $2.74 at the time of writing. The altcoin’s ability to move toward its all-time high depends heavily on investor sentiment. Market participation will play a decisive role in whether XRP sustains momentum or faces pressure from renewed selling activity.
The Ichimoku Cloud indicates bullish momentum could be developing, offering a potential boost for BINANCE:XRPUSDT . This technical signal suggests favorable conditions for upward price action. If sustained, the altcoin may climb 29.8% to retest its all-time high of $3.66, a level that has remained unbroken since previous market cycles.
If investors remain cautious, BINANCE:XRPUSDT may struggle to hold its current position. A break below $2.74 would expose the token to additional losses. Continued selling pressure could push the price down to $2.54 , weakening support levels and invalidating the bullish outlook that is currently forming for XRP.
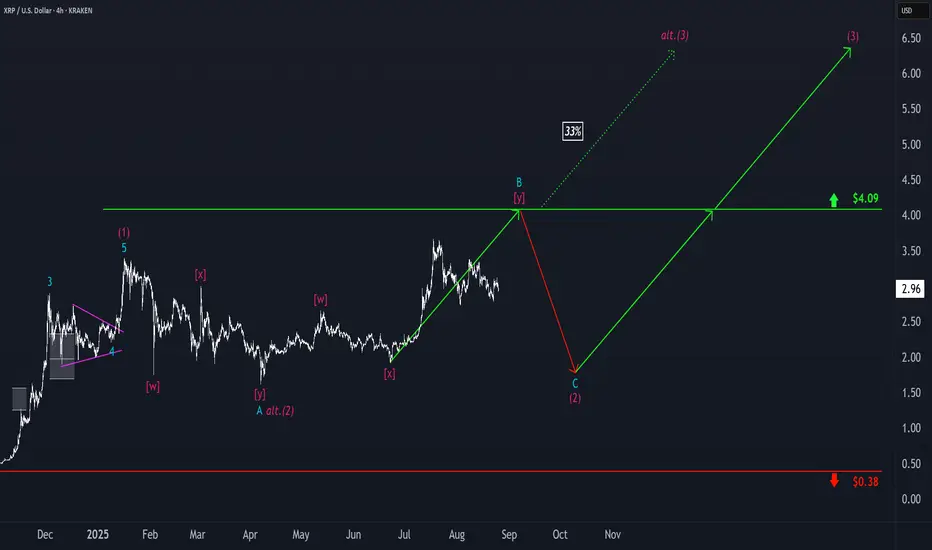
Ripple: Corrective RallyUnder our primary scenario, we place Ripple’s XRP in a corrective rally, which should ideally conclude near resistance at $4.09, marking the peak of turquoise wave B. After this high, we anticipate a wave-C pullback, which should bottom out well above support at $0.38 – and establish the low of the larger magenta wave (2). Looking ahead, magenta wave (3) should then drive a sustained move above the $4.09 threshold. Be this as it may, if the altcoin surpasses this resistance level in the current leg, that will indicate that wave alt.(2) has already completed (probability: 33%). In that scenario, we would expect a direct breakout.
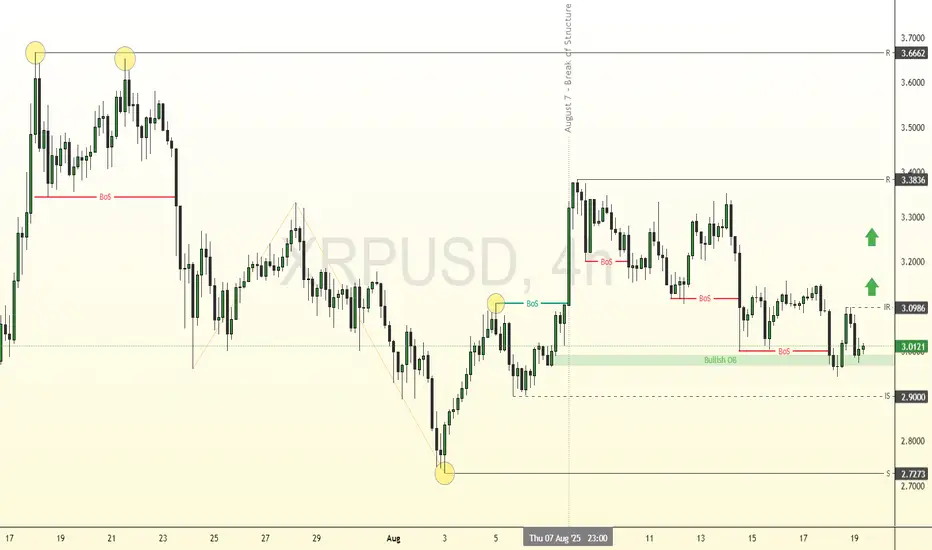
XRP: Key Support at $2.72 Holds Bullish OutlookFenzoFx—XRP (Ripple) broke its bearish structure with a strong engulfing pattern on August 7 and is now consolidating near $3.00. This level is supported by a bullish order block, with immediate support at $2.90.
The 4-hour chart shows equal highs at $3.66, marking a liquidity target. Immediate resistance lies at $3.09, and a close above this level could resume the uptrend.
XRP Holds Support: Eyes Break Above $3.31FenzoFx—XRP (Ripple) holds above the fair value gap (FVG), with key support at $3.11. Technically, the uptrend may resume if XRP closes and stabilizes above $3.31, supported by a bullish FVG on lower time frames like M10 or M15.
If this scenario unfolds, the next bullish target is the order block with highs at $3.56.

XRP: Support at $2.960 Holds the Bullish SetupFenzoFx—XRP dipped from $3.666 but stabilized near the monthly anchored VWAP at $2.960. It now trades at $3.142 above the ascending trendline.
Immediate resistance lies at $3.332, aligned with the descending trendline. A close above this level may propel XRP to $3.432. Strong buying could extend gains to the recent high of $3.666.
The bullish outlook stands while XRP/USD holds above key support at $2.960. A drop below this level would invalidate the bullish scenario.

XRP Confronts Daily SMA ResistanceFenzoFx—XRP remains bearish, trading below the 50-period daily SMA at around $3.18. The SMA acts as resistance. Immediate support lies at $2.96. A break below this level may trigger further downside toward the $2.66 demand zone.
On the upside, a close and stabilization above $3.27 would invalidate the bearish outlook. In that case, momentum could push prices toward the previous highs at $3.65.

XRP/USD Chart Hack – Rob the Market Before the Bears Do🏴☠️💸 XRP/USD Crypto Market Heist Plan: Thief Trader Style 💰📈
"Break the Vault, Rob the Trend – One Candle at a Time!"
🌍 Hi! Hola! Ola! Bonjour! Hallo! Marhaba! 🌍
To all fellow money makers, day robbers & chart thieves... welcome to the vault!
We’re diving into the XRP/USD (Ripple vs. U.S. Dollar) with a bold Thief Trading™ Strategy, blending technical mastery and market intuition.
📊 THE PLAN: Rob the Resistance – Swipe the Highs
🔥 Based on Thief Trading-style TA & FA combo, here's the master heist setup:
Long Bias ⚔️
Target: The High Voltage Resistance Zone
Status: Overbought + Trap Level = High Risk, High Reward
Market Mood: Bullish but risky – consolidation & reversal zones ahead
Crowd Behavior: Bearish robbers strong above, but we strike below
🧠 Thief Wisdom:
“The vault's open, but not every vault is unguarded. Wait, plan, attack with strategy.”
📥 ENTRY PLAN
The Heist Begins at the Pullback...
Use Buy Limit Orders (Thief Style: DCA / Layering)
Entry Zones: Near recent swing lows or within 15–30 min pullbacks
Let the price come to your trap – precision is our weapon
🛡️ STOP LOSS STRATEGY
Guard Your Loot – Always Secure Your Exit
SL Example: 2.8500 (3H TF swing low)
Customize SL based on:
⚖️ Your lot size
🎯 Risk tolerance
🔁 Number of entry layers
Remember: We don’t chase losses – we protect capital like it's gold
🎯 TARGET
Final Take-Profit: 4.0000
But hey… Thieves escape before alarms ring!
💡 If momentum slows, don’t be greedy. Exit smart, exit rich.
📡 FUNDAMENTAL + SENTIMENTAL OVERVIEW
The bullish bias is supported by:
📰 Macro Events
📊 On-Chain Signals
📈 COT Reports
🔗 Intermarket Correlations
📢 Sentiment Analysis
👉 Stay updated with the latest data — knowledge is the thief’s ultimate tool.
⚠️ TRADING ALERT – News Can Wreck the Heist
To survive news spikes:
🚫 Avoid entries during high-impact releases
📉 Use trailing SL to protect your open profits
🛑 Adjust exposure during uncertain volatility
❤️ SUPPORT THE CREW – BOOST THE PLAN
If this plan added value, hit the 🔥BOOST🔥 button.
It helps grow the Thief Trading Team, and together we rob smarter, not harder.
💬 Drop your feedback, thoughts, or charts below – let’s build the crew!
💎 Every candle tells a story. We don’t follow the trend – we rob it.
💣 Stay alert, stay rogue, and I’ll see you at the next market heist.
💰 Until then… chart smart, trade savage. 🐱👤💵

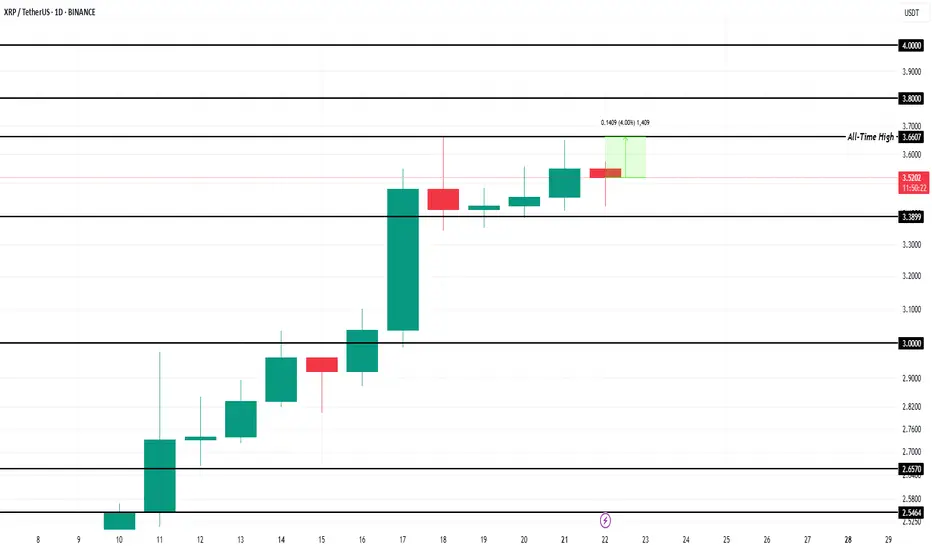
XRP Price Reversal Likely After $2.81 Billion Selling In 7 DaysBINANCE:XRPUSDT is currently trading at $3.48, only 4% away from its all-time high . Over the past week, exchange wallets saw an influx of nearly 450 million XRP, valued at more than $2.81 billion . This spike in supply indicates that holders are moving their assets to sell, usually a bearish indicator in market cycles.
Despite the proximity, BINANCE:XRPUSDT price is showing signs of weakness and is clinging to the $3.38 support level . Without renewed buying interest, this support may not hold much longer.
If investor selling continues, BINANCE:XRPUSDT could fall through $3.38 and test the $3.00 support . A drop to this level would erase the recent gains and confirm a near-term bearish reversal. The loss of $3.00 could signal a longer consolidation phase or deeper correction.
However, if market participants absorb the sold supply and restore demand, BINANCE:XRPUSDT could rebound quickly . In this scenario, the altcoin might surpass $3.66, breach $3.80, and aim for $4.00 . Such a move would invalidate the bearish outlook and set a new all-time high.
XRP: Order Block at $3.40 Could Cap The RallyFenzoFx—Ripple's bullish momentum resumed nonstop, offering no clear pullback for entry. Currently, XRP is testing resistance at $3.40 within an order block. Momentum indicators remain in overbought territory, signaling short-term overpricing.
Volume profile shows limited resistance at present levels, suggesting a likely retest of $3.40. If this resistance holds, a pullback toward support around $3.00 is expected. This level can provide a discount to join the bull market.

XRP Cools Near $3.00 Amid Overbought SignalsFenzoFx—XRP remains bullish after piercing $3.00 earlier this week but cooled near resistance. Trading around $2.90, Stochastic (~84) and RSI 14 (80) indicate overbought conditions, suggesting consolidation.
We anticipate a pullback toward $2.66 support before resuming the uptrend. Alternatively, a decisive break above $3.00 would target $3.21 next.

XRP/USDT Monthly Chart: History Repeating Itself?Hey traders! Let’s dive into this monthly XRP/USDT chart. I’ll be honest — I’m skeptical about this outcome, but let’s break it down because it could actually happen!
The chart screams déjà vu, with XRP’s price action mirroring the 2014-2018 period. Back then, XRP broke out from its 2014 ATH in 2017, leading to a massive rally. Fast forward to now, and we’re seeing a similar setup, but with a twist. XRP is struggling to break through the 2018 ATH resistance zone around $3.31, which reminds me of the Breakout Consolidation phase we saw in 2017. Historically, this consolidation led to a breakout, and the chart hints at a potential repeat!
If XRP breaks out soon, we could see a parabolic move, potentially targeting much higher levels. However, the current resistance is a tough hurdle, and if it fails, we might see a pullback to lower supports.
Key Levels to Watch:
Resistance: $3.31 (2018 ATH)
Support: $1.643 (previous consolidation low)
Breakout Target: To be determined (potentially parabolic)
Breakdown Risk: $0.650
I’m not fully convinced, but the setup is intriguing — could this be XRP’s moment to shine? What do you think? Let’s discuss below!

XRP Pushes Toward Breakout as Momentum BuildsFenzoFx—XRP is bullish, attempting a breakout above the $2.34 resistance. Stochastic at 70.0 and RSI at 63.0 signal strong momentum with room for further upside.
A close above $2.34 could push XRP/USD toward the next target at $2.48. However, the bullish bias remains valid only above the $2.16 support—dropping below this level could reverse the trend.

XRP: Break Above $2.338 Opens Path to $2.480FenzoFx—Ripple (XRP) eased near weekly highs of $2.338, with Stochastic and RSI 14 signaling overbought conditions. The trend stays bullish above the anchored VWAP or $2.165, but consolidation toward $2.2240 is expected before resuming.
A break above $2.338 would target the next supply zone at $2.480.

Ripple Consolidates with Bullish Bias IntactXRP was rejected at the previous week’s high of $2.34 and is currently testing support at $2.22. As long as it holds above $2.16 or the 50-SMA, the bullish trend remains valid, with $2.34 likely to be retested.
On the flip side, a close below $2.16 could trigger a decline toward $2.07.

Bearish Setup Forms for XRP Below $2.21FenzoFx—XRP trades around $2.18 after forming a long-wick bearish candlestick above $2.17 support.
Stochastic reads 83.0, indicating overbought conditions. A close below $2.16 with a bearish engulfing candle could lead to $2.08. A close above $2.21 would invalidate the bearish outlook and open the door to $2.33.

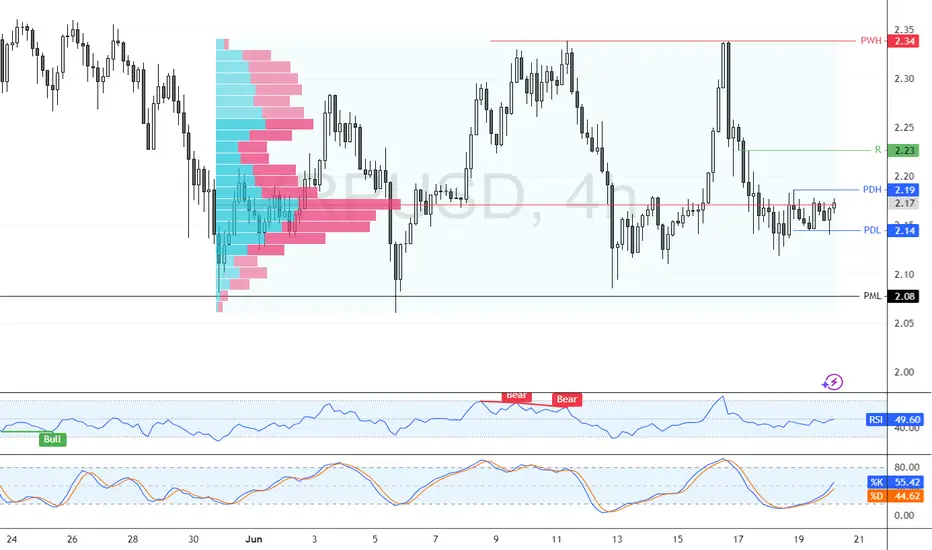
XRP Builds Bullish Outlook as $2.08 Support Holds StrongFenzoFx—XRP bounced from $2.14 and trades near $2.17, approaching resistance at $2.19. The market remains bullish above the $2.08 critical support. A close above $2.19 could lead to targets at $2.23 and $2.24.
The bullish outlook is invalidated if XRP/USD closes below $2.08.