Ripple (XRP) Needs This Break Out Then Next Destination Is $5Falling wedge:
The price action of Ripple is moving in a falling wedge pattern since August 2018. Recently after the strong bearish trend in the month of March 2020 the priceline of XRP again has hit at the support of this falling wedge pattern. Here I was waiting for two indicators to give bullish signals. One from stochastic to give bull cross and second for the momentum indicator to turn weak bearish from strong bearish after these two signals I was expecting that the priceline will again move up to make another attempt to break out the resistance of this falling wedge pattern.
Finally on 6th of April the stochastic gave bull cross and on 27th of April the momentum indicator turned weak bearish from strong bearish and then the priceline of Ripple turned bullish and sofar it has reached almost at the half of the wedge pattern.
Here we can observe one more thing that the relative strength index (RSI) indicator 1st went in oversold in January 2020 and in the month of March it went again very close to the oversold zone and now it has turned bullish. And if we see the priceaction of XRP then it can be easily seen that the priceline has also formed a double bottom as well that is another very powerful bullish sign.
Indicators are turning bullish:
falling wedge:
Volume profile and Bollinger bands are giving bearish signals:
If we see the two more signals on this weekly chart then the situation is little bit disappointed. If we see the volume profile of the complete price action moving within the pattern then it can be easily witnessed that the trader’s interest is very weak below $0.17. And if we move up then we find that the interest of the traders is very low above $0.33, this is almost the same level where we have the resistance of the falling wedge pattern. Therefore in order to have a break out from the wedge we need the interest of the traders should be developed above the level of resistance, moreover if we see the Bollinger bands then it can be easily observed that the upper band of Bollinger bands is below the resistance of this falling wedge pattern. Therefore it can play a role of resistance or hurdle for the priceline that can stop the XRP to break out the resistan. Therefore in order to achieve a successful breakout from this pattern we need the Bollinger bands to move above the resistance of Wedge. However if exceptional we will have a powerful buying volume then the Ripple can ignore these signals and breakout the resistance.
Simple moving averages and bearish signal on daily chart:
Now if we switch to the short-term daily chart and place simple moving averages with the time period of 25, 50,100, and 200 then we can see that since 14 March to 29th of April the priceline was moving up with a strong bullish rally and first the price action broke out the 25 SMA after that priceline faced a little bit resistance but finally broke out the 50 simple moving average. And during this the we can also watch the golden cross formation between 25 and 50 simple moving averages. Then on 29th of April the price action of Ripple broke out the 100 SMA but since then the price action is not able to break out the 200 simple moving average. And it is being consolidated between 100 and 200 simple moving averages. And now there is bearish signal appeared and that is on 30th April a powerful bearish engulfing candlestick is appeared that is a bearish signal. This candlestick has completely in engulfed the bullish candlestick of 29th April. Therefore in order to break out the 200 simple moving average we need another powerful bullish engulfing candlestick that should engulf the bearish engulfing candlestick of 30th April or at least it should be equal to this bearish candlestick. Then this bearish candlestick will be cancelled. But unfortunately sofar after that bearish engulfing candlestick we have a two weak bullish candle sticks and and today we can see a weak bearish candlestick as well.
Up channel:
On the same daily chart the priceline of Ripple is moving within an up channel since 17th of March. At this time the price action has reached at the resistance of this channel but could not break out this resistance even after powerful bullish candlesticks with long spikes and now we have few weak bullish candles moving sideways. Here I am watching for two more indicators one is stochastic indicator another one is the momentum indicator.The stochastic indicator has already visited the overbought zone and it has given bear cross. Now if with this bear cross of stochastic indicator the momentum will be turned weak bearish from strong bearish then we can expect that the priceline may re-test the support of this channel and that is at $0.20. I am not expecting as that much powerful bearish move that the priceline would re-test the support of the falling wedge that has been formed on the long term weekly chart. Therefore after retesting the support of this channel the priceline may again move up to make another attempt to break out the resistance of this channel.
Up channel:
Stochastic and momentum:
Key level resistance at $0.31:
Now I would like to discuss a major key level resistance and support level for the priceline of Ripple. And that strong resistance and support level is at $0.31. If we seen on the chat then we can easily observe that since the XRP born this $0.31 has been very powerfull resistance and support level in the history of XRP. First we can see that it has been working as a strong resistance from May 2017 to December 2017. But once this resistance was broken in December 2017 then within one month upto January 2018 price action started very powerful bullish rally that produced more than 1476% gains. And reached more than $3. Then from January 2018 to August 2019 it has been working as a a strong support for the priceline but once in August 2019 this support has been broken down since then priceline could not breakout this resistance again. Therefore we can expect that once this resistance will be broken out then it can repeat the same move of Dec 2017 to Jan 2018 and produce more powerful bullish rally than bullish rally of 2017 to 2018. And this powerful bullish divergence can lead the XRP to reach $5 that will be all time high price.
Conclusion:
On short term the Ripple is giving bearish signals therefore we can expect bearish rally on the daily chart but on the long term the XRP is bullish and once the key level resistance of $0.31 will be broken out then XRP can achieve the all time high price.
Note: This idea is education purpose only and not intended to be investment advice, please seek a duly licensed professional and do you own research before any investment.
Ripplebreakout

XRP/USD (PAX) -- WEEKLYKey levels for weekly chart.
Note consistent high trading volume.
Volatility is presumed -- fall (~45.5%) before rise.
Investment Strategy short by ~45.5%, followed by long at presumed floor value.
Review XRP/BTC to observe the floor value.

XRP Small scythe - HourlyA scythe has formed on the hourly chart for XRP
This is a bullish continuation pattern
here is my idea on the scythe pattern
enjoy and gl

XRP HourlyHourly chart for XRP
Ascending scallop can be seen a bullish continuation pattern
And a falling wedge can be seen another bullish pattern
Looking for another impulse wave upwards

XRP Army Pathway To HeavenCan XRP pull off another 25,000% increase? Perhaps not given the Total Market Cap it would require. Although it does seem that global central banks, the IMF, and other major Financial Institutions are referencing XRP quite a lot lately. $50 XRP? Time will tell.

XRP Shows Strong Moving Average CrossoverThe tinken-san and kijun-san moving average lines used in the Ichimoku indicator have just made an instant re-cross to the upside, suggesting a possible bull rally due short-term for XRP.

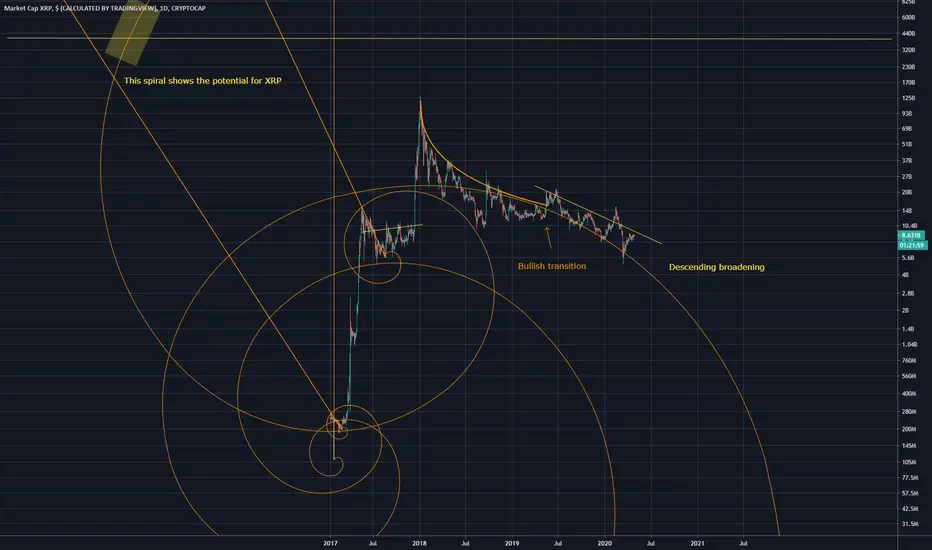
XRP cap spiralsXRP has formed a descending broadening wedge
included spirals showing the possible market cap futures highlighted in yellow rectangle
Mainly made this to show some harmonic patterns, Descending broadening wedge and the ascending wedge
Im long on this project
Quick look at where XRPUSD stands early MondayHello guys,
The XRPUSD pair could not find its direction during the weekend after moving above the 50-day EMA and the downtrend line on Thursday and Friday. The major altcoin climbed up to $0.195 on Saturday, but could not continue with its good performance on the last day of the week and formed a similar candle, but in the opposite direction. The XRP ended the last seven days at $0.188, remaining flat for the period.
For the moment the price is responding pretty well to the support levels. As you can see on the provided chart, we are following our plan of action with no major obstacles for the moment.
The next target up is naturally the $0.20-$0.215 zone, which already proofed to be quite a strong resistance earlier this month.
Down we need to avoid a drop below the 50-day EMA and the $0.18 mark. It is very likely to see a re-test of that zone though.
The RSI is not ideal and we are struggling to move above the downtrend line. Volumes remain stable in the $1.9-$2.0 billion area since Friday.
I cannot see anything interesting on the 1h chart for the moment - bulls are finding support at $0.19, but could not get passed $0.195 for a second consecutive time in the last 10 days.
I'm overall bullish, at least in the short to mid-term and up to $0.23. In the long-term, we are still in a serious downtrend since July 2019.
Cheers,

Potential for uptrend breakout for XRPUSDif it crosses 0.20$ with <200M volume there is potential to reach 0.24$ during the next 2 weeks. Stop loss at 0.17$

Long term Looking 2017 Year Price 3$ Short Term 0.50$ =Next BullAll Eyes On Bitcoin
XRP pointing to the $0.2£ price point as a potential target for a long 0.26 and more upside Resistance 0.3250, 0.3812 and 0.44$ to 0.50$
The technical building a bullish case for XRP, the altcoin’s price action is largely dependent on that of Bitcoin, as the market leader’s directionality dictates the overall trend of the crypto industry.
Wait for Next BITCOIN BULL RUN, BTC 7400$ break can go bitcoin 10k and 12k$ That bull run can drive XRP back 0.50$ with correction.
🛑SUPPORT/RESISTANCE
✅S1= 0.15$
✅S2=0.12$
✴️R1=0.26$
✴️R2=0.34$
✴️R3= 0.44
Please like, share, comments and follow me to get daily base analysis
Thank you for your support, I appreciate it.

Where your moon boots at?Nah just kidding I'm not a moon boy nor am I negative about XRP. I do hold it because there is real potential and its ultimate goal is fairly simple and it is also useful...which some major banks and organisations are patterned with ripple. It amazes me that other cryptos out there are trading a lot higher than XRP that don't actually hold much value or their goal is not actually widely beneficial.
DYOR - these are bottom prices for some cryptos and i'm more than willing to buy them. XRP has not "mooned" or exploded yet because there isn't a demand. Once the supply drys up then the demand follows and that's where price climbs and yes I know there is lots of xrp that gets released from escrow every so often.
Looking at this chart though its just asking to rocket...there was a tweet floating around that said the market cap is way off for xrp and over 70% has already been bought which did look legit? again dyor.
If ripple did an IPO then I would look to sell some xrp and buy the IPO.

XRPBTC BULLPEN OPEN!!No oped on this one -- figured I'd keep it short & sweet. Head & Shoulders indicator coupled with massive volume surge led me to dig futher.
Green Horizontals represent TP1-3 with TP3 a midterm sweep.
Red horizontal worst-case stop.
Markt VOLATILITY: HIGH
Keeping this publication NEUTRAL as next move is contingent on BTC price volatility.
Risk/Reward: 25/75
BB / KC / VOL / Sqz & RSI all seem to bolster this bullish breakout (long overdue IMHO) as XRPBTC has been looming around trading sideways since the middle of last quarter.
Peace & Love all
@A1mtarabichi

Wedges anyone? Pt.2 XRPXRP has formed a descending broadening wedge
This is very bullish when assigned to a daily chart
Is the long shake over?
Target upon breakout would be the top of the fib spiral, it can also be seen that the resistance of the fib spiral has been broken, creating new possibilities for a breakout
My previous idea showing an ascending scallop which is bullish after a pullback
And the MA bounce that will most likely occur on XRP

RippleSymbol: XRPBTC
Ready to see how this closes on the 13th for a weekly close. I'm liking the potential of these signals. Curious to see how alts play with this btc sell off.
----------------------------------------------------
Want to level up your trading skills?
We just realesed our new course! Follow our tradingview page and visit the link in our bio if you are looking for new strategy to add to your arsenal.
Also checkout our trading indicator available in the link on our page.
---------------------------------------------------
Thank you for your continued support, God bless.
- Major League Trader

XRP 3's Intradayexpecting a third bounce off the middle of this slight upward trendline on XRPUSD, I recommend for people actually looking for entry to 'go long' on this rather than margin trading however. I am just doing this for fun to see where the price goes :)

XRPBTC forming bullish Butterfly | Upto 55% move expectedHi friends, hope you are well. In my previous post on Ripple with Bitcoin pair we have seen that the XRP had completed the formation of bullish BAT pattern. This chart was based on midterm 2 days time period and as per Fibonacci sequence of BAT I predicted that the price action should move up from the potential reversal zone of this pattern to enter in the Fibonacci projection area of A to D leg from 0.382 to 0.786 Fib projection level.
Then we have seen that the price action moved up and entered in the target sell zone and produced more than 38% profit.
A new harmonic Butterfly pattern:
This time again on 4 day chart XRP is forming another harmonic bullish Butterfly pattern and soon it will be entered in potential reversal zone to give another chance to earn more gains.
Let’s dig the pattern deeper to see how perfect it has been formed.
After initial leg (X to A) the A to B leg is retraced between 0.618 to 0.786 Fibonacci and then B to C leg is projected between 0.328 to 0.886 Fib of A to B Fibonacci projection area now the last leg (C to D) should be retraced between 1.27 to 1.618 Fibonacci level.
Buying And Sell Targets:
The buying and sell targets according to harmonic Butterfly pattern and its Fibonacci sequence should be:
Buy between: 0.00002272 to 0.00001974 sats
Sell between: 0.00002502 to 0.00003060 sats
So this midterm trade has capacity to produce upto 55% profit.
Stop Loss:
The potential reversal zone area that is up to 0.00001974 sats can be used as stop loss in case of complete candle stick opens and closes below this level.
Note: This idea is education purpose only and not intended to be investment advise, please seek a duly licensed professional and do you own research before any investment.

XRPXRPUSD showing positive momentum through a falling wedge, also within a descending broadening wedge which is a bullish reversal pattern. Another falling wedge is present above the one price is currently trading within. Is this simply a big shake? Fractal composite ribbon can be seen to show signs of an inverse H&S (let me know if im using this wrong, I've never used it before, always room to learn). Calling bottoms is difficult prob impossible, and shouldn't be done, but XRP is setting up a very 'hidden' bullish setup with these wedges it has formed. Best to go long like me :)

XRP/USD - to break the downtrend line? Preconditions:
Downward trend line
Small bars are appropriate
Raising lows
On the junior timeframes an upward trend has been created locally
Friends, thanks for your likes and comments!
Good luck with trading!

XRPBTC formed bullish BAT pattern for another bullish moveHi folks hope you are doing good, in my previous idea of Ripple with Bitcoin pair we have seen that the XRP had formed a complete bullish BAT pattern and on 2 day chart. The formation of that pattern was started on 6th September 2019 and completed in December 2019 and we have seen that on 2nd Feb 2020 the price action moved up with the powerful divergence and produced more than 32% profit.
Another bullish BAT pattern has been formed:
This time on 12 hour chart after successful formation of previous bullish BAT pattern the Ripple with Bitcoin pair has formed another bullish BAT pattern and entered in potential reversal zone and ready to move up at any time.
Let’s dig the pattern deeper to see how perfect it has been formed.
After initial leg (X to A) the A to B leg is retraced between 0.382 to 0.50 Fibonacci and then B to C leg is projected between 0.328 to 0.886 Fib of A to B Fibonacci projection area and last leg (C to D) is retraced between 0.786 to 0.886 Fibonacci and now entered in potential reversal zone.
Buying And Sell Targets:
The buying and sell targets according to harmonic BAT pattern should be:
Buy between: 0.00002573 to 0.00002519 sats
Sell betweeen: 0.00002703 to 0.00002896 sats
So this short term trade can produce upto 14% profit.
Stop Loss:
The potential reversal zone area that is up to to $0.00002519 can be used as stop loss in case of complete candle stick opens and closes below this level.
Note: This idea is education purpose only and not intended to be investment advise, please seek a duly licensed professional and do you own reaserch before any investment.

XRP BullflagXRP has formed a bullflag, this follows in conjunction with my xrpusd trend reset idea that i made a month or so ago, i will link. Possible upsides include the poo fib EMA possibly could even go higher looks like a pretty agressive bullflag.

XRP resistance turned supportThis can also be observed on the XRP market cap, personally i believe xrp is poised for a breakout, following a formation of an inverse H&S. Looks very good.

Could this be the Ripple Effect - Soon Stratosphere Launch?Nothing is stronger than an idea whose time has come! Even if it seems like an April Fool's joke :)
An Inverse Head and Shoulders can play itself out in March and go into the stratosphere in April!

XRP Falling WedgeXRP has formed a kind of 'hidden' falling wedge within its current structure. A classic example of a bullish divergence can also be observed supporting the falling wedges bullish nature.
