ARDX – Double Rising Window Hints Bullish ContinuationARDX – CURRENT PRICE : 6.06
The stock has broken above its long-term downtrend line accompanied by strong volume (look at red arrow). This breakout was confirmed by the formation of a Rising Window (1), signaling the end of the previous bearish phase.
Another Rising Window (2) appeared recently, again on high trading volume, reinforcing bullish sentiment and indicating the likelihood of a continuation in the uptrend. Take note also that the RSI has climbed into bullish territory (above 50), suggesting a shift in momentum towards buyers’ control and further room for upside before reaching overbought conditions.
ENTRY PRICE : 5.80 - 6.10
FIRST TARGET : 7.00
SECOND TARGET : 8.00
SUPPORT : 5.11 (bottom of the Rising Window area)
Risingwindow

PATH - Go in the direction of the WINDOW!PATH - CURRENT PRICE : 17.14
The Japanese Candlestick theory refer to what we call in the West a gap as a window. Whereas the Western expression is "filling in the gap," the Japanese would say, "closing the window."
A rising window is a bullish signal. There is a price vacuum between the prior session's high (that is, the top of the upper shadow) and the current session's low. It is said by Japanese technicians to "go in the direction of the window." This is because windows are continuation signals. Consequently, with the emergence of a rising window, one should look to buy on dips.
PATH has formed three rising windows (gaps upward) in just two weeks that remain unfilled. This pattern suggests strong demand and sustained bullish momentum. Each window shows that buyers overcame sellers before the prior candle closed, reinforcing confidence in the trend.
Furthermore, a Golden Cross has formed for the first time in a long period (look at blue circle), where the 50-day EMA has crossed above the 200-day EMA — a classic long-term bullish confirmation. Notably, the last occurrence of this pattern was in November 2023, making this the first reappearance in over two years, further reinforcing its significance as a potential turning point in market sentiment.
For short-term target is 20.00 and 24.00. For position trader that holds for several months may target around 30.00. Investors holding for approximately one year, the target is 50.00.
ENTRY PRICE : 16.80 - 17.20
FIRST TARGET : 20.00
SECOND TARGET : 24.00
SUPPORT : 14.77 (the low of 08 Oct 2025 candle) - cutloss if price close below support level on closing basis.

PEGA - New 52-Week High, Next Stop All-Time High?PEGA - CURRENT PRICE : 66.27
PEGA has shown strong bullish momentum after breaking above its 52-week high resistance at USD 61.00. The breakout was followed by a successful retest, confirming strong buying interest and trend continuation.
RSI (45) remains steady above the 50 level, indicating a healthy and sustained uptrend with no signs of overbought pressure yet. Take note also that there is a rising support line - indicating demand is getting higher. If momentum continues, the stock has potential to retest its all-time high at around USD 74.40, representing strong upside potential. The stock’s immediate support lies at USD 57.66, aligning with the gap zone (rising window) formed earlier, which is expected to serve as a strong support area.
ENTRY PRICE : 64.00 - 67.00
FIRST TARGET : 74.30 (slightly below actual all time high resistance)
SECOND TARGET : 80.00
SUPPORT : 57.66

TWLO - Downtrend line BROKEN!TWLO - CURRENT PRICE : 134.88
The chart shared here is the weekly chart, where TWLO broke above its downtrend line with strong volume — a signal of growing bullish momentum. On the daily chart, TWLO formed a rising window (gap-up) last Friday — a bullish signal that often indicates strong buying momentum and potential continuation of the uptrend.
From a pattern analysis perspective, some traders may interpret the current setup as a bullish symmetrical triangle, indicating potential continuation to the upside. Next target will be 154.00 and 174.00. Support level is 114.73 (the low of window area based on daily chart).
ENTRY PRICE : 132.00 - 135.00
FIRST TARGET : 154.00
SECOND TARGET : 174.00
SUPPORT : 114.73 (CUTLOSS below this level on closing basis)

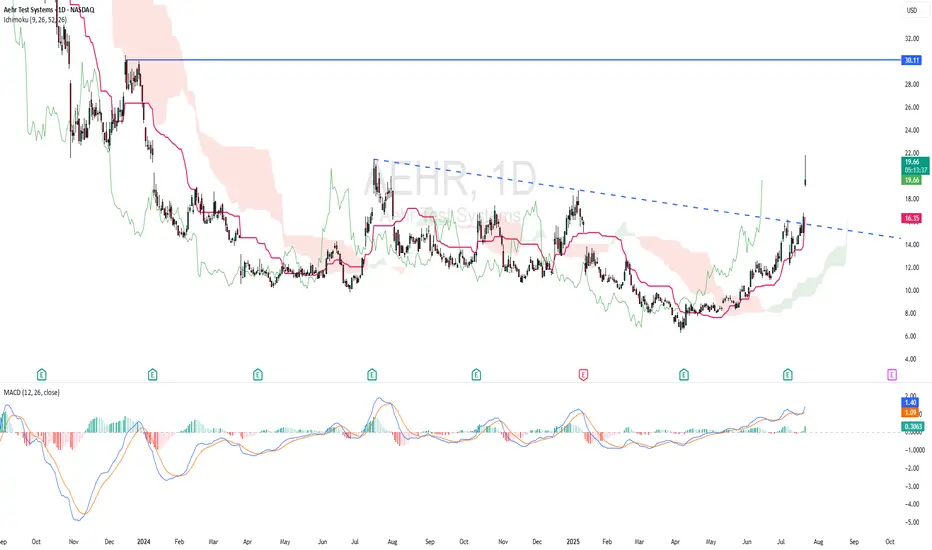
AEHR - RISING WINDOWTechnically AEHR is bullish as the stock made a strong rising window. Based on ICHIMOKU CLOUD, price is above cloud and chikou span is above candlestick - indicating bullish scenario. Kijun Sen is rising. MACD indicator showing bullish momentum.
ENTRY PRICE : 19.30 - 19.70
TARGET : 30.00 (potential almost 50% roi)
SUPPORT : 14.72
IREN - BULLISH RISING WINDOW at ALL TIME HIGH ZONEIREN - CURRENT PRICE : 27.00 - 28.00
The stock is bullish as the share price is above 50-day SMA. This bullish scenario is strengthened by the rising support line. Yesterday the stock made a rising window with high trading activity - indicating bullish continuation trend.
In JAPANESE CANDLESTICK THEORY, a rising window's low should acts as strong support level. As such, as long as IREN share price maintain above 24.29 the outlook remain bullish. Technically 25.00 until 28.00 will be a good entry point for buying.
ENTRY PRICE : 25.00 - 28.00
TARGET : 31.00 and 34.00
SUPPORT : 24.00 (CUTLOSS below 24.00 on closing basis)

RISING WINDOW!As you can see at the big white arrow, we have an open window; A rising window. This is a very bullish indication, not to mention the bullish candlestick next to the previous candlestick, which is red. This is also very bullish. Be sure to set up your horizontal trend lines (as seen in this idea). Happy trading!

NASDAQ - 1D - The 3 converging signals. This tutorial looks at the Daily chart main technology index in the World, NASDAQ.
When evaluating its prices, NASDAQ has been down-trending in the past 8 months, in a steep decline. It started from its All-Time-High (ATH), when it held the 16700s level on the 21st of November 2021, sinking over 34% towards the 11300 level on the 16th of June 2022.
However, since its recent low, the NASDAQ kept increasing in price. In the last trading week (8th - 12th of August 2022), prices formed an interesting technical pattern that could give way to a prolonged upward movement. Today, a new candlestick formed, sitting right on the 200 EMA line.
I have highlighted 3 significant patterns which are converging. These patterns increase the probability of such upward movement, leading me to believe in a potential bullish movement:
1- Downtrend Breakout
2- Gap Up or Rising Window
3- 200 EMA (Exponential Moving Average) Breakout
To understand the technical patterns I am discussing, it is necessary to identify two indicators within the chart. These indicators are the 200 EMA (Exponential Moving Average), which is the red line following the price, and the Downtrend Line, which is the purple line connected to the recent highs. I have drawn a red circle to point out where the signals converged.
1- The Downtrend was acting as resistance for over 7 months, from December 2021 until the 10th of August. From then, the Downtrend line will act as a support for the potential upcoming upward movement.
2- The Gap Up in price happened between the market close on the 9th of August to the market open on the10th of August. It brought the price up on a powerful movement, ignoring the downtrend resistance line and sitting on top of it, transforming it into a support line.
3- Major investors and hedge funds use the 200 EMA as a bullish/bearish indicator and a strong resistance/support level. The last candlestick (12th of August) closed above the 200EMA line, which did not happen for over 4 months.
To conclude, the convergence of the 200 EMA plus the down-trend breakouts along with the rising window form an interesting signal that suggests the downtrend might run out of steam.
Happy Investrading!

WIN | Strong Momentum Rising Window Candle- Triangle Breakout WIN | Thailand MAI Index | Price Action & Chart Pattern Trading
Chart Pattern: Symmetrical Triangle Strong Momentum Breakout - possible new high Elliott 5th Wave Extension
Price Action: Entry @ New High Breakout supported with strong momentum with Rising Window Bullish Candlestick
Indicator:
> RSI: Bullish signal cross up MA line
> MACD: Golden cross way above baseline 0 - indicating strong bullish
