#RLC/USDT Pump Anticipated#RLC
The price is moving within a descending channel on the hourly timeframe. It has reached the lower boundary and is heading towards a breakout, with a retest of the upper boundary expected.
The Relative Strength Index (RSI) is showing a downward trend, approaching the lower boundary, and an upward bounce is anticipated.
There is a key support zone in green at 0.595, and the price has bounced from this level several times. Another bounce is expected.
The RSI is showing a trend towards consolidation above the 100-period moving average, which we are approaching, supporting the upward move.
Entry Price: 0.604
Target 1: 0.616
Target 2: 0.630
Target 3: 0.647
Stop Loss: Below the green support zone.
Remember this simple thing: Money management.
For any questions, please leave a comment.
Thank you.
RLC

#RLC/USDT Bullish Reversal in MAGICUSDT Accumulation Zone#RLC
The price is moving in a descending channel on the 1-hour timeframe. It has reached the lower boundary and is heading towards breaking above it, with a retest of the upper boundary expected.
We have a downtrend on the RSI indicator, which has reached near the lower boundary, and an upward rebound is expected.
There is a key support zone in green at 0.658. The price has bounced from this zone multiple times and is expected to bounce again.
We have a trend towards consolidation above the 100-period moving average, as we are moving close to it, which supports the upward movement.
Entry price: 0.694
First target: 0.712
Second target: 0.745
Third target: 0.777
Don't forget a simple principle: money management.
Place your stop-loss below the support zone in green.
For any questions, please leave a comment.
Thank you.

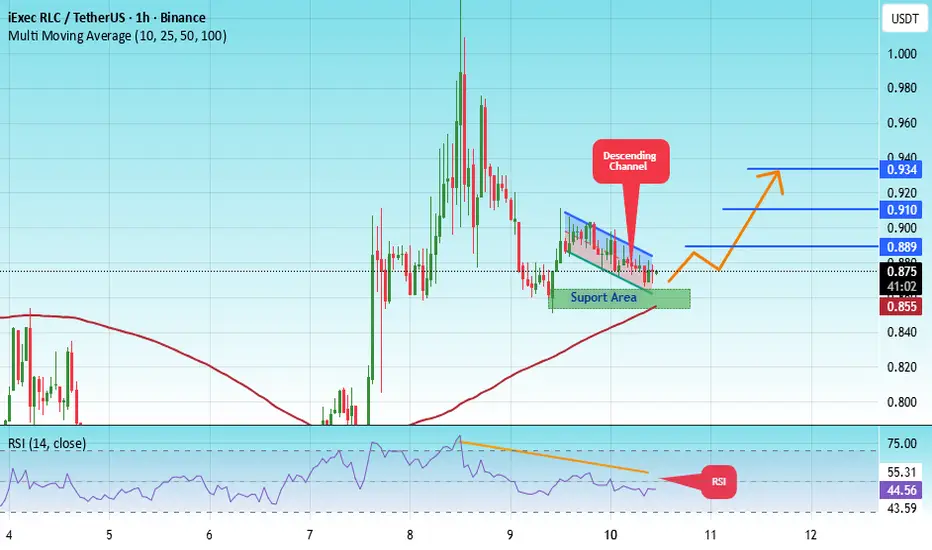
#RLC/USDT Pump Anticipated#RLC
The price is moving within an ascending channel on the 1-hour timeframe and is adhering to it well. It is poised to break out strongly and retest the channel.
We have a downtrend line on the RSI indicator that is about to break and retest, which supports the upward move.
There is a key support zone in green at the 0.860 price level, representing a strong support point.
We have a trend of consolidation above the 100-period moving average.
Entry price: 0.876
First target: 0.889
Second target: 0.910
Third target: 0.934
Don't forget a simple money management rule:
Place your stop-loss order below the green support zone.
Once you reach the first target, save some money and then change your stop-loss order to an entry order.
For any questions, please leave a comment.
Thank you.
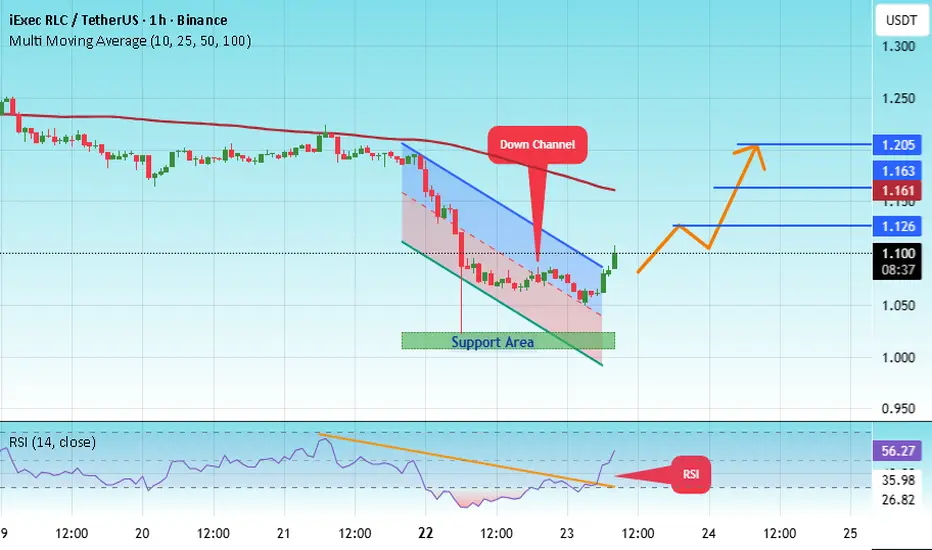
#RLC/USDT Pump Anticipated#RLC
The price is moving within a descending channel on the 1-hour frame, adhering well to it, and is heading for a strong breakout and retest.
We have a bearish trend on the RSI indicator that is about to be broken and retested, which supports the upward breakout.
There is a major support area in green at 1.01, representing a strong support point.
We are heading for consolidation above the 100 moving average.
Entry price: 1.10.
First target: 1.12.
Second target: 1.16.
Third target: 1.20.
Don't forget a simple matter: capital management.
When you reach the first target, save some money and then change your stop-loss order to an entry order.
For inquiries, please leave a comment.
Thank you.
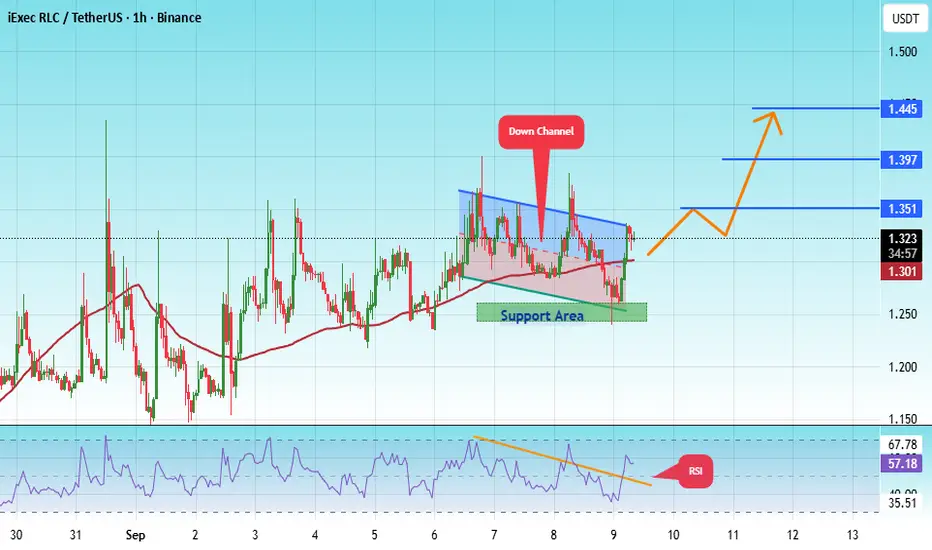
#RLC/USDT Pump Anticipated#RLC
The price is moving within a descending channel on the 1-hour frame, adhering well to it, and is heading for a strong breakout and retest.
We have a bearish trend on the RSI indicator that is about to be broken and retested, which supports the upward breakout.
There is a major support area in green at 1.25, which represents a strong support point.
For inquiries, please leave a comment.
We are in a consolidation trend above the 100 Moving Average.
Entry price: 1.32
First target: 1.35
Second target: 1.39
Third target: 1.44
Don't forget a simple matter: capital management.
When you reach the first target, save some money and then change your stop-loss order to an entry order.
For inquiries, please leave a comment.
Thank you.
RLCUSDT UPDATE#RLC
UPDATE
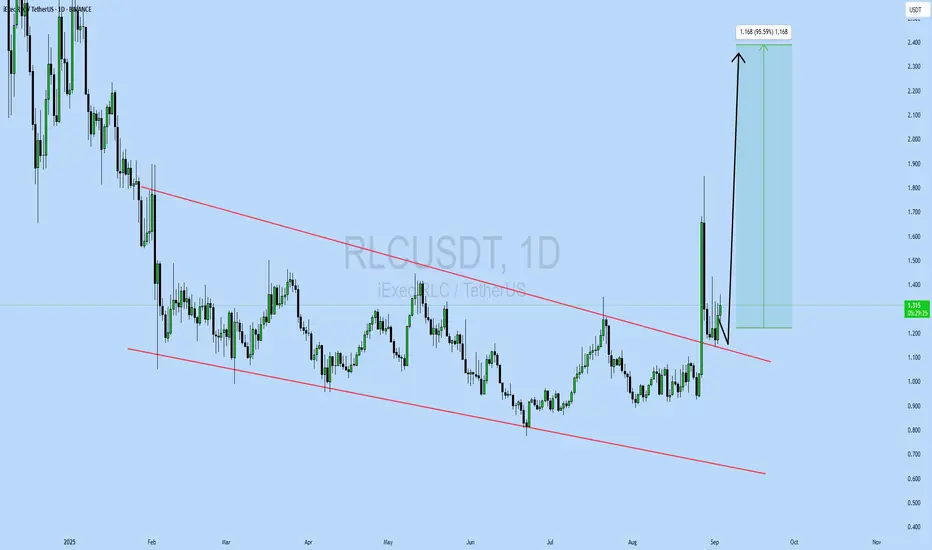
RLC Technical Setup
Pattern : Falling Wedge Pattern
Current Price: $1.316
Target Price: $2.48
Target % Gain: 95.59%
Technical Analysis: RLC has broken out of a falling wedge on the 1D chart with a strong bullish candle. Volume spike confirms buying pressure, suggesting momentum could extend toward $2.48 if the breakout sustains.
Time Frame: 1D
Risk Management Tip: Always use proper risk management.
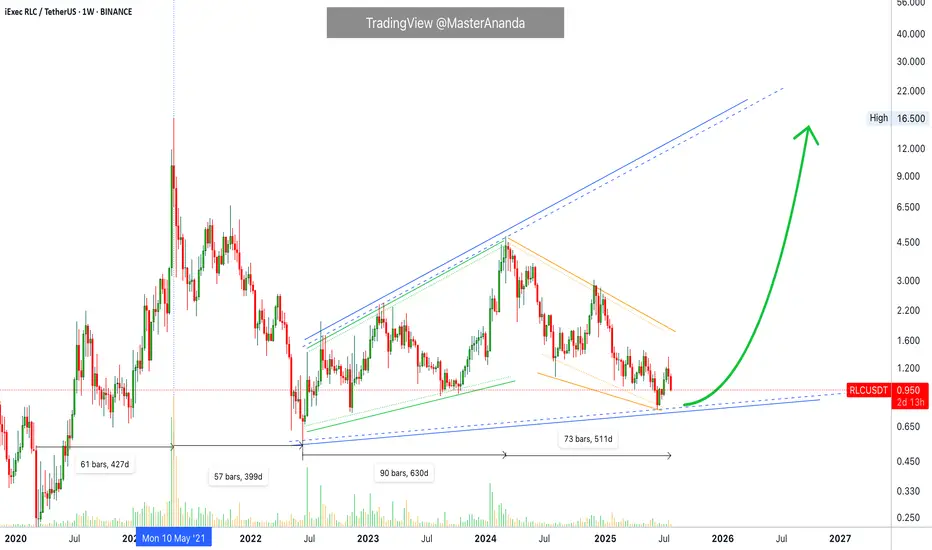
iExec RLC · Trading at Bottom with a Bullish BiasiExec RLC (RLCUSDT) is still trading at bottom prices but the overall market conditions are good. Good for the future because the market moves in waves alternating always between rising and falling.
RLCUSDT went bearish between May 2021 and June 2022, 399 days. Then it went bullish from June 2022 to March 2024, 630 days. Then it went bearish again between March 2024 and present day, August 2025. More than 510 days.
While RLCUSDT has been bearish more than a year, the action is still happening as a long-term higher low. That is, prices today and at the lowest—16-June 2025—are still higher compared to the low in June 2022.
Of course before being bearish in 2022 the market was bullish between March 2020 and May 2021, 427 days. Here we can clearly see the fluctuations between bear and bull, uptrends and downtrends.
The last uptrend came in 2021 and we are due a new one. Crypto grows every four years and market conditions are perfect for the next run. The market has been mixed, sideways and neutral for years on end, the long-term higher low is a single of strength. After the current retrace is over, you can prepare for a major bullish wave.
Namaste.
#RLC/USDT#RLC
The price is moving within a descending channel on the 1-hour frame, adhering well to it, and is heading toward a strong breakout and retest.
We are experiencing a rebound from the lower boundary of the descending channel, which is support at 0.995.
We are experiencing a downtrend on the RSI indicator, which is about to break and retest, supporting the upward trend.
We are heading toward stability above the 100 Moving Average.
Entry price: 1.028
First target: 1.063
Second target: 1.102
Third target: 1.152

#RLC/USDT Pump Anticipated#RLC
The price is moving within a descending channel on the 1-hour frame, adhering well to it, and is on its way to breaking strongly upwards and retesting it.
We have support from the lower boundary of the descending channel, at 1.155.
We have a downtrend on the RSI indicator that is about to be broken and retested, supporting the upside.
There is a major support area in green at 1.143, which represents a strong basis for the upside.
Don't forget a simple thing: ease and capital.
When you reach the first target, save some money and then change your stop-loss order to an entry order.
For inquiries, please leave a comment.
We have a trend to hold above the 100 Moving Average.
Entry price: 1.170.
First target: 1.200.
Second target: 1.234.
Third target: 1.282.
Don't forget a simple thing: ease and capital.
When you reach your first target, save some money and then change your stop-loss order to an entry order.
For inquiries, please leave a comment.
Thank you.

#RLCUSDT #1D (Binance Futures) Descending wedge on supportiExec RLC just printed a dragonfly doji which may have marked the bottom on daily.
A morning star is drawing now, recovery towards 100EMA resistance seems around the corner.
⚡️⚡️ #RLC/USDT ⚡️⚡️
Exchanges: Binance Futures
Signal Type: Regular (Long)
Leverage: Isolated (4.0X)
Amount: 5.9%
Current Price:
0.9126
Entry Targets:
1) 0.9002
Take-Profit Targets:
1) 1.1854
Stop Targets:
1) 0.7859
Published By: @Zblaba
GETTEX:RLC BINANCE:RLCUSDT.P #DePIN #AI #iExec iex.ec
Risk/Reward= 1:2.5
Expected Profit= +126.7%
Possible Loss= -50.8%
Estimated Gaintime= 1 month

RLCUSDT 1W AnalysisRLC ~ 1W Analysis
#RLC This is the closest support for now. Buy if you still have faith in this coin with a short-term target of at least 20%++

#RLC/USDT#RLC
The price is moving in a descending channel on the 1-hour frame and is adhering to it well and is heading to break it upwards strongly and retest it
We have a bounce from the lower limit of the descending channel, this support is at a price of 1.13
We have a downtrend on the RSI indicator that is about to be broken and retested, which supports the rise
We have a trend to stabilize above the moving average 100
Entry price 1.15
First target 1.17
Second target 1.20
Third target 1.25

RLCUSDT 1D Analysis RLC ~ 1D Analysis
#RLC Buy on retesting this support block or buy after successfully breaking this resistance line with a short term target of at least 10%+.

$RLC Looking for SHORT In the weekly timeframe, it seems that the price has broken its upward trendline.
But I'll wait for the pullback.
On the other hand, the price might also reach the upper drawn trendline, which could be a good point for a sell.

#RLC/USDT#RLC
The price is moving in a descending channel on the 1-hour frame and is expected to continue upwards
We have a trend to stabilize above the moving average 100 again
We have a descending trend on the RSI indicator that supports the rise by breaking it upwards
We have a support area at the lower limit of the channel at a price of 1.98
Entry price 2.08
First target 2.19
Second target 2.28
Third target 2.38

$RLC Just broke out of it's Falling Wedge iExec RLCGETTEX:RLC has been on a down trend for Months!
Current Price: 1.73
Price action has continued in it's falling wedge for months and recently just broke out of it!
Expecting Price Action to continue upwards.
#RLC Targets: 2.09, 2.53, 2.96
This Idea Invalidates under 1.64

#RLC/USDT#RLC
The price is moving in a descending channel on the 4-hour frame and sticking to it well
We have a bounce from the lower limit of the descending channel, this support is at 1.40
We have an upward trend, the RSI indicator is about to break, which supports the rise
We have a trend to stabilize above the moving average 100
Entry price 1.61
First target 1.70
Second target 1.82
Third target 1.96

RLC Technical Analysis in a Weekly TimeframeHello everyone, I’m Cryptorphic.
I’ve been sharing insightful charts and analysis for the past seven years.
Follow me for:
~ Unbiased analyses on trending altcoins.
~ Identifying altcoins with 10x-50x potential.
~ Futures trade setups.
~ Daily updates on Bitcoin and Ethereum.
~ High time frame (HTF) market bottom and top calls.
~ Short-term market movements.
~ Charts supported by critical fundamentals.
Now, let’s dive into this chart analysis:
RLC is showing a strong rebound from the support trendline and is likely to rally if the market remains bullish.
The resistance trendline at $3.58 will likely be the next testing level for RLC. On the downside, if RLC experiences another downtrend, it could drop as low as $0.717, where we have lower support.
The RSI appears to be gaining momentum, with a bit of room left before reaching the oversold zone.
Key levels:
- Primary Support: $1.3.
- Lower Support: $0.717.
- Primary Resistance: $3.58.
- Long-term Target: $16.5.
DYOR, NFA.
Please hit the like button to support my content and share your thoughts in the comment section. Feel free to request any chart analysis you’d like to see!
Thank you!
#PEACE

Short position on RLCUSDT 49Min/ Trading SetupBINANCE:RLCUSDT
KRAKEN:RLCUSD
Market can start a high volatile movement, so be don't forget to risk-free your position.
Mid-risk status: 4x-5x Leverage
Low-risk status: 2x-3x Leverage
⚡️TP:
On the chart
➡️SL:
On the chart
🧐The Alternate scenario:
🔴If the price stabilize above the trigger zone, and stabilize above resistance line, the setup will be cancelled.

#RLC/USDT#RLC
The price is moving within a bearish channel pattern on the 4-hour frame, which is a strong retracement pattern
We have a bounce from a major support area in the color EUR at 1.95
We have a tendency to stabilize above the Moving Average 100
We have an upward trend on the RSI indicator that supports the rise and gives greater momentum, upon which the price depends
Entry price is 2.00
The first goal is 2.20
Second goal 2.32
Third goal 2.47

RLC short setupFrom where we entered "start" on the chart, RLC correction seems to have started.
It appears to be completing a bearish triangle now.
We will look for sell/short positions in the red range.
The target can be the green box.
Closing a daily candle below the invalidation level will violate the analysis
For risk management, please don't forget stop loss and capital management
When we reach the first target, save some profit and then change the stop to entry
Comment if you have any questions
Thank You

RLCUSDT - Cup Structures Dominant trend line in solid white line up with another less important trend line below
I think price will hodl above this solid white line and turn to the upside in a sort of cup fashion
This cup can be seen in earlier bull run, see if it plays out again
Daily chart

#RLC/USDT#RLC
The price is moving within a falling channel on a 1-day frame, which is a retracement pattern
We have a tendency to stabilize above the Moving Average 100
We have an upward trend on the RSI indicator that supports the rise and gives greater momentum
Entry price is 3.20
First goal 4.09
Second goal 4.48
Third goal 5.05
