AXSUSDT 2H: Possible SHORTAXSUSDT 2H: Possible SHORT
AXSUSDT H2: Rebound from resistance 50 and fall to support level 29
Robot

GRTUSDT 2H: Possible SHORTGRTUSDT 2H: Possible SHORT
Rebound from resistance 0.7000 and fall to support level 0.6400

Retail gamblers found the holy grail... To be a rogue trader!I just had a little look into "robots". I've known from reading some of the BIS reports that Forex quants mostly vanished after 2008.
But I wanted to go on these FX retail sites that are heavy in the "automated" very short term "trading", which is not actually day trading as they run these programs 24/24 there is no "end of the day so let's stay out of the market for 2/3 of the time to compound profits faster" 😄
Here is how I expect an exchange with an "automated" day gambler would go:
My day gambling strategy works muahahaha it does well on backtest for 1 years.
Me: "That's simply because the pair you tested it on has been trending for 1 year you numbskull"
Well you just have to apply it in the right conditions!
Me: "With your crystal ball? If you know what they are, why not just manually take 1 trade?"
Aha! Because of the power of compounding! Rather than risk 1% to make 5% I will make 2% 25 times.
Me: "Your brain on holiday? Forgot you would also compound spread costs and losses?"
Well forget it, if you rly zoom in and can't see anything it looks magical! Doesn't depend on the 1 year trend!
Me: "Then it depends on the 1 month trend?"
No! no matter what you say I have an idiotic answer!
Usually starts with "You just have to"!
I'll throw idiotic answers at you until you get bored and give up on me because I am hopeless!
Me: "Well done I give up" "Thanks for the laugh though" 😂
Take a good friend of mine, UDNCNY:
I can tell you for a fact that an "automated strategy" of the kind I am going to describe would work. Don't even need to backtest it.
The strategy is as follow: Take about any indicator (RSI, Bollinger Bands, etc). When the price goes down (< 30 RSI or lower band) then goes back up to the middle (RSI 50 or center of Bollingers) you sell. And of course the same on the opposite with buying.
Yes that strategy would work, we can quickly eyeball it:
In practice this is not even what they do. A risk-to-reward ratio as enormous as puny 1-to-1.8? That's like 1% of retail. Never!
What they do is have super distant stops, or no stops. And quickly by looking at USDCNY you understand how they can win.
Shorts at a loss are all in a pullback, and the price never goes very far, so by just waiting they will turn into winners at some point.
In my example which wasn't the best part of the USDCNY trend, there are 6 short signals, and 3 longs.
The longs that are not winners quickly, will "never" recover so they'll take a loss on a far away stop here.
But some longs are winners, and most to all shorts are winners, the smaller the reward and bigger distance the stop is, the close to 100% winrate it gets on shorts.
To sum up, with their ridiculous high winrate strategies applied in the right conditions:
- The vast majority of trades are going to be winners no matter what
- Maybe 1/3 of the losers are in the wrong direction and will be big bags
- Maybe 2/3 of the "losers" are in the correct direction and eventually will recover
These troll retail gamblers are zooming in a flower to the molecule level and wondering why it suddenly went invisible. Must be magic!
They have no clue. There is an insect on the flower, that's why you can't see the flower molecule anymore you numbskull.
This indicator strategy I mentioned works on a trend, how about a nice thick really gross sideways?
Constantly stopped! But have no worries for the retail gamblers have a trick up their sleeve!
With a very wide stop such as the risk is 20 times the size of the reward you will keep winning! Hurrah! Martingale!
And then it will start trending in the wrong direction and the clowns will get wiped out.
And I can assure you, this happens more often than 1 in 20 times 🙂
Now we are getting to my favorite part: The holy grail in the title.
I went to myfxbook take a look at system. By default they show you only the ones with positive returns, and many of those are very recent.
No no no no no. let me change that filter to at least 1 year of activity, and any returns.
What's this? More than half show red returns? Oh my that's a lot of -99% 🙂
Most people quit before getting to -99.
How about I pick one of the "winners"? Weird, why are their open trades private?
Another one. Private. Another. Private. And another, private again!
Oh I found one! TrumpBot. Interesting, that's a lot of red sir.
70 open trades, almost all in the red. USDCAD, EURUSD, USDJPY.
All EURUSD are sells, and all the ones ones are buys.
He took plenty of short term trades (well long term now as he's been holding the bag for a while) LONG on the USDOLLAR. Oh no!
Remember USDCNH? Well these bags go back to early in the USD downtrend. He's been holding for nearly a year 🙂
L - O - S - E - R
Just takes 1 L to wipe out these clowns. They can hack some site to make losses vanish, and obviously the dum dums that buy these kinds of systems are too lazy to really do their research so they never notice it, but if it's real money IT'S REALLY GONE.
There are some guys that have been struggling to make money for 20 years and have sold robots for 10.
Is it cruel if I... roll myself on the floor while I laugh to tears? 🤣
What about all these "private" systems? They're holding bags too?
There is a name for this. It starts with an F. And ends with raud.
It is the rogue traders specialty.
They do a bit more (pros), call them "hedges", manipulate accounting for example,
take opposite positions to cut their losses while keeping them secret (unrealized)...
Here is a regulator release on famous Karen Bruton, known as "the supertrader".
She was made famous by Tom Sosnoff that had her appear on his show.
The SEC fined her and a partner to over a million dollar. She lost way more than that. No jail.
www.sec.gov
Tom Sosnoff is a market maker from the 80s that created a popular trading platform that he sold,
and now teaches people to sell option spreads. With no edge or risk it will return little money, like 1%.
Karen the Supertrader got superresults by leveraging that strat. Which causes it to LOSE money.
Looks like Karen couldn't figure out high school level maths, nowadays this got to be 2nd uni year,
the levels has collapsed it's amazing, my sister aiming for med school doesn't even HAVE math classes
since 16 year old, science with no maths, genius government.
"But kids don't like it", ye so let's make them even dumber than they already are!
Yes but Karen convinced investors, and even Tom Sosnoff and his colleagues, that she made money!
Ye, just like all the myfxbook trolls. She never closed the losers.
Plenty of realized gains, and much larger unrealized losses. Pathetic.
And the flip side?
Warren Buffett has held unrealized gains on Coca-Cola since 1987.
Never held losses very long. Ever. Some uni nerd looked at it.
We know because he has to report all positions.
Losers (and crooks) hold losers. Winners hold winners. That simple.

GOLD : ANALYSIS IN SMALL TMF , PRICE WILL DROP ? ? 🔔🔔🔔Welcome back Traders, Investors, and Community!
If you LIKE this analysis, Please support our page by hitting the LIKE👍 button
Feel free to request any pair/instrument analysis or ask any questions in the comment section below.
Good trading at everyone!

EUR/AUD : Price Action Bearish channel, Price Keeps Falling ! 🔔Welcome back Traders, Investors, and Community!
If you LIKE this analysis, Please support our page by hitting the LIKE 👍 button
Feel free to request any pair/instrument analysis or ask any questions in the comment section below.
Good trading at everyone!

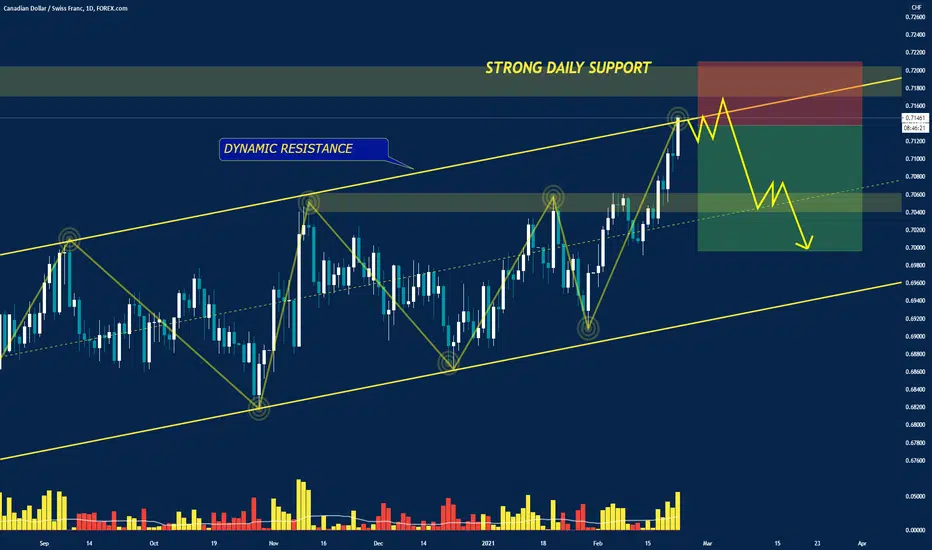
CAD/CHF : Price Action in small TMF , is the Price GROWING ?! 🔔Welcome back Traders, Investors, and Community!
If you LIKE this analysis, Please support our page by hitting the LIKE 👍 button
Feel free to request any pair/instrument analysis or ask any questions in the comment section below.
Good trading at everyone!
TRXCTRXC - Robot surgery company
New CEO
New strategy
Huge upside potentional (2-10X)
Closing private offering on 3$ 2021.01.28.
PT'1: 6.5$
PT2: 10$
Holding Long, Holding Strong. ;)

GOLD : UPDATE Price Action on Daily TMF , BREAKOUT FALL ! 🔔Welcome back Traders, Investors, and Community!
If you LIKE this analysis, Please support our page by hitting the LIKE 👍 button
Feel free to request any pair/instrument analysis or ask any questions in the comment section below.
Good trading at everyone!

IRBTRobot company which engages in designing and building robots
Perfect for a new long set-up
NASDAQ:IRBT

IRBT - Month chart study continuation from my first post todayWe had our last cup and handle on the month chart and the continuation of the rise was stopped by COVID. Now we are in our second cup and handle. This handle is huge. I believe that this stock can finally see new ground....unless robot vacuums are unfriendly to the environment...haha :) We are going to continue up for a bit but watch for a pullback.

EUR/USD : Price Action on Daily TMF , Price is GROWTH ! 🔔Welcome back Traders, Investors, and Community!
If you Like this analysis, Please support our page by hitting the LIKE button 👍
Feel free to request any pair/instrument analysis or ask any questions in the comment section below.
Good trading at everyone!

GBP/NZD: Price Action on Daily TMF, Bearish correction FALL ! 🔔Welcome back Traders, Investors, and Community!
If you Like this analysis, Please support our page by hitting the LIKE button 👍
Feel free to request any pair/instrument analysis or ask any questions in the comment section below.
Good trading at everyone!

Drones are coming ! TAKOF drone delivery Canada is going mad !!so we covered the stock thoroughly in our DD article on our site so I will not expand here but just go over several facts:
they were founded in 2014 and currently using an AI integrated system called FLYTE that is not fully AI yet and monitored by staff in DDC headquarters but I expect full AI in the upcoming years.
they have 3 main types of drones the smallest called Sparrow with a range of 30km and can carry 4.5kg of payload
the second drone is Robin XL which can travel 60 km and can carry 11.3kg of payload and the biggest one goes by the name of Condor and can carry over 180kg and can travel 200 km distance which looks like a mini-helicopter!
the drone industry is expected to cross 300 B $ by 2030 acc to estimations by ARK invest that caused the drone industry to rally up
we choose to focus on this stock because the fundamentals are great but the technical are amazing !!
Let's talk Technicals:
The stock was IPO at 1.3772 and it is now touching the IPO level at 1.3558- reached a high of 1.5372 last week.
I LOVE that fact the POC is so high (red line)!! that is very very rare – the POC is at 1.442 which is currently higher than stock price (this formation of the volume is called P shape)
The purple square on the right shows us again an unusual behavior – the higher price levels are already accumulated so the stock can easily pass these areas with no need for convergence (good !)
The lower areas below 1.07 are empty meaning that if the stock drops to that area it can easily keep falling as these areas are not tested (Bad!)
so we cannot have stock falling below 1.08.
Stochastic is in the overbought area but we saw it correcting a bit in the last 4h which is prob because of the pump and dump behavior of the market lately which affects most of the other penny stocks.
One last thing worth mentioning is the tiny gap we have between 1.31 to 1.34 which may need to get filled as gaps will usually do but this is so minor that it won’t have much effect.
How would I play it > I would see pre-market action as always and see if I get a nice pullback to enter, if we see stock rallying pre-market we would not enter until around 17:00 – 18:00 UK time as it is the reverse of the true direction of the stock and can give us a nice correction entry.
We at FDGT the Traders Union are very bullish on the stock and we gave it a price target of 2.7 in the upcoming 2 months - with this meme market we may see it in the upcoming weeks LOL
we trade on our own rules! see you in the take profit
Cheers and be safe!

EUR/AUD : Price Action on Daily TMF , Price Keeps Falling !Welcome back Traders, Investors, and Community!
If you Like this analysis, Please support our page by hitting the LIKE button 👍
Feel free to request any pair/instrument analysis or ask any questions in the comment section below.
Good trading at everyone!

AUDCAD - Day trade signal by Keltner 27/11/20201. How to fill color the Keltner Channel:
...All Upper, Basis, Lower inscreased to fill green.
...All upper, basis, lower descrease to fill red.
...One of the Upper, Basis, Lower is not the same direction fill gray color.
2. How to calculate a Trend:
...If the Total of 25 candles > 0 to give Uptrend.
...If the Total of 25 candles < 0 to give Downtrend.
3. How to entry.
- Buy's entry when the Color is up and the price crossunder the Basis.
- Sell' entry when the Color is down and the price crossover the Basis.
4. How to calculate the Stoploss and Take profit:

CHFJPY - Day trade by Keltner Channel 16/11/2020Max risk: 2%.
Maximum history bars/Premium account.
Commission: 4usd/trade.
Slippage: 2 ticks.

EURNZD - Day trade signal with Keltner & Rsi 30 Dec 2020The right screen is never predicting before. Just a the best result at the history for confident to using for Trade.
------------------------
Risk: 1%.
1. The Long signal is calculate by the RSI indicator crossover 70, wait to Buy when the price corrects and crossunders the Upper Keltner Channel.
2. The Short signal is calculate by the RSI indicator crossunder 30, wait to Sell when the price corrects and crossovers the Lower Keltner Channel.
3. Stoploss and Take Profit is calculated by Plus or Minus the Average True Range indicator from the Price Entry.

NZDJPY - Day trade by Keltner 30-Dec-2020Risk: 1%.
Data backtest is maximum history bars with premium account.
-----------
Look to chart below to found the current rule.
-----------
1. The Long signal is calculate by the Close of candle crossing up The Keltner Channel Upper.
2. The Short {Sell] signal is calculate by the Close of candle crossing down The Keltner Channel Lower.
3. Reset the Up/Down confirm at Entry.
4. Don''t entry when occurs the Reversal Candle (over 80% the Heigh of Keltner Channel).
5. Stoploss and Take Profit is calculated by Plus or Minus from the Price Entry.

AUDCAD - Day trade signal by Keltner 29 Dec 2020Risk: 1%/trade.
Data backtest: default by Tradingview with Premium account.

EURUSD - Day trade by Kelter channel 26 DEC 2020* Signals are tested successfully for 3.5 years with a steady win rate year on year until now.
Risk: 1%.
* Backtest time: 3.5 years / Premium, varies between currency pairs (Cryto default backtest time is shorter since the market is open both Saturday and Sunday: about 2 years).
The price rule of EURUSD in 20,000 past H1 candles past:
- Upterm (Long): Buy
+ When the price crossing up (Crossover) the Upper line gives 1 point.
- Downterm (Short): Sell
+ When the price crossing down (Crossunder) the Lower line gives 1 point.
- 2 or more points (> = 2), the entry conditions are met
- The entry point for the highest winning rate: when the price adjusts to the Upper / Lower line, the order price is at the closing price of the adjustment candle.
- When the above conditions are met, the Indicator shows a Buy / Sell signal according to the trend.
-----------------------------------
- Maximum risk / reward winning ratio: 1 / 1.05
- Stoploss: Calculated from the entry point + - actual fluctuation with the formula ATR (20) * risk ratio (risk).
- Profit: Calculated from the entry point + - actual fluctuation by the formula ATR (20) * reward ratio (reward).
- Profit: So the product has a stable profit of over 30% / year.
- Should backtest 3 Years (long term), every Year (medium term) and quarterly or 6 months (short term). If each year the success rate is always over 50%, it can be used for real trade.

NZDJPY - Day trade by Keltner 23-Dec-2020The right screen is never predicting before. Just a the best result at the history for confident to using for Trade.
------------------------
Risk: 1%.
1. The Long signal is calculate by the Close of candle crossing up The Keltner Channel Upper.
2. The Short {Sell] signal is calculate by the Close of candle crossing down The Keltner Channel Lower.
3. Reset the Up/Down confirm at Entry.
4. Don''t entry when occurs the Reversal Candle (over 80% the Heigh of Keltner Channel).
5. Stoploss and Take Profit is calculated by Plus or Minus from the Price Entry.

EURUSD - Day trade by Kelter channel 23 DEC 2020* Signals are tested successfully for 3.5 years with a steady win rate year on year until now.
Risk: 1%.
* Backtest time: 3.5 years / Premium, varies between currency pairs (Cryto default backtest time is shorter since the market is open both Saturday and Sunday: about 2 years).
The price rule of EURUSD in 20,000 past H1 candles past:
- Upterm (Long): Buy
+ When the price crossing up (Crossover) the Upper line gives 1 point.
- Downterm (Short): Sell
+ When the price crossing down (Crossunder) the Lower line gives 1 point.
- 2 or more points (> = 2), the entry conditions are met
- The entry point for the highest winning rate: when the price adjusts to the Upper / Lower line, the order price is at the closing price of the adjustment candle.
- When the above conditions are met, the Indicator shows a Buy / Sell signal according to the trend.
-----------------------------------
- Maximum risk / reward winning ratio: 1 / 1.05
- Stoploss: Calculated from the entry point + - actual fluctuation with the formula ATR (20) * risk ratio (risk).
- Profit: Calculated from the entry point + - actual fluctuation by the formula ATR (20) * reward ratio (reward).
- Profit: So the product has a stable profit of over 30% / year.
- Should backtest 3 Years (long term), every Year (medium term) and quarterly or 6 months (short term). If each year the success rate is always over 50%, it can be used for real trade.

AUDCAD - Day trade signal by Keltner 22 DEC 2020- Long signal is comfirms when the Candle's close crossover the Keltner Channel:
www.tradingview.com
- Short's signal confirms when Candle' close crossunder Lower Keltner.
- The formule Stoploss and Take profit
