Robot

BTCUSD - Follow trend by Keltner Channel 23 Sep 20201. How to use Keltner Channel
a_ Length of Keltner's basis line is 50. It gives the best result in finding rule of BTCUSD.
b_ How to confirms a trend.
- Upper 2 is used to confirm Keltner channel at Uptrend.
- Lower 2 is used to confirm Keltner channel at Downtrend.
c. How to determine a swing Entry.
_ Upper 1 is used to buy when the market make a corrective.
_ Lower 1 is used to sell when the market make a corrective.
2. Long signal is confirmed when Closed of candle crossover the Upper 2.
3. Short signal is confirmed when Closed of candle crossunder the Lower 2.
4. Stoploss is calculated by the price closed candle +/- the value of Average true range (length=20 bars)
Stoploss = previous Close +/- atr(20)x2
-> To move the stoploss every 1 hour.
5. Filter the Candle is over 93% for Not Entry.

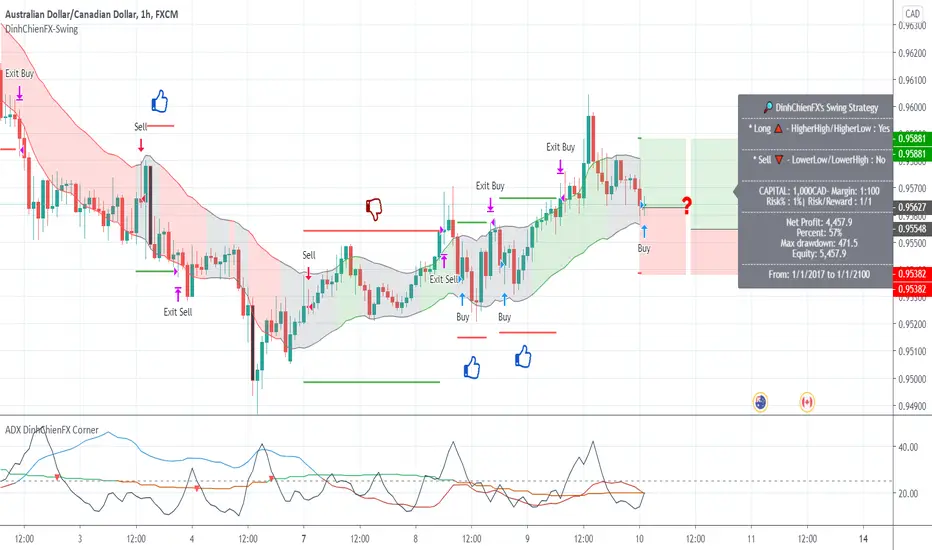
AUDCAD - Day trade signal by Keltner 22 Sep 2020* The signal are tested in 3,5 years. Winrate stability over 52% every year.
Risk: 1%.
* Tradingview's backtest time ~ 3.5 years/Premium account, differs between currency pairs (Cryto is the default backtest time is shorter because the market is open both Saturday and Sunday: about 2 years)
- Base on order: 2 ways to enter or combine both.
Method 1
+ Keltner channel: the price closed above or below Upper / Lower Keltner for signal 1. Wait for the price to adjust to the Basis line, then enter the order.
Method 2
+ Keltner channel: price closes above or below Upper 2 / Lower 2 Keltner gives signal 1. Wait for the price to adjust to Upper / Lower line, then enter the order.
Method 3: combine both, priority 1 if satisfied conditions
+ Pivot option: appear rising signal: Higher High / Higher Low. Decline signal: Lower Low / Lower High for signal 2.
- When the above conditions are met, the Indicator shows a Buy / Sell signal according to the trend.
-----------------------------------
- Stoploss: Calculated from the entry point + - actual fluctuation by the formula ATR (20) * risk ratio (risk).
- Profit: Calculated from the entry point of the command + - actual oscillation using ATR formula (20) * reward ratio (reward).
- Profit: Look the Summary below.
- Should be backtest 3 Years (long term), each Year (medium term) and Quarter or 6 months (short term). If each year the success rate is always more than 50%, can be used for actual trading.

BTCUSD - Day trade by Keltner Channel 21-9-20201. How to use Keltner Channel
a_ Length of Keltner's basis line is 50. It gives the best result in finding rule of BTCUSD.
b_ How to confirms a trend.
- Upper 2 is used to confirm Keltner channel at Uptrend.
- Lower 2 is used to confirm Keltner channel at Downtrend.
c. How to determine a swing Entry.
_ Upper 1 is used to buy when the market make a corrective.
_ Lower 1 is used to sell when the market make a corrective.
2. Long signal is confirmed when Closed of candle crossover the Upper 2.
3. Short signal is confirmed when Closed of candle crossunder the Lower 2.
4. Stoploss is calculated by the price closed candle +/- the value of Average true range (length=20 bars)
Stoploss = previous Close +/- atr(20)x2
-> To move the stoploss every 1 hour.
5. Filter the Candle is over 93% for Not Entry.
--------------
"Use the link below to obtain access to this indicator" or "PM us to obtain access"

BTCUSD - Follow trend & day trade by Keltner Channel 18 Sep 2020* The right screen is 99% in predicting. The backtest''s result is confident in real trade.
* risk of Strategy: 1%.
- Target of Day Trade is with Risk/reward: 1/1.1.

EURJPY - Day trade by Keltner & Stochastic 18/9/2020* The right screen is 99% in predicting. The backtest''s result is confident in real trade.
* risk of Strategy: 1%.
- Target of Day Trade is with Risk/reward: 1/1.2

How to trade EURUSD x5 capital/1% risk/tradeRisk: 1%.
- Upterm (Long): Buy
+ When the price crossing up (Crossover) the Upper line gives 1 point.
- Downterm (Short): Sell
+ When the price crossing down (Crossunder) the Lower line gives 1 point.
- 2 or more points (> = 2), the entry conditions are met
- The entry point for the highest winning rate: when the price adjusts to the Upper / Lower line, the order price is at the closing price of the adjustment candle.
- When the above conditions are met, the Indicator shows a Buy / Sell signal according to the trend.
-----------------------------------
- Maximum risk / reward winning ratio: 1 / 1.05
- Stoploss: Calculated from the entry point + - actual fluctuation with the formula ATR (20) * risk ratio (risk).
- Profit: Calculated from the entry point + - actual fluctuation by the formula ATR (20) * reward ratio (reward).

BTCUSD - Follow trend by Keltner Channel 17 Sep 2020Risk: 1%.
- Follow trend by moving stoploss gives the Awesome result althought percent profitable is always smaller 45%.
- The maximum drawdown is under 18% from 20.000 history bars

How to trade EURNZD x10 capital with 1% riskThe screen on the right is never predictable. Only the best results in history to be confidently used for Trading.
------------------------
Risk: 1%.
1. Long signal is calculated when the RSI is above 70, wait for Buy when the price corrects to cross the Upper Keltner line.
2. Sell signal is calculated when RSI cuts down to 30, wait for Sell when the price corrects to the Lower Keltner line.
3. Stoploss and Take Profit are calculated by Add or Subtract the Average True Range indicator from the Price Entry.
------
Thanks for watching the video.
please like, comment .

How to trade EURNZD wins over 1.000%/1 risk/1 tradeThe screen on the right is never predictable. Only the best results in history to be confidently used for Trading.
------------------------
Risk: 1%.
1. Long signal is calculated when the RSI is above 70, wait for Buy when the price corrects to cross the Upper Keltner line.
2. Sell signal is calculated when RSI cuts down to 30, wait for Sell when the price corrects to the Lower Keltner line.
3. Stoploss and Take Profit are calculated by Add or Subtract the Average True Range indicator from the Price Entry.
------
Thanks for watching the video.

AUDCAD - Day trade signal by Keltner 15 Sep 2020* The signal are tested in 3,5 years. Winrate stability over 52% every year.
Risk: 1%.
* Tradingview's backtest time ~ 3.5 years/Premium account, differs between currency pairs (Cryto is the default backtest time is shorter because the market is open both Saturday and Sunday: about 2 years)
- Base on order: 2 ways to enter or combine both.
Method 1
+ Keltner channel: the price closed above or below Upper / Lower Keltner for signal 1. Wait for the price to adjust to the Basis line, then enter the order.
Method 2
+ Keltner channel: price closes above or below Upper 2 / Lower 2 Keltner gives signal 1. Wait for the price to adjust to Upper / Lower line, then enter the order.
Method 3: combine both, priority 1 if satisfied conditions
+ Pivot option: appear rising signal: Higher High / Higher Low. Decline signal: Lower Low / Lower High for signal 2.
- When the above conditions are met, the Indicator shows a Buy / Sell signal according to the trend.
-----------------------------------
- Stoploss: Calculated from the entry point + - actual fluctuation by the formula ATR (20) * risk ratio (risk).
- Profit: Calculated from the entry point of the command + - actual oscillation using ATR formula (20) * reward ratio (reward).
- Profit: Look the Summary below.
- Should be backtest 3 Years (long term), each Year (medium term) and Quarter or 6 months (short term). If each year the success rate is always more than 50%, can be used for actual trading.

EURO behaving like your stepmom - one more pushA meaningful trading upper range combined with consolidation backwards ratio of 1.66 enhanced the the possibility of touching 1.20 with a false breakout. It would be wise to trade the range with tight stop losses.
A complex system that works is invariably found to have evolved from a more simple system that worked.
A computer makes as many mistakes in one second as three men working for thirty years straight.


EURNZD - Day trade signal with Keltner 12-Sep-2020The right screen is never know before. Just a most result at the left makes a confident for trade.
- Risk: 1%.
- Good luck.

AUDCAD - Day trade signal by Keltner 10 Sep 2020* The signal are tested in 3,5 years. Winrate stability over 52% every year.
Risk: 1%.
* Tradingview's backtest time ~ 3.5 years/Premium account, differs between currency pairs (Cryto is the default backtest time is shorter because the market is open both Saturday and Sunday: about 2 years)
- Base on order: 2 ways to enter or combine both.
Method 1
+ Keltner channel: the price closed above or below Upper / Lower Keltner for signal 1. Wait for the price to adjust to the Basis line, then enter the order.
Method 2
+ Keltner channel: price closes above or below Upper 2 / Lower 2 Keltner gives signal 1. Wait for the price to adjust to Upper / Lower line, then enter the order.
Method 3: combine both, priority 1 if satisfied conditions
+ Pivot option: appear rising signal: Higher High / Higher Low. Decline signal: Lower Low / Lower High for signal 2.
- When the above conditions are met, the Indicator shows a Buy / Sell signal according to the trend.
-----------------------------------
- Stoploss: Calculated from the entry point + - actual fluctuation by the formula ATR (20) * risk ratio (risk).
- Profit: Calculated from the entry point of the command + - actual oscillation using ATR formula (20) * reward ratio (reward).
- Profit: Look the Summary below.
- Should be backtest 3 Years (long term), each Year (medium term) and Quarter or 6 months (short term). If each year the success rate is always more than 50%, can be used for actual trading.
NZDJPY - Day trade signal by Keltner Channel 09-09-2020The right screen must be unpredictable. Only historical best results to confidently use for Trading.
------------------------
Risk: 1%.
1. Long signals are calculated by closing a bright candle on the Keltner channel.
2. Short {Sell] Signal calculated by Closing the Lower Keltner Channel Candlestick.
3. Reset Up / Down confirmed at Entry.
4. Not to when the Reversal Candles (more than 80% of the height of the Keltner Channel).
a. No filter Candles above 80%.
b. Filter Candles above 80% for No.
5. Stoploss and Pegs are calculated by either Plus or minus when Price is entered.
---------------------------------------
The shape margins must be unpredictable. Only historical best results to confidently use for Trading.
Thank you see.

AUDCAD - Day trade signal by Keltner 7 Sep 2020* The signal are tested in 3,5 years. Winrate stability over 52% every year.
Risk: 1%.
* Tradingview's backtest time ~ 3.5 years/Premium account, differs between currency pairs (Cryto is the default backtest time is shorter because the market is open both Saturday and Sunday: about 2 years)
- Base on order: 2 ways to enter or combine both.
Method 1
+ Keltner channel: the price closed above or below Upper / Lower Keltner for signal 1. Wait for the price to adjust to the Basis line, then enter the order.
Method 2
+ Keltner channel: price closes above or below Upper 2 / Lower 2 Keltner gives signal 1. Wait for the price to adjust to Upper / Lower line, then enter the order.
Method 3: combine both, priority 1 if satisfied conditions
+ Pivot option: appear rising signal: Higher High / Higher Low. Decline signal: Lower Low / Lower High for signal 2.
- When the above conditions are met, the Indicator shows a Buy / Sell signal according to the trend.
-----------------------------------
- Stoploss: Calculated from the entry point + - actual fluctuation by the formula ATR (20) * risk ratio (risk).
- Profit: Calculated from the entry point of the command + - actual oscillation using ATR formula (20) * reward ratio (reward).
- Profit: Look the Summary below.
- Should be backtest 3 Years (long term), each Year (medium term) and Quarter or 6 months (short term). If each year the success rate is always more than 50%, can be used for actual trading

EURJPY Potential Bearish Gartley Pattern- Fractal diagonal resistance is broken.
- Horizontal resistance at 121.000
- Bearish Gartley and Short Setup as described.
- Targets will be updated according to the D.
Good Luck

CRUDE Oil Short Opportunity: Bearish Flag Stocks and Oil opened lower after jump in coronavirus cases in China & U.S
The bearish flag is broken and Bullish Bat is set on the target.
Good Luck!


AUDCHF Potential Bearish Flag And Short OpportunityWait for the breakout of the flag to enter the trade.
Good Luck