ROSE/USDT - Trend Reversal or Bearish Continuation?ROSE/USDT remains in a medium- to long-term bearish structure, characterized by a clear sequence of lower highs and lower lows since the late-2024 peak. Price is currently reacting around the historical demand zone at 0.0167 – 0.0144, which previously acted as an accumulation area before a major breakdown.
The 2D timeframe confirms that this move is not short-term noise, but a key structural phase.
---
Structure & Technical Pattern
1. Descending Trendline (Major Resistance)
The descending trendline is drawn from the ATH around 0.14 through subsequent lower highs.
Price is testing the trendline from below, indicating a resistance retest, not a confirmed breakout.
2. Breakdown – Retest Structure
Price previously experienced a strong breakdown below the 0.023–0.020 zone.
After forming a lower low near 0.0098, price bounced and is now retesting the former supply area (yellow box).
3. Yellow Zone (0.0167 – 0.0144)
This zone is critical because:
It represents former support turned resistance
It was a consolidation area before further distribution
It acts as a decision zone between structural reversal and bearish continuation
---
Key Levels
Resistance:
0.0167 – 0.0180 (yellow zone + trendline)
0.0230
0.0300
0.0340
0.0420
Support:
0.0144 (lower boundary of the yellow zone)
0.0120
0.0098 (major low / last demand)
---
Bullish Scenario
Primary conditions:
A strong daily/2D close above 0.0180
Break and hold above the descending trendline
Bullish confirmation:
Formation of a higher low above 0.0144
Increasing volume during the breakout
Upside targets:
0.0230
0.0300
0.0340
0.0420 (next major resistance)
Bullish meaning: Such a breakout would signal the end of the prolonged bearish channel and open the door for a medium-term trend reversal.
---
Bearish Scenario
If price fails at the yellow zone:
Rejection or long upper wicks around 0.0167–0.0180
Price closes back below 0.0144
Downside targets:
0.0120
0.0098 (previous low)
Extended bearish risk:
A breakdown below 0.0098 would lead to bearish continuation and downside price discovery
The broader downtrend remains intact
---
Conclusion
ROSE/USDT is currently trading within a major decision area.
The 0.0167 – 0.0144 zone represents a critical battle zone between buyers and sellers.
Break and hold above the trendline → reversal potential
Rejection at the yellow zone → pullback before further downside
Waiting for candle confirmation is essential, rather than anticipating direction inside the zone.
#ROSEUSDT #ROSE #CryptoAnalysis #Altcoin #DescendingTrendline #BreakoutOrReject #SupplyDemand #Downtrend #TrendReversal
Roseusdtlong

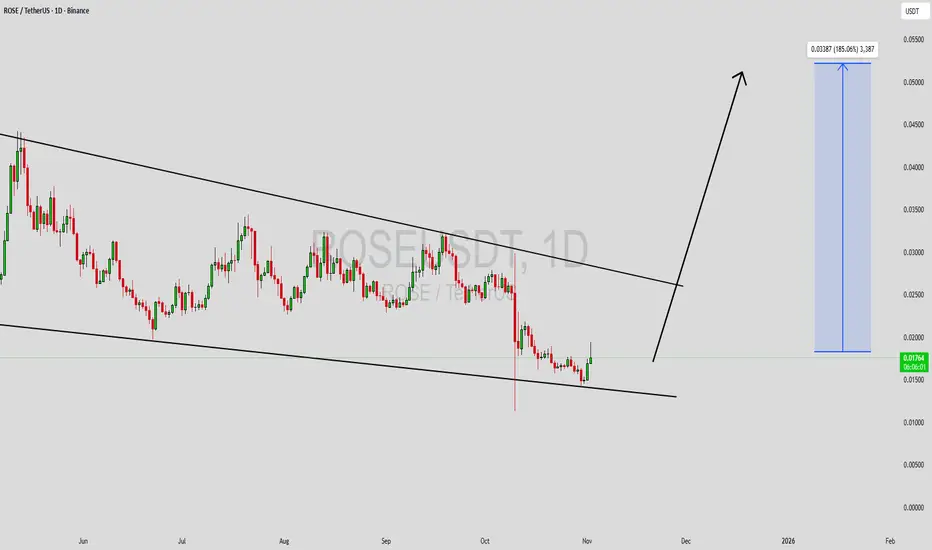
ROSEUSDT Forming Falling WedgeROSEUSDT is forming a clear falling wedge pattern, a classic bullish reversal signal that often indicates an upcoming breakout. The price has been consolidating within a narrowing range, suggesting that selling pressure is weakening while buyers are beginning to regain control. With consistent volume confirming accumulation at lower levels, the setup hints at a potential bullish breakout soon. The projected move could lead to an impressive gain of around 140% to 150% once the price breaks above the wedge resistance.
This falling wedge pattern is typically seen at the end of downtrends or corrective phases, and it represents a potential shift in market sentiment from bearish to bullish. Traders closely watching ROSEUSDT are noting the strengthening momentum as it nears a breakout zone. The good trading volume adds confidence to this pattern, showing that market participants are positioning early in anticipation of a reversal.
Investors’ growing interest in ROSEUSDT reflects rising confidence in the project’s long-term fundamentals and current technical strength. If the breakout confirms with sustained volume, this could mark the start of a fresh bullish leg. Traders might find this a valuable setup for medium-term gains, especially as the wedge pattern completes and buying momentum accelerates.
✅ Show your support by hitting the like button and
✅ Leaving a comment below! (What is your opinion about this Coin?)
Your feedback and engagement keep me inspired to share more insightful market analysis with you!

ROSEUSDT — Major Turning Point: Will the Downtrend Finally BreakAfter months of consistent decline, ROSE is now facing a critical moment — testing the descending trendline that has capped every rally since late 2024.
A strong rebound from the liquidity sweep around 0.0113 USDT suggests that selling pressure is fading and buyers are starting to show strength at the bottom. However, the descending yellow trendline remains the psychological barrier that separates a potential reversal from another failed rally.
Pattern & Structure
ROSE has maintained a clear sequence of lower highs and lower lows, reflecting sustained bearish control.
Currently, the price is attempting to challenge the upper boundary of this structure — a moment that could define the next macro direction.
If a breakout occurs and price closes a 2D candle above the trendline with strong volume, it would mark the first structural shift toward a mid-term bullish phase.
Failure to do so would confirm the trendline as strong resistance once again, and the downtrend could resume.
---
📈 Bullish Scenario
Confirmation: A decisive 2D close above the descending trendline with notable volume.
Upside Targets: 0.030 → 0.0345 → 0.0435 → 0.0610.
Narrative: A breakout could trigger a short-covering rally and shift sentiment toward accumulation, setting the stage for a larger move to the upside.
---
📉 Bearish Scenario
Confirmation: Rejection from the trendline or failure to sustain above 0.025.
Downside Targets: 0.017 → 0.0113 (liquidity retest).
Narrative: A failed breakout would signal continued weakness, keeping ROSE trapped in a broader bearish continuation pattern.
---
Conclusion
ROSE is standing at a make-or-break zone.
A confirmed breakout above the descending trendline could redefine the market structure and open the path toward recovery — but rejection here would reinforce the dominant downtrend and expose lower supports again.
> This is a critical decision point — the next few candles could decide whether ROSE begins a true reversal or sinks back into the depths of its downtrend.
#ROSE #ROSEUSDT #OasisNetwork #CryptoAnalysis #TechnicalAnalysis #BreakoutSetup #CryptoTrading #TrendlineBreak #TradingViewCommunity #AltcoinSetup

ROSEUSDT Forming Falling WedgeROSEUSDT is currently exhibiting a classic falling wedge pattern, a bullish technical setup that often precedes a strong trend reversal. This formation indicates that the downward momentum is losing strength, and buyers are gradually stepping back into the market. The narrowing price action within the wedge suggests that a breakout could be imminent, supported by consistent volume, which adds further credibility to the bullish outlook. With an expected gain of around 140% to 150%, ROSEUSDT is showing strong potential for a significant upside move in the near term.
The falling wedge pattern on ROSEUSDT highlights a period of market consolidation where sellers are becoming exhausted and demand is building up. This structure typically acts as a springboard for upward breakouts once price closes above the resistance trendline. The current market sentiment toward ROSEUSDT is increasingly positive, reflecting renewed investor confidence and growing institutional interest. These conditions together create an ideal environment for a bullish breakout and a possible trend continuation.
As ROSEUSDT continues to attract attention from traders and investors, the growing volume and improving technical structure could signal the beginning of a strong recovery phase. If the breakout is confirmed with solid volume and sustained buying pressure, the price could accelerate quickly toward new resistance zones, delivering impressive returns. This setup makes ROSEUSDT one of the more compelling altcoin opportunities currently available in the market.
✅ Show your support by hitting the like button and
✅ Leaving a comment below! (What is You opinion about this Coin)
Your feedback and engagement keep me inspired to share more insightful market analysis with you!
ROSE/USDT — at the Fibonacci Demand Zone, Will Buyers Hold?Overview
ROSE is at a critical juncture. After months of sideways movement since March, the price is once again testing the strong demand zone at 0.02696 – 0.02616, perfectly aligned with the Fibonacci 0.5–0.618 retracement. This zone is not just numbers on the chart—it’s the real battlefield between buyers defending structure and sellers pushing for a breakdown back to the range lows.
---
Price Structure & Pattern
Mid-term sideways: ROSE has been trapped within a broad 0.019 – 0.046 range, indicating long accumulation/distribution phases.
Demand zone (yellow): The 0.026–0.027 region has acted multiple times as a launchpad for rallies. Fibonacci confluence makes it even stronger.
Layered resistances: Price faces a “ladder” of resistances at 0.03029 → 0.03238 → 0.03665 → 0.04238 → 0.04574 → 0.04696. Each level is a checkpoint for the bullish momentum.
---
Bullish Scenario
1. Successful rebound at demand: If daily candles hold above 0.02616, a new higher low could be confirmed.
2. Break confirmation: A daily close above 0.03029 signals early bullish momentum; stronger confirmation comes above 0.03238 with volume.
3. Upside targets:
0.03665 (key structural resistance)
0.04238 (upper range expansion)
0.04574–0.04696 (previous range high, potential breakout zone)
From the demand zone, the upside potential is +70% if 0.04696 is retested.
---
Bearish Scenario
1. Breakdown risk: A decisive close below 0.02616 would destroy the bullish setup and invalidate the demand.
2. Downside target: Price could drop toward 0.01917, a ~30% decline from current levels.
3. Fakeout risk: A short dip below 0.026 before pumping back up is possible, so volume confirmation is crucial to avoid traps.
---
Takeaway & Insights
The 0.026–0.027 zone is the most important area for ROSE in the coming weeks. As long as it holds, bulls maintain the upper hand.
A breakout > 0.03238 is the catalyst that could invite strong momentum buying.
On the flip side, a breakdown < 0.02616 could extend the range lower to 0.019.
For swing traders, this is a low-risk accumulation zone with high-reward potential, but strict risk management is mandatory.
---
ROSE is retesting the critical demand zone at 0.026–0.027 (Fibonacci 0.5/0.618 confluence). This area has repeatedly acted as a strong support and rally base. As long as it holds, bullish scenarios remain valid with targets at 0.032 → 0.036 → 0.042 → 0.046.
A breakdown below 0.02616, however, could trigger a drop toward 0.019.
The market is now watching closely: will buyers defend this zone again, or will sellers seize control?
Strategy: Look for buy-the-dip opportunities at demand with tight stops, or wait for a confirmed breakout above 0.03238 for safer long entries.
Note: This range offers big potential, but disciplined risk management is the key.
---
#ROSE #ROSEUSDT #OasisNetwork #CryptoAnalysis #Altcoins #PriceAction #SupportResistance #Fibonacci #CryptoTrading

Rose is cooking something!First, let's take a look at the BINANCE:ROSEUSDT market trend.
Right now, we're chilling near its all-time low (ATL). The price has found great support in this zone multiple times, which has pushed it up towards the descending trendline that's acting as resistance.
We've got two resistance trendlines: the main one, and what I call a "micro" one. The price has to break this micro one before it can even think about tackling the main one, and we've already seen a few failed attempts.
So, we can either wait and see if this recent pump breaks that descending trendline or if it gets rejected and falls back to the support line I've drawn. If it drops, that's a good place to buy in. The other option is to enter a long position after a confirmed breakout of the descending line.
Either way, I'm expecting a major move to the upside in the next few weeks.
Please do your own research !

ROSE/USDT — Critical Demand Zone to Define the Next Big Move!🔎 Full Analysis
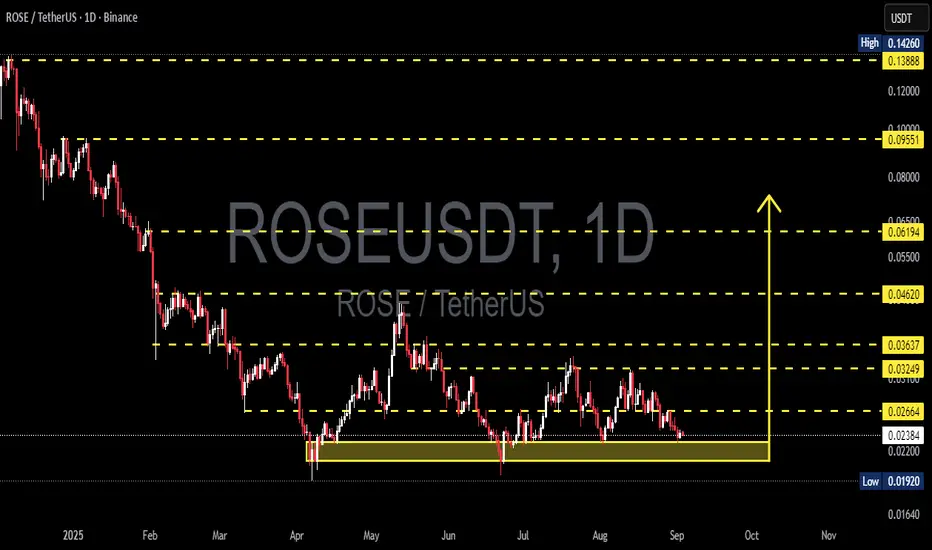
ROSE/USDT is currently trading inside a critical demand zone (0.01920 – 0.02388) that has been tested multiple times since April 2025. This area has acted as a foundation of support, holding back heavy selling pressure for months. The more often this zone gets tested, the higher the probability of a major move — either a strong rebound or a deep breakdown.
Structurally, ROSE remains in a medium-term downtrend, shown by a series of lower highs and lower lows since early 2025. However, the market is now showing early signs of accumulation, as price is no longer printing significant new lows since June, but instead consolidating around the same support zone.
🟢 Bullish Scenario
A bounce from demand followed by a breakout above 0.02664 on strong daily close would be the first bullish confirmation.
A stronger signal comes with a break above 0.03249, which could open the way toward higher resistances: 0.03637 → 0.04620 → 0.06194.
Even a move from support to the first resistance already offers +36% upside, with potential for +150% to +300% if momentum extends further.
🔴 Bearish Scenario
Failure to hold the demand zone and a daily close below 0.01920 would flip the structure bearish.
Such a breakdown could trigger a sell-off wave, as long-term support collapses and the market seeks lower liquidity levels.
Downside risk from current price is about −20% or more, depending on where the next support is established.
📌 Chart Patterns & Key Levels
Demand Zone Retest: Yellow zone remains the key accumulation area.
Range Accumulation: Possible Wyckoff accumulation phase if breakout occurs to the upside.
Key Levels to Watch: 0.02664 (minor resistance), 0.03249 (major resistance), 0.01920 (last line of support).
📈 Notes for Traders
Aggressive Buyers: may accumulate near demand with a tight stop below 0.0190.
Conservative Traders: wait for a confirmed breakout above 0.02664 or 0.03249 to reduce false signal risk.
Risk Management: use smaller positions in high-risk zones. Aim for at least 1:2 risk-to-reward ratio when planning trades.
---
📝 Conclusion
ROSE is standing at a make-or-break level that will define the next major trend.
Bullish case: demand holds → rally potential toward 0.0325–0.0462 in the mid-term.
Bearish case: breakdown below 0.0192 → market could drop deeper to search for new support.
With price sitting at a crucial level, traders should watch volume spikes, rejection candles, and breakout confirmations closely — the market seems ready for a decisive move.
#ROSE #ROSEUSDT #Oasis #AltcoinAnalysis #CryptoTrading #SupportResistance #TechnicalAnalysis #Breakout #DemandZone #PriceAction
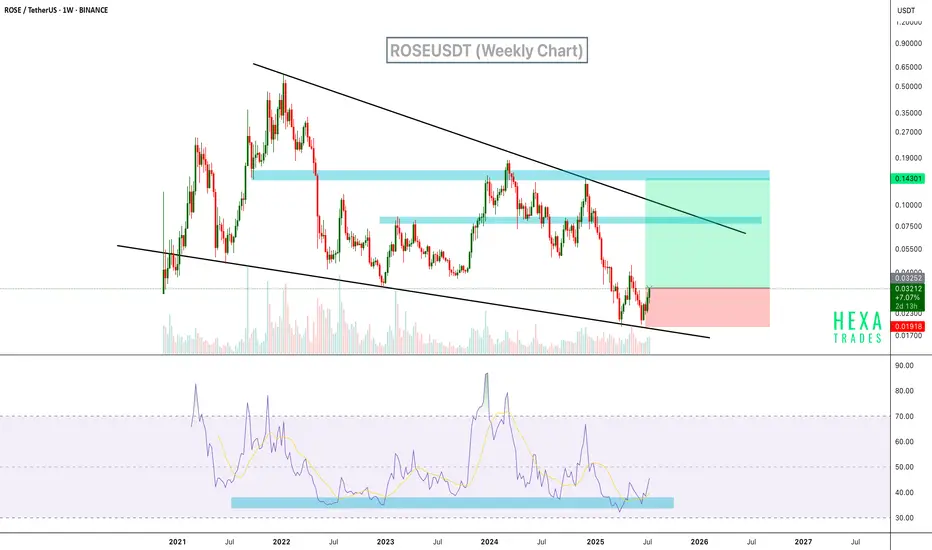
ROSEUSDT Rebounds from Wedge Support BINANCE:ROSEUSDT is currently trading within a long-term descending wedge on the weekly chart, a classic bullish reversal pattern. Price recently bounced off the lower wedge support with strong momentum. Additionally, the RSI indicator has rebounded from a historically strong support zone in the oversold region, which has previously signaled major bottoms.
Resistance 1: $0.048
Resistance 2: $0.075
Resistance 3: $0.145
Cheers
Hexa
ROSEUSDT Forming Descending TriangleROSEUSDT is showing a promising setup for traders keeping an eye on high potential breakouts. The pair has formed a clear descending triangle pattern, which often acts as a reliable continuation or reversal signal depending on where the breakout occurs. With trading volume staying healthy and steady, the conditions are aligning for a potential sharp move to the upside that could deliver an impressive 90% to 100% gain if momentum builds up as expected.
Oasis Network (ROSE) has been drawing investor interest recently thanks to its strong focus on privacy-first and scalable decentralized finance solutions. As the market shifts back towards Layer 1 blockchain projects that deliver real-world use cases, ROSE stands out for its unique mix of confidential smart contracts and data privacy tools. This fundamental strength is likely to keep investor sentiment bullish, providing extra fuel to any technical breakout from the descending triangle pattern.
For technical traders, the key level to watch will be the breakout line at the top of the triangle. A confirmed breakout with increased buying volume could trigger significant upward momentum. It’s important to have a clear risk management plan in place, as descending triangles can sometimes produce fakeouts before the true direction unfolds. Keeping an eye on daily closing candles and volume spikes will be essential for capturing the best possible entry.
✅ Show your support by hitting the like button and
✅ Leaving a comment below! (What is You opinion about this Coin)
Your feedback and engagement keep me inspired to share more insightful market analysis with you!

ROSE/USDT Descending Triangle Breakout – Trend Reversal📊 Pattern Analysis – Descending Triangle at the End of Downtrend
ROSE/USDT has been forming a descending triangle pattern since late December 2024. This pattern features:
🔽 Downward sloping resistance: A descending trendline tested multiple times (5+ touches), showing strong validity.
🔲 Horizontal support zone: Price has held firm between $0.02200 - $0.02400, acting as a key demand area since March 2025.
Although descending triangles are often continuation patterns, in this context — appearing after a long-term downtrend — it increases the probability of a bullish reversal if the breakout confirms.
🚀 Bullish Scenario – Potential for Strong Rebound
If ROSE breaks above the descending trendline:
✅ Breakout Confirmation: Daily candle close above $0.02600 - $0.02800 with strong volume
📈 Bullish Targets (based on previous resistance zones & pattern projection):
$0.03140 – Minor resistance and former structure
$0.03477 – Previous high from May 2025
$0.04222 – February consolidation range
$0.04700 – Key prior distribution zone
$0.06191 – Primary target from triangle breakout (measured move)
$0.08453 and above – Potential extended rally if strong momentum follows
The reward-to-risk ratio is highly favorable on confirmation of a breakout.
🧨 Bearish Scenario – Breakdown Threat Looms
If ROSE fails to break out and instead closes below the horizontal support at $0.02200:
⚠️ This would signal a bearish continuation
📉 Potential drop to:
$0.01920 – The current multi-month low (key support level)
Breakdown of this level would mark a new lower low, confirming ongoing bearish trend
Caution is advised if volume increases during a breakdown.
🔍 Technical Insights:
Price is squeezing at the apex of the triangle — a breakout is imminent
Volume is still relatively low, suggesting accumulation or indecision
A volume spike will likely precede a confirmed breakout move
Market is at a decision point — either a trend reversal or continuation
🧠 Conclusion:
ROSE/USDT is on the edge of a major move. The descending triangle has matured, and a breakout in either direction could trigger a significant price reaction. Traders should monitor this setup closely as the breakout may occur within days.
#ROSEUSDT #CryptoBreakout #DescendingTriangle #TechnicalAnalysis #AltcoinSetup #ChartPattern #CryptoTrading #BullishReversal #BearishScenario #PriceAction #BreakoutAlert

#ROSE/USDT#ROSE
The price is moving within a descending channel on the 1-hour frame and is expected to break and continue upward.
We have a trend to stabilize above the 100 moving average once again.
We have a downtrend on the RSI indicator that supports the upward move with a breakout.
We have a support area at the lower limit of the channel at 0.02800, which acts as strong support from which the price can rebound.
Entry price: 0.03023
First target: 0.03100
Second target: 0.03200
Third target: 0.03300

#ROSE Bouncing from Key Demand Zone!#ROSE Bouncing from Key Demand Zone!
ROSE just tested a strong support area and is showing signs of reversal. RSI is recovering from oversold levels—momentum could be shifting!
🔹 Current Price: $0.031
🔹 First Target: $0.05
Could this be the start of a major uptrend?
Retweet if you're bullish!
#Crypto #Altcoins

ROSEUSDT 1WROSE ~ 1W Analysis
#ROSE This is the lowest support for now. Buy from here if you still have a Conviction on this coin with a minimum target of 20%+.

ROSE/USDT Price Breakout: Bullish Continuation in PlayROSE/USDT pair has successfully broken above a key descending trendline, signaling a potential bullish reversal.
The price has reclaimed the $0.08-$0.09 support zone, which is now acting as a strong base for further upward movement.
DYOR, NFA

ROSEUSDT: Catching the Retracement for a Potential Big Move!!ROSEUSDT has shown promising signs of a potential bullish continuation. After a successful bounce from a major support level, the price consolidated briefly before a strong breakout yesterday, pushing through resistance. Today's retracement to the broken resistance level (now acting as support) presents a potential entry opportunity for traders. Always manage your risk and use appropriate position sizing.
BINANCE:ROSEUSDT Currently trading at $0.092
Buy level: Above $0.09
Stop loss: Below $0.076
Target : $0.18
Max Leverage 3x
Always keep Stop loss
Follow Our Tradingview Account for More Technical Analysis Updates, | Like, Share and Comment Your thoughts

ROSEUSDT 1WROSE ~ 1W
#ROSE Again rejected from this resistance line. If you still have Conviction on this coin,. This support block would be a very good buying place for now.

#ROSE/USDT Ready to go higher#ROSE
The price is moving in a descending channel on the 30-minute frame and sticking to it well
We have a bounce from the lower limit of the descending channel, this support is at 0.1254
We have a downtrend on the RSI indicator that is about to be broken, which supports the rise
We have a trend to stabilize above the moving average 100
Entry price 0.1290
First target 0.1343
Second target 0.1387
Third target 0.14424

#ROSE/USDT Ready to go up#ROSE
The price is moving in a descending channel on the 1-hour frame and sticking to it well
We have a bounce from the lower limit of the descending channel, this support is at 0.07342
We have a downtrend, the RSI indicator is about to break, which supports the rise
We have a trend to stabilize above the moving average 100
Entry price 0.07588
First target 0.07983
Second target 0.08522
Third target 0.090258

ROSEUSDT Bullish Channel Breakout!ROSEUSDT Technical analysis update
BINANCE:ROSEUSDT has formed a descending channel, and the price is now moving toward the channel resistance for a potential breakout. The price is trading above the 100 and 200 EMAs on the daily chart, indicating a bullish signal. A breakout above the channel could lead to a strong upward move.
Entry level: Below $0.086
Stop Loss: $0.068
Regards
Hexa

ROSEUSDT Bounces Back, Targeting $0.10 After Strong Support TestAfter successfully testing key support levels, ROSE/USDT is showing bullish momentum as it begins to bounce back. With strong buying interest emerging, the price action suggests a potential rally towards the $0.10 mark. Traders should watch for confirmation of this trend, as further upward movement could present profitable opportunities.
ROSEUSDT Currently trading at $0.069
Buy level: Above $0.069
Stop loss: Below $0.0615
TP1: $0.072
TP2: $0.082
TP3: $0.09
TP4: $0.1
Max Leverage 5x
Follow Our Tradingview Account for More Technical Analysis Updates, | Like, Share and Comment Your thoughts

ROSE/USDT: Potential Big Breakout LoadingThe ROSE/USDT pair is showing signs of a breakout on the daily timeframe. If the breakout is successful, I anticipate a strong bullish movement of 50-100% in the coming days.
Remember, this is not financial advice—always do your own research (DYOR) before making any trades.

ROSEUSDTROSE ~ 1W ✅
#ROSE Make purchases gradually after breaking through the resistance line of this descending pattern.
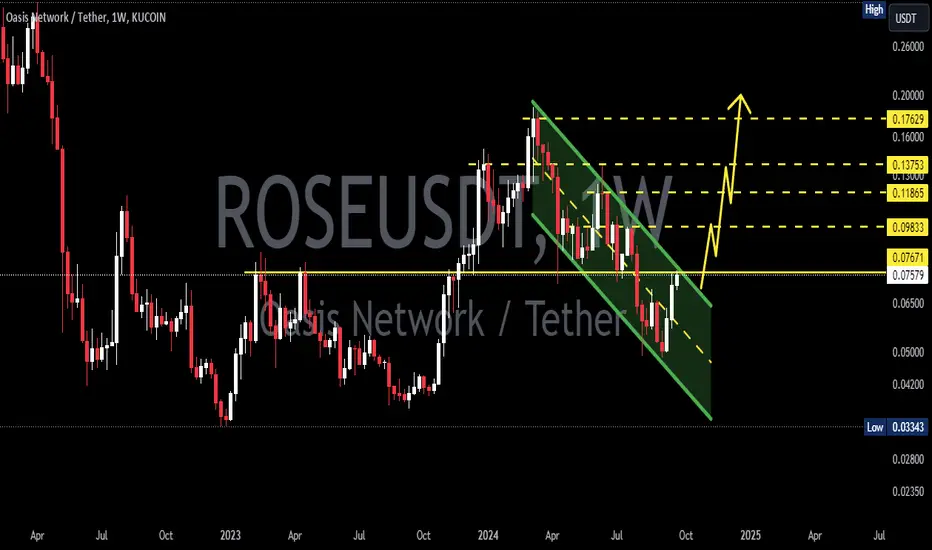
Considering 5x potential move on ROSE!As you can see BINANCE:ROSEUSDT made a move with huge potential early this year. There are a few factors that I loved to see and consider the long-term position of this coin. BINANCE:ROSEUSDT made a higher high last March, MACD is making a huge divergence and now I think we found a new higher low around the 0.05 area. There are a few crucial zones to break to make a higher high. BINANCE:ROSEUSDT must close a candle above the first resistance zone (1) in a weekly TF. The second resistance zone (2) is around 0.117 which is a very crucial zone and can decide if we can break the last high or not. The first 4 orange areas are minor TP points, in the long run, we are aiming for 0.35.
