ROSE/USDT - Trend Reversal or Bearish Continuation?ROSE/USDT remains in a medium- to long-term bearish structure, characterized by a clear sequence of lower highs and lower lows since the late-2024 peak. Price is currently reacting around the historical demand zone at 0.0167 – 0.0144, which previously acted as an accumulation area before a major breakdown.
The 2D timeframe confirms that this move is not short-term noise, but a key structural phase.
---
Structure & Technical Pattern
1. Descending Trendline (Major Resistance)
The descending trendline is drawn from the ATH around 0.14 through subsequent lower highs.
Price is testing the trendline from below, indicating a resistance retest, not a confirmed breakout.
2. Breakdown – Retest Structure
Price previously experienced a strong breakdown below the 0.023–0.020 zone.
After forming a lower low near 0.0098, price bounced and is now retesting the former supply area (yellow box).
3. Yellow Zone (0.0167 – 0.0144)
This zone is critical because:
It represents former support turned resistance
It was a consolidation area before further distribution
It acts as a decision zone between structural reversal and bearish continuation
---
Key Levels
Resistance:
0.0167 – 0.0180 (yellow zone + trendline)
0.0230
0.0300
0.0340
0.0420
Support:
0.0144 (lower boundary of the yellow zone)
0.0120
0.0098 (major low / last demand)
---
Bullish Scenario
Primary conditions:
A strong daily/2D close above 0.0180
Break and hold above the descending trendline
Bullish confirmation:
Formation of a higher low above 0.0144
Increasing volume during the breakout
Upside targets:
0.0230
0.0300
0.0340
0.0420 (next major resistance)
Bullish meaning: Such a breakout would signal the end of the prolonged bearish channel and open the door for a medium-term trend reversal.
---
Bearish Scenario
If price fails at the yellow zone:
Rejection or long upper wicks around 0.0167–0.0180
Price closes back below 0.0144
Downside targets:
0.0120
0.0098 (previous low)
Extended bearish risk:
A breakdown below 0.0098 would lead to bearish continuation and downside price discovery
The broader downtrend remains intact
---
Conclusion
ROSE/USDT is currently trading within a major decision area.
The 0.0167 – 0.0144 zone represents a critical battle zone between buyers and sellers.
Break and hold above the trendline → reversal potential
Rejection at the yellow zone → pullback before further downside
Waiting for candle confirmation is essential, rather than anticipating direction inside the zone.
#ROSEUSDT #ROSE #CryptoAnalysis #Altcoin #DescendingTrendline #BreakoutOrReject #SupplyDemand #Downtrend #TrendReversal
ROSEUSDTPERP

ROSEUSDT — Major Turning Point: Will the Downtrend Finally BreakAfter months of consistent decline, ROSE is now facing a critical moment — testing the descending trendline that has capped every rally since late 2024.
A strong rebound from the liquidity sweep around 0.0113 USDT suggests that selling pressure is fading and buyers are starting to show strength at the bottom. However, the descending yellow trendline remains the psychological barrier that separates a potential reversal from another failed rally.
Pattern & Structure
ROSE has maintained a clear sequence of lower highs and lower lows, reflecting sustained bearish control.
Currently, the price is attempting to challenge the upper boundary of this structure — a moment that could define the next macro direction.
If a breakout occurs and price closes a 2D candle above the trendline with strong volume, it would mark the first structural shift toward a mid-term bullish phase.
Failure to do so would confirm the trendline as strong resistance once again, and the downtrend could resume.
---
📈 Bullish Scenario
Confirmation: A decisive 2D close above the descending trendline with notable volume.
Upside Targets: 0.030 → 0.0345 → 0.0435 → 0.0610.
Narrative: A breakout could trigger a short-covering rally and shift sentiment toward accumulation, setting the stage for a larger move to the upside.
---
📉 Bearish Scenario
Confirmation: Rejection from the trendline or failure to sustain above 0.025.
Downside Targets: 0.017 → 0.0113 (liquidity retest).
Narrative: A failed breakout would signal continued weakness, keeping ROSE trapped in a broader bearish continuation pattern.
---
Conclusion
ROSE is standing at a make-or-break zone.
A confirmed breakout above the descending trendline could redefine the market structure and open the path toward recovery — but rejection here would reinforce the dominant downtrend and expose lower supports again.
> This is a critical decision point — the next few candles could decide whether ROSE begins a true reversal or sinks back into the depths of its downtrend.
#ROSE #ROSEUSDT #OasisNetwork #CryptoAnalysis #TechnicalAnalysis #BreakoutSetup #CryptoTrading #TrendlineBreak #TradingViewCommunity #AltcoinSetup

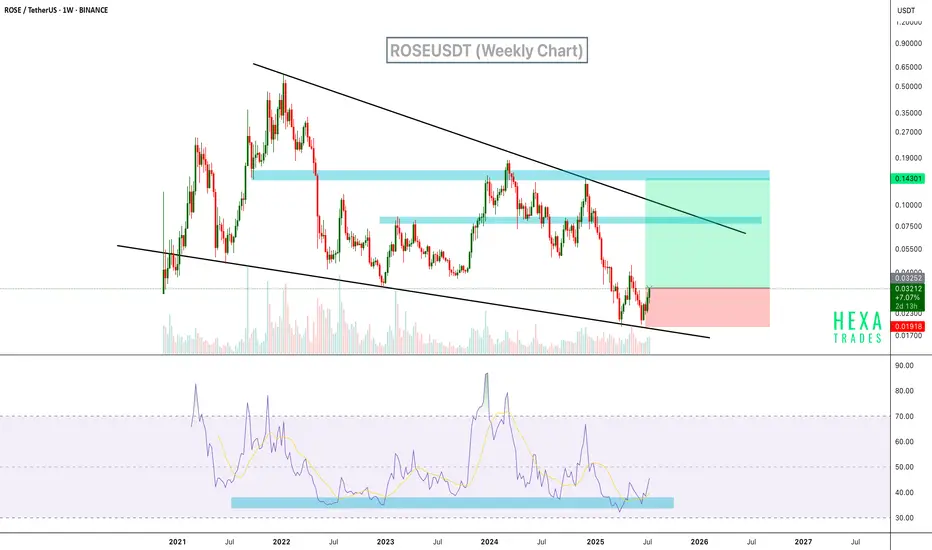
ROSEUSDT Rebounds from Wedge Support BINANCE:ROSEUSDT is currently trading within a long-term descending wedge on the weekly chart, a classic bullish reversal pattern. Price recently bounced off the lower wedge support with strong momentum. Additionally, the RSI indicator has rebounded from a historically strong support zone in the oversold region, which has previously signaled major bottoms.
Resistance 1: $0.048
Resistance 2: $0.075
Resistance 3: $0.145
Cheers
Hexa
ROSEUSDT 1WROSE ~ 1W Analysis
#ROSE This is the lowest support for now. Buy from here if you still have a Conviction on this coin with a minimum target of 20%+.

ROSEUSDT: Catching the Retracement for a Potential Big Move!!ROSEUSDT has shown promising signs of a potential bullish continuation. After a successful bounce from a major support level, the price consolidated briefly before a strong breakout yesterday, pushing through resistance. Today's retracement to the broken resistance level (now acting as support) presents a potential entry opportunity for traders. Always manage your risk and use appropriate position sizing.
BINANCE:ROSEUSDT Currently trading at $0.092
Buy level: Above $0.09
Stop loss: Below $0.076
Target : $0.18
Max Leverage 3x
Always keep Stop loss
Follow Our Tradingview Account for More Technical Analysis Updates, | Like, Share and Comment Your thoughts

ROSE, Where are you going?Hello, guys.
This is ESS team.
Let's check the ROSE chart.
:::::::::::::::::
This is ROSEUSDT's 1H chart.
Now, ROSE is showing a falling Price Action while lowering the recent highs and lows.
If it breaks down the 4H's uptrend line or order block zone and is retested at these, You can expect candles make a new low.
If it is supported by 4H's uptrend line and rise up,
You can safely enter a long position when It breaks through the GREEN downtrend line.
Have a nice trading!

ROSEUSDTBINANCE:ROSEUSDT Short idea
⛔"Daily crypto market analyses I provide are personal opinions & not financial advice. Trading carries risks, so do your own research & seek advisor's help. #DYOR
Don't forget to 🚀 and comment

roseusdtperpid expect free fall on this tricker. as adx and macd curling down
supports levels at 0.05650, 0.050 (targets).

Buy the ROSEHello traders!
Welcome back to another trade with Analyst Aadil1000x.
Today we are setting a limit at A1000x true reversal point in Rose.
Rose Buy Limit 0.03517
Stoploss 0.03480(-1%)
Target 1, 0.03567(+1.4%)
Final Target 0.0363(+3.2%)
Don't forget to hit the like button and follow to stay connected

🔴 ROSEUSDT - 1H (30.09.2022)🔴 ROSEUSDT
TF: 1H
Side: Short
SL: $0.06264
TP 1: $0.06141
TP 2: $0.06065
TP 3: $0.06003
ROSEUSDT looking to pull back a bit.
RShort

ROSEUSDT 4H BIG PUMP (LONG)Rose is forming a bullish falling wedge pattern. Breaking the above trendline It will as high as 0.18.
BUY: 0.062-0.063
SELL: 0.0925-0.1175-0.1435-0.180
Big Resistance: 0.183-0.189
Big Support: 0.060-0.0625

