RSRUSDT Forming Falling WedgeRSRUSDT is forming a clear falling wedge pattern, a classic bullish reversal signal that often indicates an upcoming breakout. The price has been consolidating within a narrowing range, suggesting that selling pressure is weakening while buyers are beginning to regain control. With consistent volume confirming accumulation at lower levels, the setup hints at a potential bullish breakout soon. The projected move could lead to an impressive gain of around 190% to 200% once the price breaks above the wedge resistance.
This falling wedge pattern is typically seen at the end of downtrends or corrective phases, and it represents a potential shift in market sentiment from bearish to bullish. Traders closely watching RSRUSDT are noting the strengthening momentum as it nears a breakout zone. The good trading volume adds confidence to this pattern, showing that market participants are positioning early in anticipation of a reversal.
Investors’ growing interest in RSRUSDT reflects rising confidence in the project’s long-term fundamentals and current technical strength. If the breakout confirms with sustained volume, this could mark the start of a fresh bullish leg. Traders might find this a valuable setup for medium-term gains, especially as the wedge pattern completes and buying momentum accelerates.
✅ Show your support by hitting the like button and
✅ Leaving a comment below! (What is your opinion about this Coin?)
Your feedback and engagement keep me inspired to share more insightful market analysis with you!
RSRUSDT

RSRUSDT UPDATERSR
UPDATE
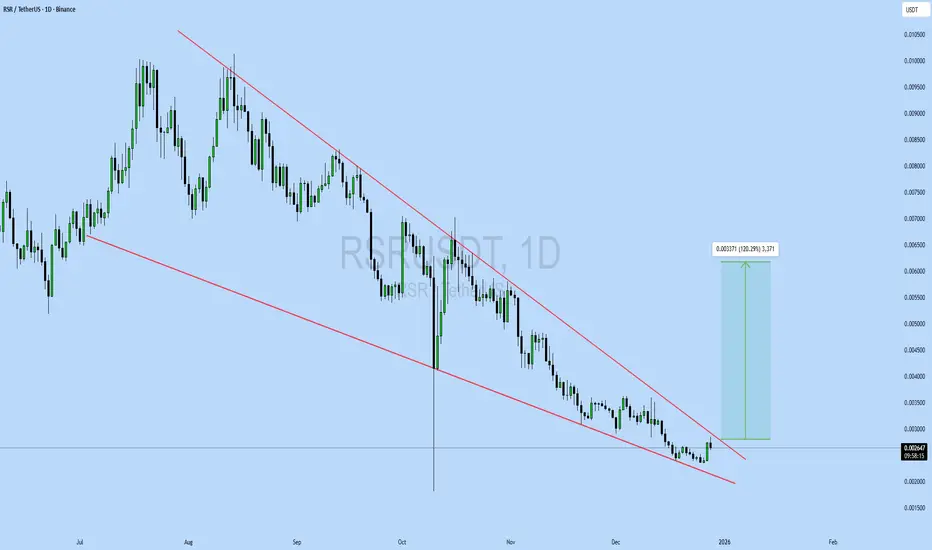
RSR Technical Setup
Pattern: Falling Wedge Pattern
Current Price: $0.00275
Target Price: $0.02500
Target % Gain: 120.09%
Technical Analysis: RSR is showing signs of breaking out of a falling wedge pattern on the 1D chart, indicating bullish potential if the resistance trendline is decisively taken out. The current price action looks to be consolidating near support before a breakout attempt, and increasing volume during upward moves will be key to validating continuation toward the higher target zone.
Time Frame: 1D
Risk Management Tip: Always use proper risk management.
#RSR/USDT Bullish Reversal in MAGICUSDT Accumulation#RSR
The price is moving in a descending channel on the 1-hour timeframe. It has reached the lower boundary and is heading towards breaking above it, with a retest of the upper boundary expected.
We have a downtrend on the RSI indicator, which has reached near the lower boundary, and an upward rebound is expected.
There is a key support zone in green at 0.002534. The price has bounced from this level multiple times and is expected to bounce again.
We have a trend towards consolidation above the 100-period moving average, as we are moving close to it, which supports the upward movement.
Entry price: 0.002628
First target: 0.002754
Second target: 0.002887
Third target: 0.003078
Don't forget a simple principle: money management.
Place your stop-loss below the support zone in green.
For any questions, please leave a comment.
Thank you.

RSR/USDT — Accumulation Zone: Ready Rally or Breakdown?🔎 Overview
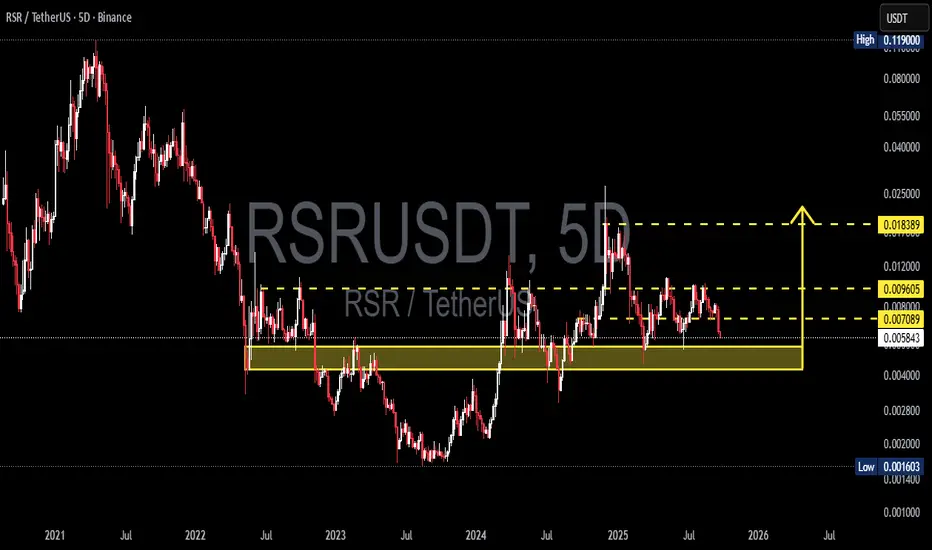
RSR is standing at a major crossroads. After enduring a prolonged downtrend (2021–2023), the token entered a strong accumulation phase and staged a notable rally in 2024. However, throughout mid-2025, the momentum stalled and price action slipped back into sideways consolidation.
Now, RSR is testing the key support zone (0.0040 – 0.0060), a level that has repeatedly acted as a battleground between bulls and bears. The outcome here will likely dictate the next major trend.
---
📊 Key Technical Levels
Primary Support (Yellow Box): 0.0040 – 0.0060 → the accumulation base.
Minor Resistance: 0.007089 → first breakout trigger.
Major Resistance: 0.009605 → confirmation of mid-term bullish momentum.
Extended Target: 0.018389 → potential rally target if sentiment flips positive.
Risk Zone: 0.001603 → historical low if breakdown occurs.
---
📈 Bullish Scenarios
1. Bounce from Support (Conservative)
Price holds above 0.0058–0.006.
5D close above 0.007089 with rising volume.
Targets: 0.0096 → 0.0183.
Strategy: Enter near support, scale out profits, set SL below 0.004.
2. Aggressive Breakout
Direct breakout above 0.0096 with strong 5D candle.
Mid-term bullish confirmation.
Targeting 0.0183 with potential for a bigger swing.
📌 Narrative: If RSR holds this accumulation zone, the market could treat it as the “last cheap zone” before a stronger rally unfolds.
---
📉 Bearish Scenarios
1. Support Breakdown
5D close below 0.0040 with heavy sell volume.
Likely retest of historical low at 0.0016.
Strategy: Exit longs, wait for re-entry at lower levels.
2. False Breakout
Price spikes above 0.0070 but fails to hold.
Quick rejection back into the range, signaling seller dominance.
📌 Narrative: A failed defense of this support could trigger a new capitulation phase, dragging RSR back toward extreme lows.
---
🌀 Pattern & Sentiment
Current structure: range-bound accumulation.
The yellow box = decision-making zone.
Market-wide sentiment (BTC & altcoins) will heavily influence whether RSR breaks higher or falls further.
---
🎯 Trading Strategies
Swing Traders: Accumulate near 0.0058–0.006 with tight SL, scale profits.
Breakout Traders: Wait for confirmed closes above 0.0070 / 0.0096.
Risk Management: Limit risk to ≤ 2–3% per trade.
---
📌 Conclusion
RSR/USDT is at a make-or-break accumulation zone.
If support holds → bullish potential toward 0.0096 and 0.0183.
If support breaks → bearish risk down to 0.0016.
This is a crucial moment for both traders and holders — the yellow box will determine the next big move.
#RSR #RSRUSDT #CryptoAnalysis #SupportResistance #AccumulationZone #BullishScenario #BearishScenario #AltcoinAnalysis
$RSRUSDT – Testing the Big Level Again
Risking some small bids here. The weekly chart has tested the 0.010 zone five times already — and often the sixth time is the charm.
Context-wise, September might be a quiet month, not expecting much immediate action. But that makes it a good time to position early.
🔑 Key level: reclaim 0.01
📈 Expectation: an easy 2x move from there
⏳ Plan: slowly scaling in, will re-evaluate once 0.01 is cleared
Sometimes the best plays are built in the quiet months before the expansion.

RSRUSDT Forming Bullish WaveRSRUSDT is exhibiting a clear bullish wave pattern on the daily chart, breaking out of its previous downtrend channel with strong momentum. This kind of technical setup often precedes a continuation rally, especially when paired with rising volume. The current breakout is supported by a steady increase in trading activity, indicating strong market interest and confidence from buyers. Based on this chart, there is potential for an 80% to 90% gain if the bullish structure continues to unfold as expected.
Reserve Rights (RSR) is a token with a unique use case, focused on stabilizing digital economies and supporting low-volatility assets. As crypto adoption grows in emerging markets, utility tokens like RSR are becoming increasingly relevant. This could be one of the reasons why investor sentiment is turning positive again, especially after a period of price consolidation and accumulation. If RSR can maintain its momentum, it may retest its previous highs or even reach new local peaks.
Traders and investors should watch key resistance levels closely while considering support re-tests for potential entries. The risk-to-reward ratio in setups like this tends to be favorable if volume remains elevated and broader market sentiment supports the move. Technical indicators such as RSI and MACD may also confirm the bullish bias in the coming sessions, further strengthening this setup’s credibility.
✅ Show your support by hitting the like button and
✅ Leaving a comment below! (What is You opinion about this Coin)
Your feedback and engagement keep me inspired to share more insightful market analysis with you!
Reserve Rights · A Rising Trend · New ATH Potential in 2025I took my time drawing this chart for you showing all the different stages of the market cycle.
We are looking at Reserve Rights (RSRUSDT) on the weekly timeframe.
Full chart
» A bear market ends with an ending diagonal pattern and final bottom.
» The reversal forms as a classic cup and handle pattern.
» The market transitions from bearish to bullish and turns green.
» Price action changes from lower highs and lower lows to higher highs and higher lows.
» RSR creates a rising channel.
» We are witnessing the start of the next advance.
» Reserve Rights is ready for a higher high and the highest prices in four years, since 2021.
Current price action
» RSRUSDT is on its fourth consecutive green week.
» In early 2024, it produced 7 consecutive weeks closing green as a minor advance.
» The correction that followed was brutal but ended as a higher low in August 2024 than a new advance, this time a total of 17 weeks rising but not all green.
» We are set to experience the last and strongest bullish wave for this RSRUSDT bullish cycle.
» It should be many times stronger compared to last two.
2025 New all-time high
» The final target for this wave can be many times higher than what is shown on the chart.
» On the chart I am showing only a very conservative target.
» I expect higher prices.
» Looks like a good pair based on TA.
Thank you for reading.
Namaste.

RSR/USDT Breakout Play – Approaching a Major Reversal
🧠 Full Technical Analysis (Timeframe: Daily)
RSR/USDT is at a crucial decision point after months of consolidation.
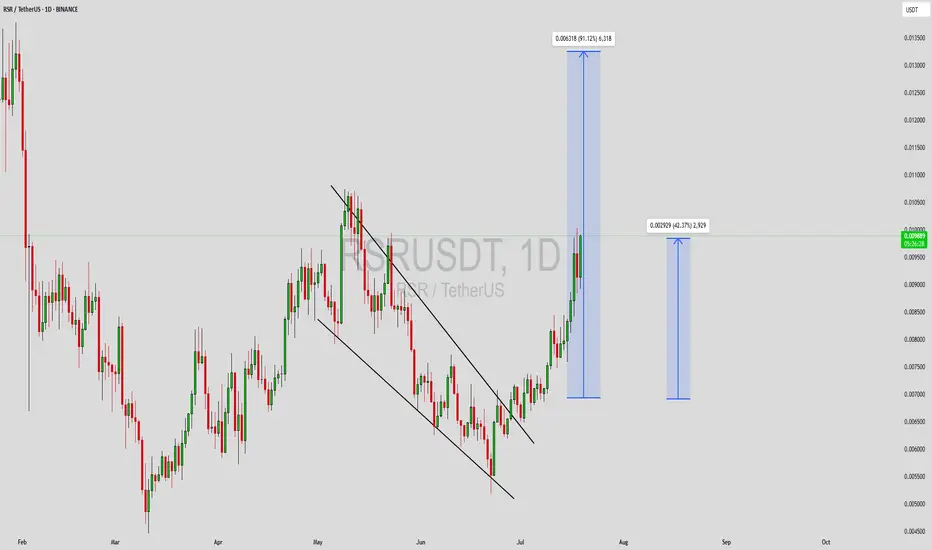
The price action has been forming a classic Descending Triangle pattern, a structure that often precedes major breakouts or breakdowns. As we approach the apex of the triangle, RSR is now testing a descending resistance trendline that has capped prices since December 2024.
🟢 Bullish Scenario: Breakout Toward an Explosive Rally
If the price successfully closes above $0.0083 with strong volume confirmation, it could trigger a trend reversal and unlock a potential multi-phase rally.
🎯 Potential Bullish Targets:
Target 1: $0.0106 – Minor resistance and possible initial take-profit zone.
Target 2: $0.0122 – Last major distribution zone before the previous breakdown.
Target 3: $0.0170 – Strong historical resistance and psychological level.
Max Extension: $0.0259 – $0.0270 – Could be reached if the breakout gains momentum, potentially delivering over +200% upside from the current level.
📈A clean breakout could attract both retail and institutional buyers, leading to significant upside in the short to mid-term.
🔴 Bearish Scenario: Fakeout and Deep Correction Risk
If RSR fails to break out and gets rejected at the trendline resistance, we could see a pullback or bearish continuation. Key support levels to watch include:
🔻 Possible Downside Levels:
Support 1: $0.0072 – Current horizontal base of the triangle.
Support 2: $0.0060 – Previously tested demand zone.
Major Support: $0.0044 – Yearly low and strong bounce zone if panic selling occurs.
📉A rejection at the trendline could open up short-term downside of 30-40%.
🧩 Pattern Highlight: Descending Triangle (Breakout Imminent)
✅ Dynamic Resistance: Downtrend line from December 2024.
✅ Horizontal Support: Around $0.0070 holding firmly.
🚨 Breakout Approaching: Watch for a daily close above resistance.
📌 Confirmation: Breakout should be supported by increased volume to be valid.
🧠 Strategic Notes:
Always confirm breakout with volume and candle close.
Breakout setups like this offer high R:R swing trade opportunities.
Use proper risk management around key levels.
🔍 Conclusion:
RSR is facing a make-or-break moment after months inside a descending triangle. A breakout above resistance could ignite a powerful rally, while a rejection might trigger another wave of correction.
Breakout or Breakdown? The next few candles may decide everything. Stay ready.
#RSR #RSRUSDT #CryptoBreakout #DescendingTriangle #AltcoinSetup #TradingSignal #CryptoAnalysis #BreakoutPlay #CryptoCharts #CryptoTechnical

RSR possible playout in coming weeksRSR / USDT
It looks like it’s bottoming out
RSR is trying to breakout multi resistant levels on HTF
Lower trend line is acting as main support and must hold to keep its bullish sentiment
EYE ON IT

#RSR/USDT#RSR
The price is moving within a descending channel on the 1-hour frame, adhering well to it, and is on its way to breaking it strongly upwards and retesting it.
We are seeing a bounce from the lower boundary of the descending channel. This support is at 0.008441.
We have a downtrend on the RSI indicator that is about to break and retest, which supports the upward trend.
We are looking for stability above the 100 moving average.
Entry price: 0.008663
First target: 0.008776
Second target: 0.008922
Third target: 0.009093

#RSR/USDT#RSR
The price is moving within a descending channel on the 1-hour frame, adhering well to it, and is on its way to breaking it strongly upwards and retesting it.
We are seeing a bounce from the lower boundary of the descending channel, which is support at 0.007050.
We have a downtrend on the RSI indicator that is about to break and retest, supporting the upward trend.
We are looking for stability above the 100 moving average.
Entry price: 0.007100
First target: 0.007309
Second target: 0.007556
Third target: 0.007816

Reserve Rights Token Ascending Triangle —Advanced Spot TradingHere we have a classic ascending triangle. Notice how the low for this pair happened 11-March. It has been rising for a while. Slowly but surely.
Rising from the base because the triangles upper boundary was working as resistance. It rejected RSRUSDT in late March and also 12-April. Now, this resistance has been broken and this can be great timing to catch a wave in the making.
Looking at other charts, I would show you a bottom without the breakout and tell you to buy and hold. The advantage in this case is having a stop-loss with very low risk and maximum potential for growth. The disadvantage of course is having to wait a long time for the bullish wave to develop. Everything has its pros and cons.
When we consider the current chart, the low was hit more than a month ago. Bottom prices are not available anymore but the resistance of the triangle pattern has already been broken, which means that we can experience sudden growth.
The advantage here is a smaller waiting time, faster profits; the disadvantage is the fact that we have a limited space for profits and if prices drop there is also plenty of space open before prices reach support. So the stop-loss has higher risk and the profits potential can be lower but the waiting time can be shorter. See how that works?
In some instances we can go for the bottom catch with long-term hold. In some other instances, we can wait for breakout confirmation for fast profits. Fast would still require weeks or days.
In the first scenario, the waiting can take months. In the second, RSRUSDT can start growing within days.
Market conditions can always change. A short wait can turn into a reversal and instead of profits we get a losing trade. That's ok. We are not meant to win them all. The goal is profit big on the winners and the cut the losers short. When a trade goes bad, just let it go. When a trade is doing good, hold strong.
Namaste.

RSRUSDT | Locking In 80% Profit and Defining Key ZonesPreviously on RSRUSDT
%80 Profit!
We just banked an 80 percent gain from shorting at the red box in RSRUSDT—an incredible outcome that followed our earlier winner. Now it’s clear what really matters on this chart: the red boxes are your go‑to resistance zones and the green box is the support to watch.
🔴 Red Boxes = Resistance
Every time price has reached these red boxes, sellers have stepped in hard. For short setups, wait for lower‑time‑frame breakdowns confirmed by CDV weakness and volume spikes. That’s when you know it’s safe to act.
🟢 Green Box = Support
On any pullback, the green box has reliably attracted buyers. If price dips into this zone, look for clean higher‑lows on a 5‑ or 15‑minute chart plus positive CDV shifts before considering a long entry.
🎯 Trade with Clarity
Enter short at red boxes only after seeing LTF structure breaks and confluence on your indicators.
Enter long at the green box once lower‑time‑frame breakouts and CDV confirmation signal genuine demand.
I will not insist on my short idea. If price breaks above a red box without a downward break on the low time frame, I won’t force a short. If it breaks up with volume and retests, I’ll flip and look long.
You’ve seen these levels work again and again—just like that recent 80 percent profit. Keep watching these zones, stay patient, and let the market validate each move before you pull the trigger.
📌I keep my charts clean and simple because I believe clarity leads to better decisions.
📌My approach is built on years of experience and a solid track record. I don’t claim to know it all but I’m confident in my ability to spot high-probability setups.
📌If you would like to learn how to use the heatmap, cumulative volume delta and volume footprint techniques that I use below to determine very accurate demand regions, you can send me a private message. I help anyone who wants it completely free of charge.
🔑I have a long list of my proven technique below:
🎯 ZENUSDT.P: Patience & Profitability | %230 Reaction from the Sniper Entry
🐶 DOGEUSDT.P: Next Move
🎨 RENDERUSDT.P: Opportunity of the Month
💎 ETHUSDT.P: Where to Retrace
🟢 BNBUSDT.P: Potential Surge
📊 BTC Dominance: Reaction Zone
🌊 WAVESUSDT.P: Demand Zone Potential
🟣 UNIUSDT.P: Long-Term Trade
🔵 XRPUSDT.P: Entry Zones
🔗 LINKUSDT.P: Follow The River
📈 BTCUSDT.P: Two Key Demand Zones
🟩 POLUSDT: Bullish Momentum
🌟 PENDLEUSDT.P: Where Opportunity Meets Precision
🔥 BTCUSDT.P: Liquidation of Highly Leveraged Longs
🌊 SOLUSDT.P: SOL's Dip - Your Opportunity
🐸 1000PEPEUSDT.P: Prime Bounce Zone Unlocked
🚀 ETHUSDT.P: Set to Explode - Don't Miss This Game Changer
🤖 IQUSDT: Smart Plan
⚡️ PONDUSDT: A Trade Not Taken Is Better Than a Losing One
💼 STMXUSDT: 2 Buying Areas
🐢 TURBOUSDT: Buy Zones and Buyer Presence
🌍 ICPUSDT.P: Massive Upside Potential | Check the Trade Update For Seeing Results
🟠 IDEXUSDT: Spot Buy Area | %26 Profit if You Trade with MSB
📌 USUALUSDT: Buyers Are Active + %70 Profit in Total
🌟 FORTHUSDT: Sniper Entry +%26 Reaction
🐳 QKCUSDT: Sniper Entry +%57 Reaction
📊 BTC.D: Retest of Key Area Highly Likely
📊 XNOUSDT %80 Reaction with a Simple Blue Box!
📊 BELUSDT Amazing %120 Reaction!
I stopped adding to the list because it's kinda tiring to add 5-10 charts in every move but you can check my profile and see that it goes on..

RSR/USDT: FALLING WEDGE BREAKOUT! 100%+ PROFIT POTENTIAL!!🚀 Hey Traders! RSR Breakout Alert – 100%+ Rally Incoming? 👀🔥
If you’re hyped for big moves and real alpha, smash that 👍 and hit Follow for high-accuracy trade setups that actually deliver! 💹🚀
RSR has just broken out of a falling wedge structure on the daily timeframe—a powerful bullish pattern. The chart’s signaling a potential 100–150% upside move if momentum picks up from here. 📈
📍 Entry Zone: CMP – Add more on dips down to $0.0066
🎯 Target: 100%–150% upside
🛑 Stop-Loss: $0.0054
📊 Trade Plan:
✅ Buy from current levels
✅ Add on dips near breakout support
✅ Ride the breakout wave with tight risk control!
💬 What’s Your Take?
Are you riding this RSR breakout or waiting on confirmation? Drop your thoughts and targets in the comments—let’s ride this wave together! 💰🔥

RSR AMALYSIS (1D)RSR has approached a valuable zone after heavy drops.
This support zone is quite large, so we have divided it into two entries.
This position is suitable for spot trading, and risk and position sizing must be managed carefully.
We will enter one entry at Entry 1 and another at Entry 2.
Targets are marked on the chart.
A daily candle close below the invalidation level will invalidate this analysis.
For risk management, please don't forget stop loss and capital management
Comment if you have any questions
Thank You

RSRUSDT 1WRSR ~ 1W Analysis
#RSR Buy gradually from here if you still have a Conviction on this Coin with a minimum target of 20%+.

Long RSRInteresting moment for try to but the RSR. We are in the flat channel and was tested the middle line of this channel. Now we are move up and I think will try to brake the up level of channel. Can be good moment for buy RSR with risk reward ration. Will see...

RSR move to local resistance zoneBINANCE:RSRUSDT
✅Before we start to discuss, I would be glad if you share your opinion on this post's comment section and hit the like button if you enjoyed it.
Thank you.
Now almost all alts charts looks the same! top, one and half year downtrend line and bottom around more or less -0.18 and -0.27 zone by fib!
Everything on chart is D1 Timeframe
Possible Targets
➡️We possible passed the bottom and now in accumulation phase
➡️ Red box is first resistance zone where we can reject and come back down around September.
➡️ Already broke with retest on D1 timeframe downtrend line. I think we will see more than 150 days in accumulation phase before real reversal move and new cycle.
➡️Minimal targets for next year is 0.5 level by FIB
Hope you enjoyed the content I created, You can support with your likes and comments this idea so more people can watch!
✅Disclaimer: Please be aware of the risks involved in trading. This idea was made for educational purposes only not for financial Investment Purposes.
* Look at my ideas about interesting altcoins in the related section down below ↓
* For more ideas please hit "Like" and "Follow"!


RSR bullish flagHype pumped rsr pretty early giving him time for consolidation.
Reversal from consoludation already happen.
Major consolidation levels broken forming an bull flag
Trade entered at 0.0136 looking for break out
tp is already up to 0.014 making 3% profit secured (leverage is X5)
i see 3 scenario
1 Breaking flag with early impusle (action : move tp up a little below the broken flag resistance)
2 Small retracement inside flag to get another impulse (action : no action, can trigger tp and close trade)
3 back to bottom of the flag, tp triggered and profit taken (action : Looks for another long opportunity if we dont break the flag )

RSRUSDT Analysis: Red Box Seller ZoneIn RSRUSDT, the red box indicates a zone with active sellers . This level is critical for observing potential resistance or reversals. Caution is advised when approaching this area.
Key Points:
Seller Zone: The red box marks a strong area where sellers are active.
Risk Management: Avoid premature entries; wait for confirmation signals.
Confirmation Indicators: I will use CDV, liquidity heatmaps, volume profiles, volume footprints, and market structure analysis to assess the strength of this level.
Learn With Me: If you want to master how to use CDV, liquidity heatmaps, volume profiles, and volume footprints to identify precise zones, just DM me. I’d be happy to guide you!
Reminder: Patience and confirmation are key in such conditions. Successful trading relies on understanding market dynamics and taking calculated risks.
If you think this analysis helps you, please don't forget to boost and comment on this. These motivate me to share more insights with you! Wishing everyone success in their trades.
If you think this analysis helps you, please don't forget to boost and comment on this. These motivate me to share more insights with you!
I keep my charts clean and simple because I believe clarity leads to better decisions.
My approach is built on years of experience and a solid track record. I don’t claim to know it all, but I’m confident in my ability to spot high-probability setups.
If you would like to learn how to use the heatmap, cumulative volume delta and volume footprint techniques that I use below to determine very accurate demand regions, you can send me a private message. I help anyone who wants it completely free of charge.
My Previous Analysis
🎯 ZENUSDT.P: Patience & Profitability | %230 Reaction from the Sniper Entry
🐶 DOGEUSDT.P: Next Move
🎨 RENDERUSDT.P: Opportunity of the Month
💎 ETHUSDT.P: Where to Retrace
🟢 BNBUSDT.P: Potential Surge
📊 BTC Dominance: Reaction Zone
🌊 WAVESUSDT.P: Demand Zone Potential
🟣 UNIUSDT.P: Long-Term Trade
🔵 XRPUSDT.P: Entry Zones
🔗 LINKUSDT.P: Follow The River
📈 BTCUSDT.P: Two Key Demand Zones
🟩 POLUSDT: Bullish Momentum
🌟 PENDLEUSDT.P: Where Opportunity Meets Precision
🔥 BTCUSDT.P: Liquidation of Highly Leveraged Longs
🌊 SOLUSDT.P: SOL's Dip - Your Opportunity
🐸 1000PEPEUSDT.P: Prime Bounce Zone Unlocked
🚀 ETHUSDT.P: Set to Explode - Don't Miss This Game Changer
🤖 IQUSDT: Smart Plan
⚡️ PONDUSDT: A Trade Not Taken Is Better Than a Losing One
💼 STMXUSDT: 2 Buying Areas
🐢 TURBOUSDT: Buy Zones and Buyer Presence
🌍 ICPUSDT.P: Massive Upside Potential | Check the Trade Update For Seeing Results
🟠 IDEXUSDT: Spot Buy Area | %26 Profit if You Trade with MSB
📌 USUALUSDT: Buyers Are Active + %70 Profit in Total
🌟 FORTHUSDT: Sniper Entry +%26 Reaction
🐳 QKCUSDT: Sniper Entry +%57 Reaction
📊 BTC.D: Retest of Key Area Highly Likely
I stopped adding to the list because it's kinda tiring to add 5-10 charts in every move but you can check my profile and see that it goes on..

RSRUSDT 1WRSR ~ 1W
#RSR Still in a bullish trend so far. If you still have Conviction on the coin,. Buy in stages from here. with a minimum target of 15%+

RSRUSDT: Prime Demand Zone on Lower Time FrameThe blue box marks the strongest demand zone on the lower time frame for RSRUSDT. This level is ideal for potential buy entries, as it represents an area where buyers are likely to step in aggressively.
Watch for price reactions within this zone and consider lower time frame confirmations for optimal entries. Always manage risk effectively.
I keep my charts clean and simple because I believe clarity leads to better decisions.
My approach is built on years of experience and a solid track record. I don’t claim to know it all, but I’m confident in my ability to spot high-probability setups.
My Previous Analysis
🐶 DOGEUSDT.P: Next Move
🎨 RENDERUSDT.P: Opportunity of the Month
💎 ETHUSDT.P: Where to Retrace
🟢 BNBUSDT.P: Potential Surge
📊 BTC Dominance: Reaction Zone
🌊 WAVESUSDT.P: Demand Zone Potential
🟣 UNIUSDT.P: Long-Term Trade
🔵 XRPUSDT.P: Entry Zones
🔗 LINKUSDT.P: Follow The River
📈 BTCUSDT.P: Two Key Demand Zones
🟩 POLUSDT: Bullish Momentum
🌟 PENDLEUSDT: Where Opportunity Meets Precision
🔥 BTCUSDT.P: Liquidation of Highly Leveraged Longs
🌊 SOLUSDT.P: SOL's Dip - Your Opportunity
🐸 1000PEPEUSDT.P: Prime Bounce Zone Unlocked
🚀 ETHUSDT.P: Set to Explode - Don't Miss This Game Changer
🤖 IQUSDT: Smart Plan
⚡️ PONDUSDT: A Trade Not Taken Is Better Than a Losing One
💼 STMXUSDT: 2 Buying Areas
🐢 TURBOUSDT: Buy Zones and Buyer Presence
