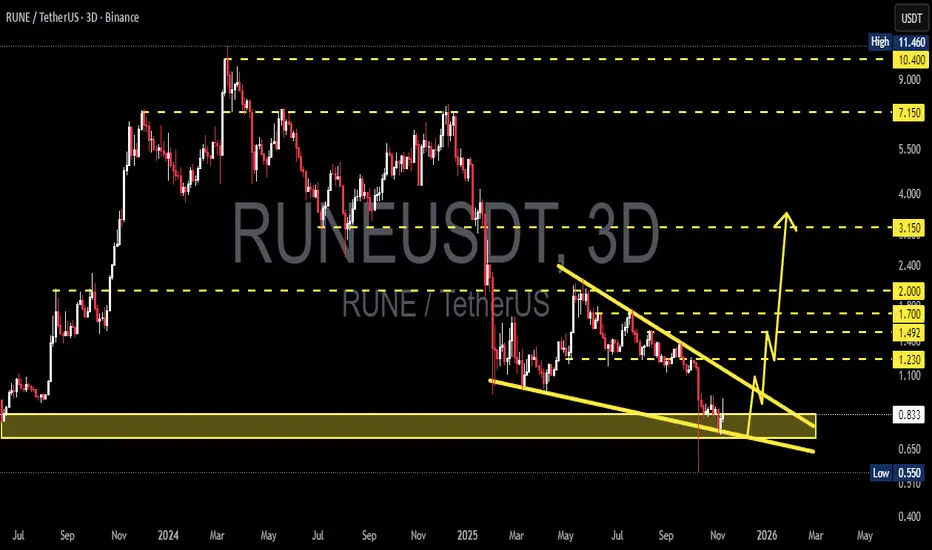
RUNE/USDT — Reversal Incoming or Breakdown Ahead?After a prolonged downtrend from the peak around $11.46, RUNE/USDT has now returned to the golden zone ($0.70–$0.833) — a major historical support area that once served as the launchpad for a massive rally.
The price structure reveals a Falling Wedge pattern, a classic formation that often signals a potential trend reversal after a phase of exhaustion and distribution.
However, despite this bullish potential, the market remains at a crucial inflection point — where every candle in this zone could mark the beginning of a strong rebound... or the confirmation of a deeper breakdown to new lows.
---
Pattern & Structure Details
Main Pattern: Falling Wedge / Descending Channel
The narrowing trendlines indicate weakening selling pressure and potential for trend exhaustion.
Major Support Zone: $0.70 – $0.833, a strong demand area that has acted as a key pivot since mid-2023.
Key Resistance Levels (potential targets):
R1: $1.23
R2: $1.49 – $1.70
R3: $2.00 – $3.15
Critical Low: $0.55 → a break below this level could open further downside towards $0.40 or even $0.30.
---
Bullish Scenario (Potential Major Reversal)
If price holds above $0.70–$0.833 and then breaks out above the wedge trendline, it could confirm a strong reversal signal.
A 3D bullish candle with rising volume would serve as a powerful confirmation for a trend change.
Step-by-step upside targets:
T1: $1.23 → Initial resistance and short-term profit-taking zone.
T2: $1.49 – $1.70 → Mid-term reaction area.
T3: $2.00 – $3.15 → High-confidence target zone if a new bullish trend forms.
A valid breakout in this area could mark the end of the capitulation phase and the beginning of a new accumulation phase, similar to previous pre-rally setups.
---
Bearish Scenario (Final Breakdown Before Recovery)
If the $0.70 zone fails to hold and a 3D candle closes below it, the wedge structure will lose strength, opening downside continuation targets at:
$0.55 (previous low) as the first support,
followed by $0.40 – $0.30 if heavy selling continues.
However, beware of fake breakdowns (false breaks) followed by rapid recoveries — these often act as bear traps before a major bullish reversal.
---
Analysis Summary
📊 RUNE is standing at a major decision point.
The $0.70–$0.833 zone is the last line of defense — if it holds, a wedge breakout could ignite a new bullish leg. If it fails, the market may seek new lows before establishing a real bottom.
This moment will determine whether we’re witnessing smart money accumulation or the final phase of capitulation before the next market cycle begins.
#RUNE #RUNEUSDT #CryptoAnalysis #AltcoinWatch #FallingWedge #CryptoSetup #SupportZone #BullishScenario #BearishScenario #MarketDecision #CryptoTA #SwingTrade #TechnicalAnalysis
Runeusdc
RUNE/USDT — Major Weekly Support Retest: Bounce or Breakdown?📊 RUNE/USDT Weekly Analysis
RUNE/USDT is now trading at a critical decision point. Price is hovering around $1.22, right inside the multi-year support zone of $0.90 – $1.35 (yellow box). This demand zone has been tested multiple times since 2022, each time preventing further breakdowns and sparking rebounds.
If this zone holds again, we could see one of the strongest reversal rallies in recent years. But if it breaks, there’s still a wide gap to the downside, with the historical low at $0.32 acting as the next major support.
---
🔎 Market Structure & Pattern
1. Demand Base (Yellow Zone)
Price has repeatedly returned to $0.90 – $1.35, showing strong historical demand.
This zone is the “last line of defense” for buyers.
2. Sideways Range
Since 2023, RUNE has been consolidating between ~$1.00 – $2.00, indicating accumulation and distribution.
3. Potential Bullish Pattern
If support holds → possible double/triple bottom formation on the weekly timeframe, setting up a new bullish cycle.
4. Bearish Risk
A clean weekly breakdown below $0.90 would erase demand, opening the door to $0.55 → $0.39 → $0.32.
---
🚀 Bullish Scenario
Confirmation: Weekly close above $1.95 (first key resistance).
Upside targets:
$3.11 (+154%)
$4.93 (+303%)
$6.87 (+462%)
$9.09 → $11.48 → $15–21 (historical resistances).
Strategy: Scale into support zone, add more after a confirmed breakout above $1.95, stop below $0.90.
---
⚠️ Bearish Scenario
Trigger: Weekly close below $0.90.
Downside targets:
$0.55 → $0.39 → $0.32 (historical low).
Risk: ~−73.6% from current price.
Strategy: Avoid averaging down without reversal signals. Short/hedge only after confirmed breakdown.
---
🎯 Key Takeaway
$0.90 – $1.35 = the final battlefield for buyers.
Holding this base could spark a massive reversal rally.
Losing it could send RUNE into uncharted lows.
Right now, RUNE is at a make-or-break moment:
➡️ Building a foundation for the next altseason rally,
or
➡️ Collapsing into its historical bottom.
#RUNE #RUNEUSDT #Crypto #Altcoins #TechnicalAnalysis #SupportResistance #CryptoTrading #SwingTrade #CryptoChart #PriceAction

RUNE - MASSIVE BREAKOUT IS COMING!RUNE is breaking out its resistance line, so we can expect a bullish momentum.
Buy zone - current price
Targets - as given in chart

Long on RUNE$RUNE bounced off the support level and broke through the descending trendline. Bullish movement to resistance level at 12$ is likely to happen.

Rune Thorchain back into channel Thor Chain runebtc runeusdtRune Thorchain back into channel Thor Chain runebtc runeusdt
