RUSSELL Overbought for the 3rd time in 7 months. Sell.Last time we had a look at Russell 2000 (RUT) was 2 months ago (November 28 2025, see chart below) where we gave a strong Buy Signal that quickly hit our 2600 Target:
This time, with the price approaching the top (Higher Highs trend-line) of its 10-month Channel Up, the technical sentiment turns bearish again. The maximum a Bullish Leg rose by within this pattern was +21.74% (its 1st) and since the 1D RSI got overbought for the 3rd time in 7 months (the previous two were Higher High tops), we expect the index to start a new Bearish Leg soon.
The last two Bearish Legs pulled back and hit at least their 0.5 Fibonacci levels. Even from a potential +21.50% max, that gives us a 2550 Target for the short-term, which won't only be a Higher Low bottom for the Channel Up, but will also test the 1D MA100 (green trend-line).
---
** Please LIKE 👍, FOLLOW ✅, SHARE 🙌 and COMMENT ✍ if you enjoy this idea! Also share your ideas and charts in the comments section below! This is best way to keep it relevant, support us, keep the content here free and allow the idea to reach as many people as possible. **
---
💸💸💸💸💸💸
👇 👇 👇 👇 👇 👇
RUSSELL 2000

World Recession ~ WWIII ~ History RepeatsDuring a long-term trend, the “four crucial points” of the stock market are reached when the Node enters the four fixed signs respectively:
January 11, 2025: Enters Aries (South Node in Libra) Aries: The business activity starts to fall below the normal level
July 26, 2026: Enters Pisces (South Node in Virgo) Pisces: The business activity approaches the bottom of the cycle
January 27, 2028: Enters Aquarius (South Node in Leo) Aquarius: This is the extreme low of business activity, the bottom of the cycle
August 2, 2029: Enters Capricorn (South Node in Cancer) Capricorn: The business activity turns up from the bottom

Bitcoin Cycles and Russell 2000! What's the Connection?I'm not a BTC maxi, and I'm not against BTC at all! I just never understood the fanatics—whether it's the BTC cult or XRP. As I've said before, the human brain is wired to hunt for patterns, confirmations, and setups where none actually exist! That's how conspiracy theories are born!
Sure, on a global scale, conspiracies and certain ideas do turn out to be true! But with BTC and its 4-year cycle model, halvings, and all that jazz, it's such an oversimplified framework—tailor-made for people who aren't used to looking beyond the surface or thinking critically at all! Why bother thinking when they've told you there's this orange coin that should pump every 4 years, then the miners' rewards get slashed and the coin should pump again! Why? Nobody's ever explained it!
It's just that, back then, the halving model was the only marketing gimmick tied to the tech side that could draw in users! How else was a brand-new asset, fresh out of nowhere in the world, supposed to grab attention? So they cooked up this price-growth stimulus like that! But the market's matured now—demand has exploded, enough to soak up any supply out there.
To me, the halving is more of a news event that rallies all the market's forces into a tight timeframe, making it easier to reboot the whole thing.
As far as I'm concerned, the whole story about halvings driving BTC's cycles and growth is pure fiction! On the chart, they've just slapped on the Bitcoin halvings, and down at the bottom is the RUT (Russell 2000)—that's the index of 2,000 small-cap companies across all sorts of sectors!
How does it end up that the reactions on the charts are identical? Are people buying stocks in companies based on the halving of some made-up digital coin? Or is it way simpler: global investors, riding favorable market vibes in the moment, just pile into risk assets—and that includes both Bitcoin and those 2,000 small-cap companies
And for all you BTC diehards to chew on: The RUT index kicked off in the late '80s!
Thirty years before that orange coin even showed up!
Every asset—especially in crypto—needs some kind of hook, a legend, a mystery! Something to stir up the buzz! So let's not keep dragging in the halving as some magical force! Just like we shouldn't put blind faith in these so-called cycles! CRYPTO:BTCUSD

Russell at key supportSanta rally to start soon? Well, maybe. We have now had both the Fed and NFP out of the way, and not much else left except CPI report and a few CB meetings elsewhere. Among the major indices to watch is the Russell which is sitting at key inflection point here around 2520 area, marking prior resistance and middle trend of its LT bullish channel. Needs to hold this support, or at least the next one between 2460-2468 (marking the highs from Nov 2021 and Nov 2024, respectively). Bearish if it goes below that area.
By Fawad Razaqzada, market analyst with Forex.com

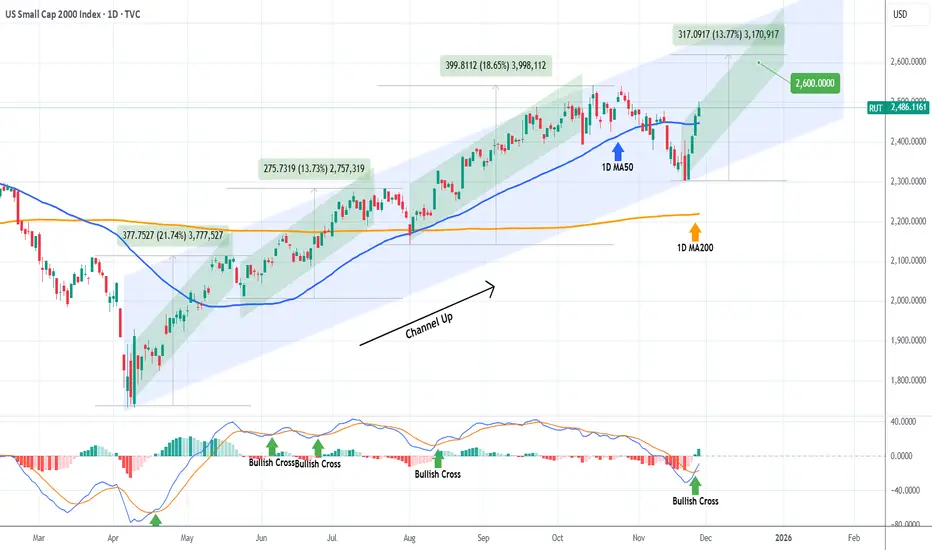
RUSSELL targeting 2600 on this Bullish Leg.Russell 2000 (RUT) has been trading within an 8-month Channel Up since the April 07 market bottom and following its latest correction (Bearish Leg), it recovered this week its 1D MA50 (blue trend-line), having already started the new Bullish Leg.
The minimum rise a Bullish Leg had within this pattern has been +13.73%. As a result, we expect the current one to hit at least 2600. Notice also the 1D MACD Bullish Cross, which has always been a confirmation of a new rally.
---
** Please LIKE 👍, FOLLOW ✅, SHARE 🙌 and COMMENT ✍ if you enjoy this idea! Also share your ideas and charts in the comments section below! This is best way to keep it relevant, support us, keep the content here free and allow the idea to reach as many people as possible. **
---
💸💸💸💸💸💸
👇 👇 👇 👇 👇 👇
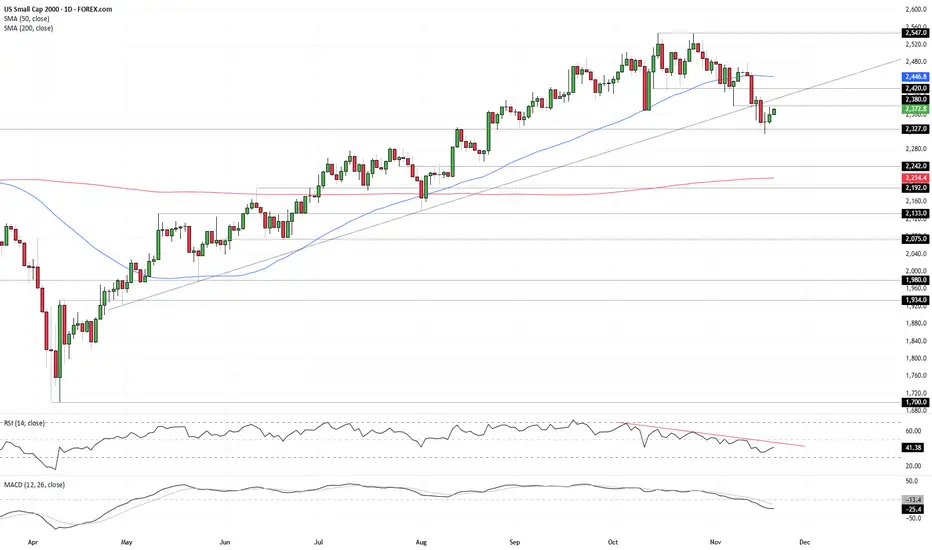
Momentum Weak Despite Nvidia BoostShould small-cap U.S. equities be rallying because AI giant Nvidia just delivered another blowout earnings update? Sure, risk sentiment has improved, and continued AI investment comes with some immediate broader economic benefits, but the move still comes across as a little suspect, especially with the prospect of near-term Fed rate cuts dwindling by the day. While the price signals for our small-cap contract are pointing to upside risks, momentum indicators are not confirming, suggesting selling into strength may be the way to play it, especially if we see a reversal pattern.
Looking at the daily chart, we see a clear morning star bullish reversal pattern printed this week, with follow-through buying after the Nvidia results. However, as was the case in the prior session, the price has been unable to take out 2380 so far, marking the low struck on November 7. It’s only a minor level, but it has seen price action on either side of it this month, making it relevant when assessing setups.
Despite the bullish price signal, RSI (14) and MACD remain firmly bearish. RSI continues to trend lower beneath 50, indicating downside pressure remains even if it’s weakened a touch in recent days. MACD also sits in negative territory, having already crossed the signal line from above in late October. It too is showing signs of turning, but for now the combined message remains one where selling into strength may be the better way to play it.
Should the price be unable to breach and hold above 2380, shorts could be considered beneath the level with a stop above for protection, targeting 2327 support initially. Should that and Tuesday’s low give way, 2275 or 2242 screen as other downside targets.
Of course, if the price can push above and hold 2380, longs could also be considered, allowing for a stop to be placed beneath to protect against reversal. Such a move may see momentum indicators tilt neutral rather than bearish. If that were to occur, the merits of long trades would be improved. 2400, where the price was capped prior to the latest leg lower, looks as an appropriate initial target, with the 50DMA the next after that.
Good luck!
DS
Market Update - RUT | BTCThis video looks at the underperformance of RUT compared to the rest of the markets including CRYPTOCAP:BTC where we could see a 50% drop as I compare it to 2021 fractals
We first need to see a pump around $88k and then go from there
TVC:RUT is clearly going through a Distribution phase that will Contract, and this is where we can see the rest of the markets follow through similar to Jan. 2025, and 2021 - 2022 fractal.
Expect stocks like NASDAQ:NVDA to retrace back to the downside, but will see it holdup pretty well
NASDAQ:TSLA on the other hand may see price fall back to its major Demand lvl as it has a few times already.

RUSSELL 25-year Channel Up giving a Sell Signal soon.Russell 2000 (RUT) has been trading within a 25-year Channel Up since the March 2000 High, which was the Top of the A.I. Bubble. Since then it only broke once during the 2008 Housing Crisis. Once recovered, it has used all standard macro levels of Support as short, medium and long-term buy entries respectively, with those being the 1M MA50 (blue trend-line), the 1M MA100 (green trend-line) and the 1M MA200 (orange trend-line).
The April 2025 rebound, which is the market's most recent rally, took place right on the 1M MA100. The index is however approaching the 0.236 Fibonacci level of the Channel Up, which since the 2000 High, has provided almost all rejection points, being the strongest Sell Signal (exception 2021, which was the mega-pump recovery following the March 2020 COVID flash crash).
As you can see, the market has historically started a correction on the 2nd test/ rejection on the 0.236 Fib. Out of those 3 corrections, two of them took place after the index broke above the 0.236 Fib and one just below it. All however have pulled-back to at least the 0.382 (blue) Fib. The key here however is to determine the exact High so that you can draw the 0.382 Fib retracement.
The only condition that most likely won't be fulfilled (as it happened on all previous cases), is that the 1M RSI most likely won't break above the 70.00 overbought level before the correction happens. So there's question mark there.
As for our Target, we expect at least 2230 (Fib 0.382) to get hit around mid 2026.
-------------------------------------------------------------------------------
** Please LIKE 👍, FOLLOW ✅, SHARE 🙌 and COMMENT ✍ if you enjoy this idea! Also share your ideas and charts in the comments section below! This is best way to keep it relevant, support us, keep the content here free and allow the idea to reach as many people as possible. **
-------------------------------------------------------------------------------
💸💸💸💸💸💸
👇 👇 👇 👇 👇 👇

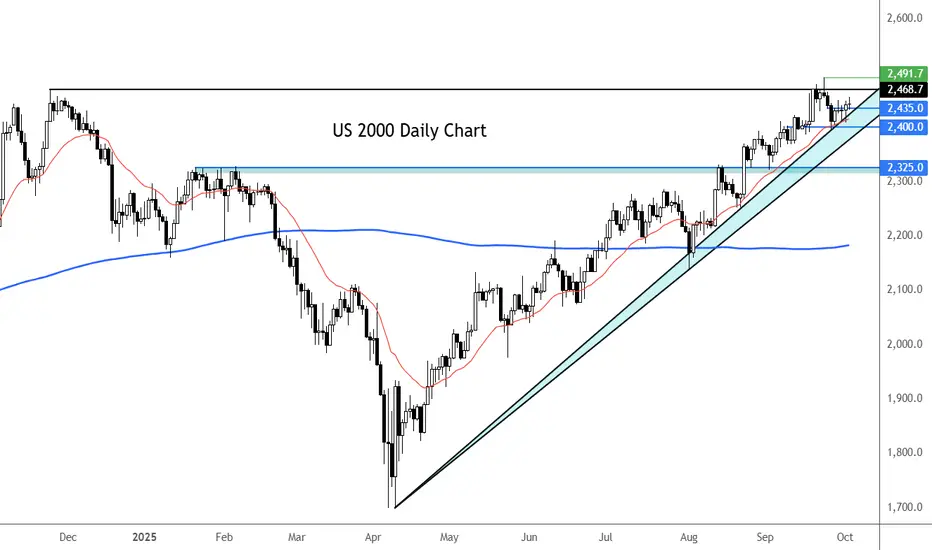
Russell breaks outThe Russell has broken out of its short-term triangle continuation pattern to the upside. If the breakout holds, we could see a run to new all-time highs above 2547 from here. Key support around 2500 has held for now.
Risk appetite remains elevated as markets head into a critical window packed with potential rate cuts, tech earnings, and diplomatic progress between the US and China. The upcoming Trump–Xi meeting has added an extra layer of enthusiasm after Trump signaled possible tariff relief. Confidence in the AI theme continues to drive the rally, with Nvidia’s historic $5 trillion valuation amplifying bullish sentiment across tech-heavy benchmarks like the Nasdaq 100 and S&P 500. But now even the small caps index of 2000 US stocks - the Russell - is joining the rally.
By Fawad Razaqzada, market analyst at FOREX.com

Russell hits new highsSo much for the government shutdown. US equity indices have rallied again today, thanks to ongoing bullish momentum and AI optimism. Bets that the Fed easing will continue to support corporate earnings are keeping the bulls fully in charge with traders continuing to take the ongoing US gov shutdown in their stride..
While tech stocks continue to shine -- led by Advanced Micro Devices (AMD), which soared after signing a deal with OpenAI to roll out AI infrastructure -- small caps are doing great too ahead of the earnings season.
The Russell has been printing lots of bullish price action lately and we have called for new highs on the index. It has not let us down and today climbed to a new high, after taking out a long-term resistance zone between 2461 and 2468, marking the highs from 2021 and 2024.
The breakout means the index has also poked its head above last week's high at 2491, thus invalidating the bearish-looking inverted hammer candle that had pointed to a potential top. Well that candle only preceded a modest pullback, as the index has now hit a new record. 2500, 2600 could be the next upside targets from. Key support levels below that 2461-2468 range are marked on the chart.
By Fawad Razaqzada, market analyst with FOREX.com

Russell eases to test key short-term supportThe Russell has bounce off its lows a tiny bit but could we now see a more decisive recovery heading deeper into the U.S. session?
The markets have been holding firm with tech sector leading the spx500 to a new high today, even though the index then came off earlier highs amid profit taking with government shutdown making things complicated.
Still, the trend is clearly bullish and we could well see the small cap index hold support here around 2435 which was prior resistance.
On the upside 2468 is the main level to watch. Break this and a new ATH above 2491 could be on the cards.
By Fawad Razaqzada, market analyst with FOREX.com
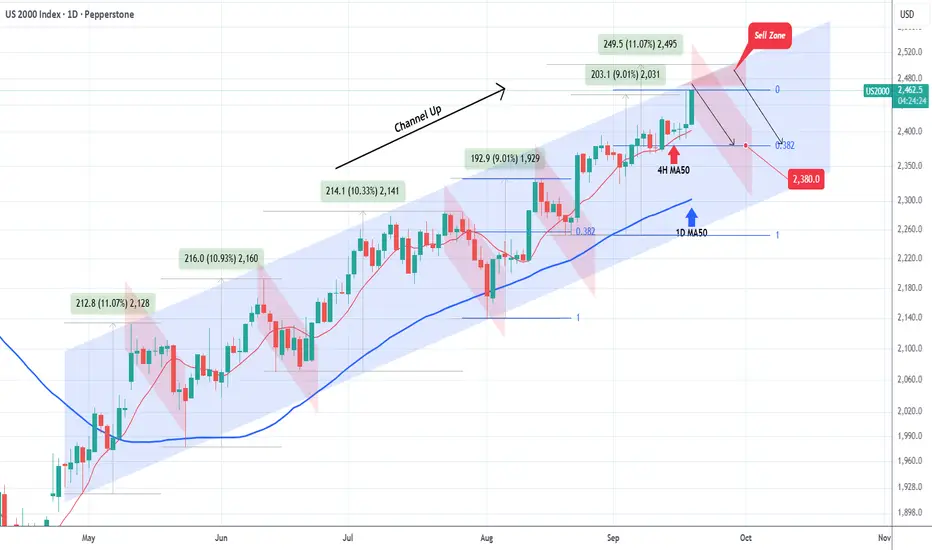
RUSSELL Will it correct this time also?Russell 2000 (RUT) has been trading within a Channel Up since late April and right now its current Bullish Leg is about to test the pattern's top (Higher Highs trend-line).
It has completed a +9.01% rise from the August 20 Low, which is the same increase of the previous (August 01 - 13) Bullish Leg and that has been the 'weakest' one out of all Legs of the Channel Up (+11.07%, +10.93% and +10.33% the others).
As a result, we can start thinking about taking profits on this run and an upcoming new pull-back (red Bearish Leg/ Channel Down) within a Sell Zone that extends up to +11.07% (2500).
Within this Zone, any rejection we get, we are targeting 2380, which is the 0.382 Fibonacci retracement level applied on the minimum +9.01% rally.
-------------------------------------------------------------------------------
** Please LIKE 👍, FOLLOW ✅, SHARE 🙌 and COMMENT ✍ if you enjoy this idea! Also share your ideas and charts in the comments section below! This is best way to keep it relevant, support us, keep the content here free and allow the idea to reach as many people as possible. **
-------------------------------------------------------------------------------
💸💸💸💸💸💸
👇 👇 👇 👇 👇 👇
For couple years we've said Crypto = StocksWant more proof Crypto = Stocks now?
CRYPTOCAP:TOTAL 3 = NO CRYPTOCAP:BTC or CRYPTOCAP:ETH
This index looks identical to TVC:RUT = Russell 2k
Sorry we don't post much. It's a lot to keep 1 social account, let alone 2 - 3!
Please see our profile for more info.

IWM Appears Due for a Minimum 40-60% Downside CorrectionOn the lower timeframes IWM has been treating $223 as short term support with much sold put leverage building at $220 and recently IWM has begun to retrace back down into those levels putting those sold puts at risk of expanding the volatility and of squeezing through these short puts as a result.
The short term the loss of this zone could likely squeeze down to $200.
However in the longer term we have been trading within this much larger parallel channel since the peak and bottom of 2008-2009 GFC and have started to form a potential peak paired with a Bearish Shark. I think that if we were to start to see some serious downside the IWM could trade back down to not just the bottom of the channel but down to one of the 3 major horizontal supports I have plotted on the cart down at $121, $85.74, or even $41.11 if things get real bad.
Personally I will be targeting one of the 2 upper horizontal supports in the longer dated positioning while targeting the $210-$200 levels in the short term.
I'd suspect this decline to come especially as Fed Rate cut expectations are completely priced out of the market, it is worth mentioning that fed funds futures around the start of the month dropped their expectations of rate cuts for the September meeting down to 0 and we may now be on the path to pricing in rate hikes as seen in the chart below.
Alternatively the expectations for rates going into the end of December has been on a fast trajectory of pricing out rate cuts as well, starting at 90BPS of rate cuts at the start of the year, now pricing in only 37.5BPS in rate cuts:
This ongoing shift in these fed futures spreads from positive to negative signifies the amount that Fed Funds Futures are expecting the Fed to hike rates with both the instance of rate hikes and rate cuts likely to cause a collapse in credit spreads as the bond market yield shift higher leaving the interest rate sensitive IWM to be one of the most negatively affected.

Mr. Rusell (Small Cap index) & Altseason go hand in hand. That's right it does.
Why?
Because small businesses employ nearly half of the workforce of the United States.
So when financial conditions exist for confidence to grow at this level of the economy expressed via hiring and expansion of said businesses the ripple effects are huge.
Which can be seen during Altcoin boom's (banana zones)
This cycle especially as one whole Bitcoin is out of reach for the common man. When Retail hot money does return to crypto expect small cap low numerical valued coins to really start outperforming BTC

RUSSELL: Short term consolidation before ATH test.Russell is technically neutral on its 1D outlook (RSI = 55.323, MACD = 20.400, ADX = 20.042) as for the whole month of May it is trading sideways inside the 1D MA50 and 1D MA200. April's bottom and the subsequent RSI DB rebound, is very much like the October 27th 2023 bottom. The rebound that was followed, also had the index consolidate between the 1D MA50 and 1D MA200 and soon after it resumed the uptrend to cross above the R1 level (prior High) before pulling back to the 1D MA50 again. Based on that we remain bullish on Russell, aiming for the R1 (TP = 2,470).
## If you like our free content follow our profile to get more daily ideas. ##
## Comments and likes are greatly appreciated. ##

Could the Fiber reverse from here?The price is rising towards the pivot, which lines up with the 127.2% Fibonacci extension and could reverse to the 1st support.
Pivot: 1.1690
1st Support: 1.1058
1st Resistance: 1.1910
Risk Warning:
Trading Forex and CFDs carries a high level of risk to your capital and you should only trade with money you can afford to lose. Trading Forex and CFDs may not be suitable for all investors, so please ensure that you fully understand the risks involved and seek independent advice if necessary.
Disclaimer:
The above opinions given constitute general market commentary, and do not constitute the opinion or advice of IC Markets or any form of personal or investment advice.
Any opinions, news, research, analyses, prices, other information, or links to third-party sites contained on this website are provided on an "as-is" basis, are intended only to be informative, is not an advice nor a recommendation, nor research, or a record of our trading prices, or an offer of, or solicitation for a transaction in any financial instrument and thus should not be treated as such. The information provided does not involve any specific investment objectives, financial situation and needs of any specific person who may receive it. Please be aware, that past performance is not a reliable indicator of future performance and/or results. Past Performance or Forward-looking scenarios based upon the reasonable beliefs of the third-party provider are not a guarantee of future performance. Actual results may differ materially from those anticipated in forward-looking or past performance statements. IC Markets makes no representation or warranty and assumes no liability as to the accuracy or completeness of the information provided, nor any loss arising from any investment based on a recommendation, forecast or any information supplied by any third-party.

RUSSELL 15-year Cyclical pattern calls for enormous growth.Russell 2000 (RUT) made a massive rebound on last month's candle on the 1M MA100 (green trend-line), closing above it and maintaining the long-term price action above this Support since the March 2020 COVID crash.
Practically that was the only time the 1M MA100 broke since the October 11 recovery, which was the start of a 15-year Cyclical Pattern that initiates Bull Cycles after 1M MA50 (blue trend-line) ad then 1M MA100 rebounds that peak on the 2.0 Fibonacci extension.
Last month's rebound sets the stage for a post-COVID type recovery, especially if the Fed cuts the Interest Rates on their next meeting. The 2.0 Fibonacci extension is a little bit over 3500, which is our long-term Target.
-------------------------------------------------------------------------------
** Please LIKE 👍, FOLLOW ✅, SHARE 🙌 and COMMENT ✍ if you enjoy this idea! Also share your ideas and charts in the comments section below! This is best way to keep it relevant, support us, keep the content here free and allow the idea to reach as many people as possible. **
-------------------------------------------------------------------------------
💸💸💸💸💸💸
👇 👇 👇 👇 👇 👇

3/21 Gap Fill Bullish BounceUS indices are poised to fill downside gaps from Friday's close. Could be good for a bounce w/ upside cash gap targets higher.

Russell 2000 Elliott Wave Analysis (WXYXZ in progress)Possible wave (ii) complex correction in the form of a WXYXZ still in progress.
Expecting corrective rally to fail around the 2200 resistance zone.
A final wave down from there should find a bottom around the 1900 support zone where wave (ii) should end.
Expecting wave (iii) to commence from there...
------
*would appreciate feedbacks and thoughts on this*
**this is not a trade recommendation, just an idea that I am working with**

This RUT/NDX ratio may convince you to buy NASDAQ aggressively.Nasdaq (NDX) has been under heavy selling pressure in the past 30 days. This short-term pull-back however is nothing but a buy opportunity on the long-term, and this study shows you why.
The answer lies on the RUT/NDX ratio which shows that this may be the time to get heavier on tech. The use of the Russell 2000 index (RUT) is due to the fact it represents a wider array of companies. Naturally over the years (this 1M chart shows data since 2006), the ratio declines within a Channel Down as historically the riskier tech sector attracts more capital and grows more.
However there are instances where Russell gains more against Nasdaq. We are currently though at a time where this isn't the case as the ratio seems to be ready for decline following the completion of a consolidation that on previous fractals (March 2015, September 2008) was bearish, thus positive for Nasdaq.
As you can see, this movements can be grasped by the Sine Waves, though not perfectly, but still good enough to understand the cyclical pattern we're in, also with the help of the 1M RSI Triangles.
Nasdaq (which is represented by the blue trend-line) has started massive expansion Channel Up patterns following this unique signal given by the RUT/NDX ratio. The first was right after the 2009 Housing Crisis bottom and the second during the 2015/ 2016 E.U., VW and Oil crisis.
The key here is on the 1M RSI. The Triangle is about to beak to the upside and every time this happened in the last 20 years, it coincided with a pull-back on Nasdaq (blue circle) similar to the current one. What followed was massive rallies each time.
As a result, this could be an indication that even though the tariffs have rattles investor confidence lately, this is an opportunity for a strong buy position for at least the rest of the year.
-------------------------------------------------------------------------------
** Please LIKE 👍, FOLLOW ✅, SHARE 🙌 and COMMENT ✍ if you enjoy this idea! Also share your ideas and charts in the comments section below! This is best way to keep it relevant, support us, keep the content here free and allow the idea to reach as many people as possible. **
-------------------------------------------------------------------------------
💸💸💸💸💸💸
👇 👇 👇 👇 👇 👇

Gold takes Adv. since Trump-a-rally pans out to Bulls fartIt's gone 2 weeks or so, since Mr. Trump has secured a win over his Democrat-rival Kamala Harris in the 2024 U.S. presidential election, as it declared by the Associated Press.
Since that, a lot of stocks soared in a meme-style mode, while Bitcoin clears $93,000 and Dogecoin soared amid Trump-fueled crypto rally.
Among nearly 2000 components of Smallcap Russell 2000 Index TVC:RUT , appr. 90 percent of them (without any fundamental reasons) were up on November 6 - at the day Trump clinched White House victory.
For S&P 500 SP:SPX and Nasdaq-100 NASDAQ:NDX indices these numbers were 70 and 75 percent respectively.
Since US dollar interest rates are still near multi year highs and Powell still says the Fed is in no hurry to cut interest rates.. all of that means Trump-a-rally gives no light for super-duper bets, as it's been discussed in earlier posted ideas.
Moreover, Geopolitics is roaring back, as current U.S. President Joe Biden tries to authorize the yellow-blues to use powerful long-range American-made weapons inside Russia's legal areas, potentially inside Kursk region where located The Kursk Nuclear Power Plant, that is one of the three biggest nuclear power plants (NPPs) in Russia and one of the four biggest electricity producers in the country.
The main graph is for Gold spot OANDA:XAUUSD , and it indicates on Cup with Handle technical structure in development as Gold takes Adv. since Trump-a-rally pans out to Bulls fart.

Russel 2000 Compared to General MarketTVC:RUT has continued to sell off since my last couple posts and I believe we could see a huge market correction this year if price doesn't look to stop selling.
The next play on RUT I would like to see price pullback to the last breakout zone ($2,200) to confirm a continuation in trend
This play also looks very familiar to the 2022 selloff with equal highs to our current price structure. Seeing that AMEX:SPY is at a higher high tells me there is market-wide divergence and a topping pattern could be in play.
Now when we add CRYPTOCAP:BTC and $OTHER to the mix we can see bitcoin actually tops out first while Alts and SPX look to make one more leg up before crashing out.
The Trend Reader at the lower tab has topped out and has a bearish crossing in the overbought zone indicating we can see a long term play to the downside.
