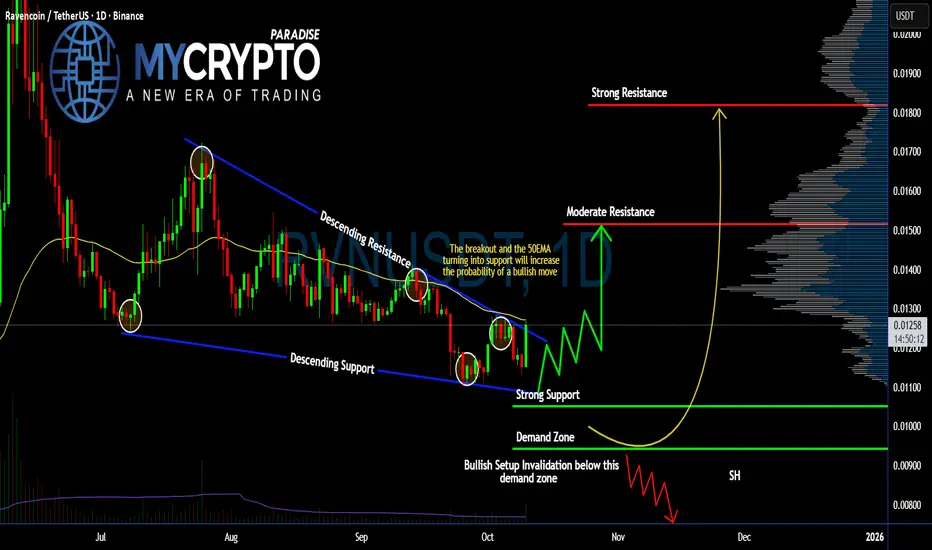
#RVN Ready for an Explosive Bullish Move | Must Watch For BullsYello Paradisers! #RVN just broke out of the descending channel exactly as we expected... but will it hold this time, or is this another fakeout? Let’s break down this #Ravencoin setup:
💎#RVNUSDT has been trading inside a well-respected falling wedge since July. After multiple rejections from the descending resistance, the price is about to break out and close above the structure. This move will also reclaim the 50EMA, which will act as support. If this EMA continues to hold, it will increase the probability of continuation to the upside.
💎The key bullish confirmation here is not just the breakout, but the structure of support forming right above the previously broken resistance line. This creates a possible bullish flip, turning old resistance into new support — one of the cleanest continuation patterns we look for.
💎If the current breakout holds, the next target for #RVNUSD to watch is at 0.015. A clean daily close and hold above that level would open the door for a stronger move toward 0.018, which is the next major resistance zone based on the volume profile.
💎Price is now holding above the strong support at 0.01052, and as long as we remain above the demand zone between 0.01052 and 0.00943, the bullish setup is valid. This area is now our invalidation level. A break below this zone would invalidate the structure and open up further downside.
Strive for consistency, wait for clear confirmations, and remember that discipline always beats chasing quick profits.
MyCryptoParadise
iFeel the success🌴
RVNUSD
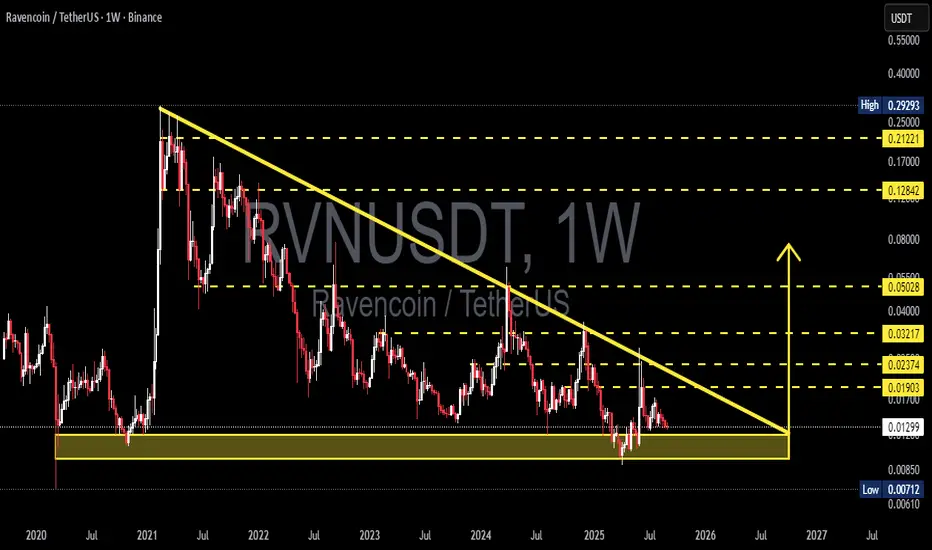
RVN/USDT — Descending Triangle: Breakout or Breakdown?Ravencoin (RVN) is now standing at one of its most critical levels since 2021. On the weekly chart, we clearly see a Descending Triangle pattern:
Lower Highs pressing the price down for years.
Strong demand zone around 0.00712 – 0.0130 USDT still holding as the last defense for buyers.
Price is now sitting right at the triangle’s apex, which means a major move is coming soon — either breakout or breakdown.
---
🔎 Technical Breakdown
Main pattern: Descending Triangle (statistically bearish, but positioned at strong demand).
Historical support: 0.00712 – 0.0130 (tested since 2021, sign of strong accumulation).
Descending trendline: rejected every rally since 2021, still intact.
Key resistances ahead: 0.0190 → 0.0237 → 0.032 → 0.050 → 0.128.
Major high: 0.2929 (far above, but valid long-term target if structure flips bullish).
---
🟢 Bullish Scenario
Trigger: Weekly close above descending trendline + successful retest, or breakout above 0.0190 USDT.
Additional confirmation: Strong volume breakout + weekly RSI reclaiming 50 or showing bullish divergence.
Upside targets:
1. 0.0190 (first resistance)
2. 0.0237 (historical barrier)
3. 0.0322 (trend reversal confirmation)
4. 0.0503 (major breakout level)
If momentum holds → potential extension toward 0.128.
Takeaway: A clean breakout could mark the first long-term bullish trend reversal for RVN in years.
---
🔴 Bearish Scenario
Trigger: Weekly close below 0.00712 USDT with strong volume.
Consequence: Breakdown from multi-year support → “last fortress” of buyers destroyed.
Downside target:
Retest 0.0071 (historical low). If lost, RVN may enter deeper price discovery zones.
Invalidation of bearish case: Price reclaiming above 0.0190.
Takeaway: Losing this demand zone could trigger a strong continuation to the downside.
---
⚖️ Big Picture
RVN is at a make-or-break point:
Breakout above → long-term trend reversal and new bullish cycle.
Breakdown below → bearish continuation with risk of new lows.
This is not just a technical setup; it also reflects overall crypto market sentiment. Bitcoin’s next major move will heavily influence RVN.
---
🎯 Strategy
Conservative traders: Wait for weekly close confirmation (breakout or breakdown).
Aggressive traders: Consider entries inside the demand zone with tight stops below 0.0070.
Risk management: Crucial! Weekly setups often bring big moves.
---
📌 Conclusion
RVN/USDT is “squeezed” at the apex of a descending triangle right on a multi-year demand zone.
Bullish case: breakout → 0.019 → 0.023.
Bearish case: breakdown < 0.0071 → opens the door for new lows.
Whichever direction plays out, a major RVN move seems very close.
---
#RVN #Ravencoin #RVNUSDT #CryptoAnalysis #TechnicalAnalysis #DescendingTriangle #Altcoin #PriceAction #ChartPattern #CryptoTrading
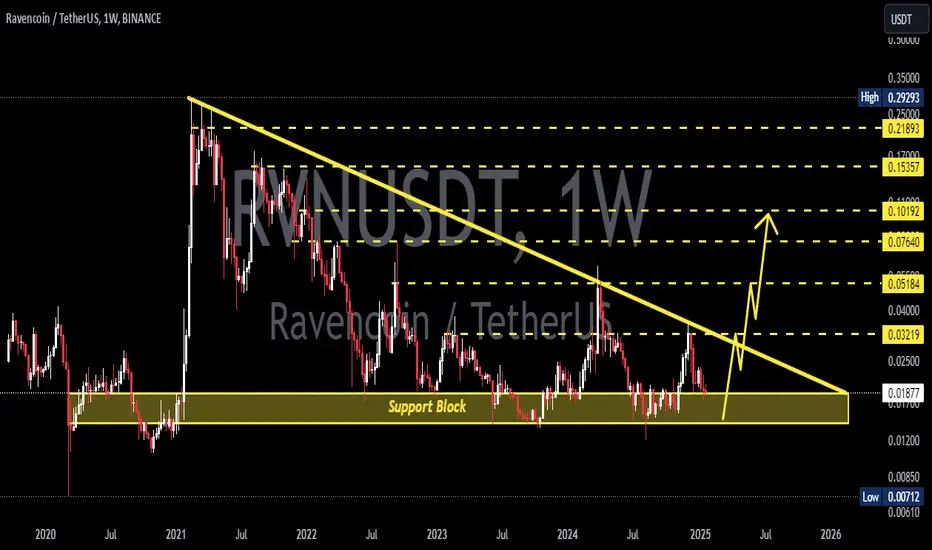
RVNUSDT Massive Breakout Loading? After 2 Years of Compression!
📈 Weekly Technical Analysis: Ravencoin (RVN/USDT)
🧠 Main Pattern: Descending Triangle ⚠️
Ravencoin has been consolidating within a Descending Triangle since early 2021 — typically a bearish continuation pattern, but one that can lead to a massive trend reversal if the upper boundary is broken.
🟨 Key Accumulation Zone:
📍 Support Area: $0.01280 – $0.01080
This zone has been tested multiple times and has shown strong buyer defense since 2022.
📏 Dynamic Resistance:
📍 Downward sloping trendline from the 2021 peak — currently acting as major resistance.
🟢 Bullish Scenario: Breakout Ahead? 🌕🚀
If RVN breaks above the descending trendline (~$0.01903) and closes strongly on the weekly chart, we could see a major uptrend unfold.
🎯 Bullish Targets:
🪙 $0.03217 — Minor horizontal resistance
🪙 $0.05028 — Key psychological level
🪙 $0.12842 — Major historical resistance
🪙 $0.21221 — Long-term bullish target
🔍 Breakout Confirmation Checklist: ✅ Weekly candle close above resistance
✅ Strong volume spike
✅ RSI rebound from oversold territory
🔴 Bearish Scenario: Breakdown Warning ⚠️📉
If price fails to hold the support zone at $0.01280:
❌ First target: $0.01080
❌ Breakdown risk: $0.00712
❌ Breakdown from triangle may confirm long-term bearish continuation
🎯 Conclusion & Strategy:
📌 Price is nearing the apex of a multi-year compression pattern
📌 A breakout could lead to exponential upside potential
📌 Great setup for swing or position traders
📌 Wait for confirmed breakout with volume before entry
#RVNUSDT #Ravencoin #CryptoBreakout #TechnicalAnalysis #AltcoinSeason #DescendingTriangle #BinanceTrading #BreakoutSignal

RVN Looks Bullish (1W)It’s one of the coins we are highly bullish on.
A major liquidity pool has been swept, and the price has hit an important origin level.
As long as the upper green zone holds, it can move toward the targets on the daily and weekly timeframes. The targets are marked on the chart.
A weekly candle close below the invalidation level would invalidate this analysis.
For risk management, please don't forget stop loss and capital management
Comment if you have any questions
Thank You

RVNUSDT 1D AnalysisRVN ~ 1D Analysis
#RVN If you still have confidence in this coin, perhaps you can consider this support to start buying back with a short-term target of at least 10%+ from here.

RVNUSDT 1W AnalysisRVN ~ 1W Analysis
#RVN Buy gradually from here if you still have a Conviction on this coin with a short -term target of at least 20%+.

RVNUSDT 1WRVN ~ 1W Analysis
#RVN Buy gradually from here with a short -term target of at least 20%+.
Reason, This is the lowest support block for now.

RVNUSDT 1WRVN ~ 1W Analysis
#RVN This is the lowest support for now. Buy from here if you still have a Conviction on this coin.

RVNUSDT 1WRVN ~ 1W Analysis
#RVN So far continues to maintain this support block. Buy from here if you still have a Conviction on this coin with a minimum target of 20%+
RVNUSDT 1WRVN ~ 1W
#RVN If you still have Conviction on this coin. Buy in increments within this block. with a minimum target of 20%. It is only a matter of time until this resistance line is broken.

not your time to fly yet little Raven RVNmassive triangle still unconquered for RVN. Check back next year

RVNUSDT 1WRVN ~ 1W
#RVN If you still have Conviction on this coin. Buy in increments within this block. with a minimum target of 20%. It is only a matter of time until this resistance line is broken.

#RVN ( SPOT) ..Entry range(,0150 -- ,01650) . SL(,01481)#RVN
Entry range (,0150 -- ,01650)
SL .4H close below (,01481)
Last target (0.02839)
#RVN
#RVNUSDT
#RVNUSD
#swingtrade
#shortterminvestment
#ALTCOIN
#Cryptotading
#cryptoinvesting
#investment
##trading
#cryptocurrencytrading
#bitcoininvestments
#Investing_Coins
#Investingcoins
#Crypto_investing
#Cryptoinvesting
**** #Manta ,#OMNI, #DYM, #AI, #IO, #XAI , #ACE #NFP #RAD #WLD #ORDI #BLUR #RVN ****
#bitcoin
#BTC
#BTCUSDT
BINANCE:RVNUSDT

RVNUSDT - Ravencoin Rockets! 140% Gain Captured on RisologicalRavencoin (RVNUSDT) delivered an explosive rally on the 4-hour timeframe, achieving and surpassing all profit targets using Risological swing trader. This long trade setup exemplifies precision trading, with each take-profit level being hit in a seamless upward trajectory.
Key Levels:
TP1: 0.01859 ✅
TP2: 0.02063 ✅
TP3: 0.02267 ✅
TP4: 0.02393 ✅
Technical Analysis:
The entry was confirmed at 0.01733, where Ravencoin showed a strong bullish reversal. With the Risological Swing Trader signaling continued upward momentum, the trend persisted beyond the final take-profit target of 0.02393.
The stop-loss was strategically placed at 0.01631, ensuring minimal downside risk. This calculated risk-reward ratio provided traders with maximum upside potential during the breakout. RVNUSDT's breakout trajectory and follow-through reaffirmed the robustness of the Risological trading system.

What is the target price for RVN?From the point marked with the red arrow on the chart, RVN has entered a correction phase. This correction forms a diametric pattern, with wave G recently completing.
It can rise if the green zone is maintained.
Targets are indicated on the chart.
Closing a daily candle below the invalidation level will invalidate this analysis.
For risk management, please don't forget stop loss and capital management
When we reach the first target, save some profit and then change the stop to entry
Comment if you have any questions
Thank You

RVNUSD_1D_Buyhello
Analysis of the RVNUSD symbol from the cryptocurrency market
We are a market buyer, maintaining the important support number of 0.01800
and Syosod at the price of 0.02400
33% growth rate


RVN Looks BearishRVN appears to be within a large diametric. From where we put a red arrow on the chart, it looks like the G wave started from this diametric.
The G wave itself also looks like a diametric diamond, and now we seem to be in the middle of the G wave.
From the supply range, it can drop to the specified TPs on the chart.
We are looking for sell/short positions in the supply range.
The targets are marked on the chart.
Closing a daily candle above the invalidation level will violate the analysis.
For risk management, please don't forget stop loss and capital management
When we reach the first target, save some profit and then change the stop to entry
Comment if you have any questions
Thank You

RVN - Full roadmap chart of RavencoinMany confirmations in this Raven chart, don't ignore RVN.
Something big is about to come to RVN
Entry Zone: 0.016 - 0.017
Sell Zone:
T1: 0.04
T2: 0.07
T3: 0.14
Good luck.

RVN / RVNUSDTGood Luck >>
• Warning •
Any deal I share does not mean that I am forcing you to enter into it, you enter in with your full risk, because I'll not gain any profits with you in the end.
The risk management of the position must comply with the stop loss.
(I am not sharing financial or investment advice, you should do your own research for your money.)

#RVN/USDT LONG
#RVN
We have Flag Down since April 2022
We are now touching the downtrend of that channel
He expects to break the channel strongly upwards
The 100 moving average has already been broken upwards
Price 0.02425
First Goal 0.0400
Second goal 0.0600
We have a great buying momentum

Ravencoin (RVNUSD) new targer $2.05
- According to the previous cycle shows that after breaking the trendline ravencoin reached to $0.3 (log chart fib retracement target was $0.3)
- And now this time the same trend line has been broken. If history repeads (generally it does in cryptocurrency charts) this tme the same fib retracement value hits to the new target ($2.05)
- This is an educational work and do your own homework before investing this coin.

RAVENIf the token waiting at a critical level breaks the resistance, it can rise sharply. if we follow closely, our earning potential is high
