RVN/USDT — Descending Triangle: Breakout or Breakdown?Ravencoin (RVN) is now standing at one of its most critical levels since 2021. On the weekly chart, we clearly see a Descending Triangle pattern:
Lower Highs pressing the price down for years.
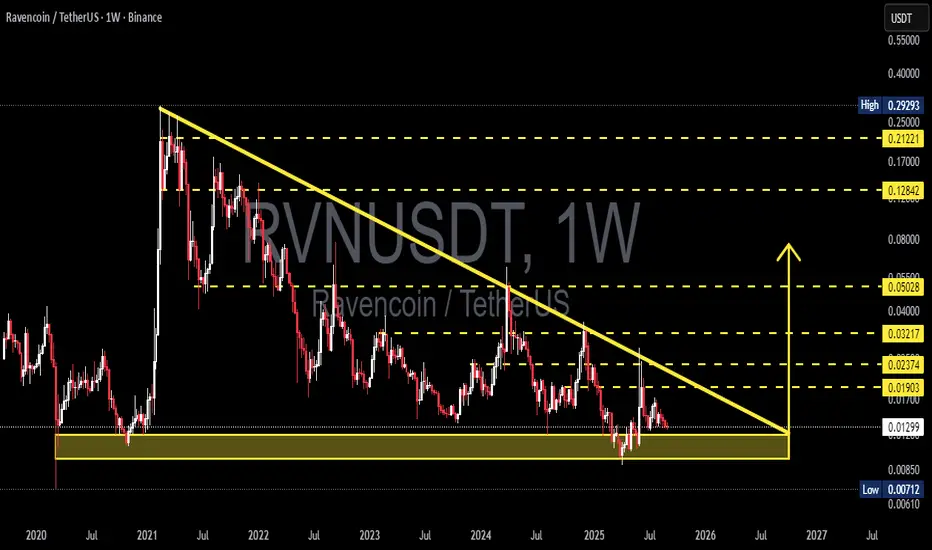
Strong demand zone around 0.00712 – 0.0130 USDT still holding as the last defense for buyers.
Price is now sitting right at the triangle’s apex, which means a major move is coming soon — either breakout or breakdown.
---
🔎 Technical Breakdown
Main pattern: Descending Triangle (statistically bearish, but positioned at strong demand).
Historical support: 0.00712 – 0.0130 (tested since 2021, sign of strong accumulation).
Descending trendline: rejected every rally since 2021, still intact.
Key resistances ahead: 0.0190 → 0.0237 → 0.032 → 0.050 → 0.128.
Major high: 0.2929 (far above, but valid long-term target if structure flips bullish).
---
🟢 Bullish Scenario
Trigger: Weekly close above descending trendline + successful retest, or breakout above 0.0190 USDT.
Additional confirmation: Strong volume breakout + weekly RSI reclaiming 50 or showing bullish divergence.
Upside targets:
1. 0.0190 (first resistance)
2. 0.0237 (historical barrier)
3. 0.0322 (trend reversal confirmation)
4. 0.0503 (major breakout level)
If momentum holds → potential extension toward 0.128.
Takeaway: A clean breakout could mark the first long-term bullish trend reversal for RVN in years.
---
🔴 Bearish Scenario
Trigger: Weekly close below 0.00712 USDT with strong volume.
Consequence: Breakdown from multi-year support → “last fortress” of buyers destroyed.
Downside target:
Retest 0.0071 (historical low). If lost, RVN may enter deeper price discovery zones.
Invalidation of bearish case: Price reclaiming above 0.0190.
Takeaway: Losing this demand zone could trigger a strong continuation to the downside.
---
⚖️ Big Picture
RVN is at a make-or-break point:
Breakout above → long-term trend reversal and new bullish cycle.
Breakdown below → bearish continuation with risk of new lows.
This is not just a technical setup; it also reflects overall crypto market sentiment. Bitcoin’s next major move will heavily influence RVN.
---
🎯 Strategy
Conservative traders: Wait for weekly close confirmation (breakout or breakdown).
Aggressive traders: Consider entries inside the demand zone with tight stops below 0.0070.
Risk management: Crucial! Weekly setups often bring big moves.
---
📌 Conclusion
RVN/USDT is “squeezed” at the apex of a descending triangle right on a multi-year demand zone.
Bullish case: breakout → 0.019 → 0.023.
Bearish case: breakdown < 0.0071 → opens the door for new lows.
Whichever direction plays out, a major RVN move seems very close.
---
#RVN #Ravencoin #RVNUSDT #CryptoAnalysis #TechnicalAnalysis #DescendingTriangle #Altcoin #PriceAction #ChartPattern #CryptoTrading
Rvnusdsignals
RVNUSDT Massive Breakout Loading? After 2 Years of Compression!
📈 Weekly Technical Analysis: Ravencoin (RVN/USDT)
🧠 Main Pattern: Descending Triangle ⚠️
Ravencoin has been consolidating within a Descending Triangle since early 2021 — typically a bearish continuation pattern, but one that can lead to a massive trend reversal if the upper boundary is broken.
🟨 Key Accumulation Zone:
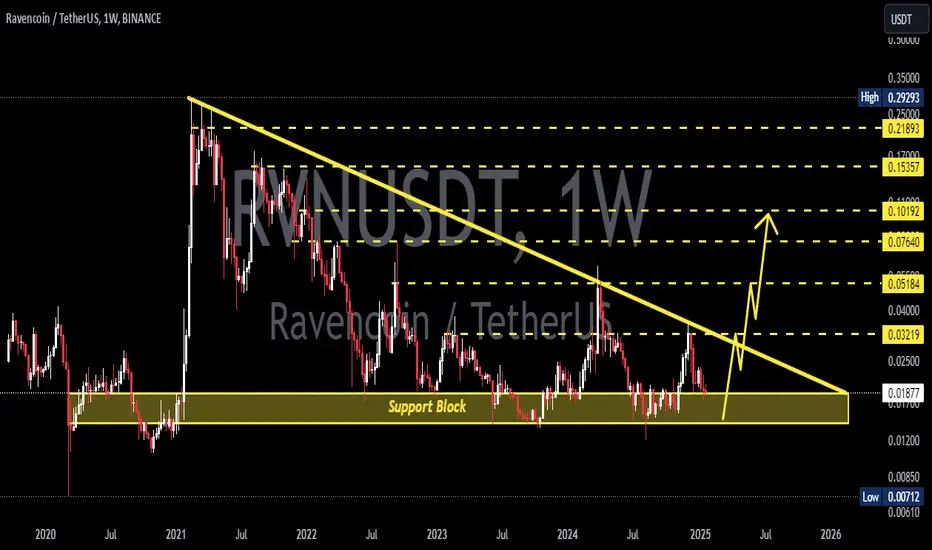
📍 Support Area: $0.01280 – $0.01080
This zone has been tested multiple times and has shown strong buyer defense since 2022.
📏 Dynamic Resistance:
📍 Downward sloping trendline from the 2021 peak — currently acting as major resistance.
🟢 Bullish Scenario: Breakout Ahead? 🌕🚀
If RVN breaks above the descending trendline (~$0.01903) and closes strongly on the weekly chart, we could see a major uptrend unfold.
🎯 Bullish Targets:
🪙 $0.03217 — Minor horizontal resistance
🪙 $0.05028 — Key psychological level
🪙 $0.12842 — Major historical resistance
🪙 $0.21221 — Long-term bullish target
🔍 Breakout Confirmation Checklist: ✅ Weekly candle close above resistance
✅ Strong volume spike
✅ RSI rebound from oversold territory
🔴 Bearish Scenario: Breakdown Warning ⚠️📉
If price fails to hold the support zone at $0.01280:
❌ First target: $0.01080
❌ Breakdown risk: $0.00712
❌ Breakdown from triangle may confirm long-term bearish continuation
🎯 Conclusion & Strategy:
📌 Price is nearing the apex of a multi-year compression pattern
📌 A breakout could lead to exponential upside potential
📌 Great setup for swing or position traders
📌 Wait for confirmed breakout with volume before entry
#RVNUSDT #Ravencoin #CryptoBreakout #TechnicalAnalysis #AltcoinSeason #DescendingTriangle #BinanceTrading #BreakoutSignal

RVNUSDT 1D AnalysisRVN ~ 1D Analysis
#RVN If you still have confidence in this coin, perhaps you can consider this support to start buying back with a short-term target of at least 10%+ from here.

RVNUSDT 1W AnalysisRVN ~ 1W Analysis
#RVN Buy gradually from here if you still have a Conviction on this coin with a short -term target of at least 20%+.

RVNUSDT 1WRVN ~ 1W Analysis
#RVN Buy gradually from here with a short -term target of at least 20%+.
Reason, This is the lowest support block for now.

RVNUSDT 1WRVN ~ 1W Analysis
#RVN This is the lowest support for now. Buy from here if you still have a Conviction on this coin.

RVNUSDT 1WRVN ~ 1W Analysis
#RVN So far continues to maintain this support block. Buy from here if you still have a Conviction on this coin with a minimum target of 20%+
RVNUSDT 1WRVN ~ 1W
#RVN If you still have Conviction on this coin. Buy in increments within this block. with a minimum target of 20%. It is only a matter of time until this resistance line is broken.

RVNUSDT 1WRVN ~ 1W
#RVN If you still have Conviction on this coin. Buy in increments within this block. with a minimum target of 20%. It is only a matter of time until this resistance line is broken.

RVN / RVNUSDTGood Luck >>
• Warning •
Any deal I share does not mean that I am forcing you to enter into it, you enter in with your full risk, because I'll not gain any profits with you in the end.
The risk management of the position must comply with the stop loss.
(I am not sharing financial or investment advice, you should do your own research for your money.)

RVNUSD 1W#RVN 📈
Make purchases gradually after breaking the resistance line of this pattern, target at least 20%+

RVN Has a very good investment opportunity Hi Everyone;
today we have one of the best risk to reward Investment opportunity
it is more than 587 times the risk and the chart is look very promising.
I expect breaking the previous bear market key point will clear the way to the final target

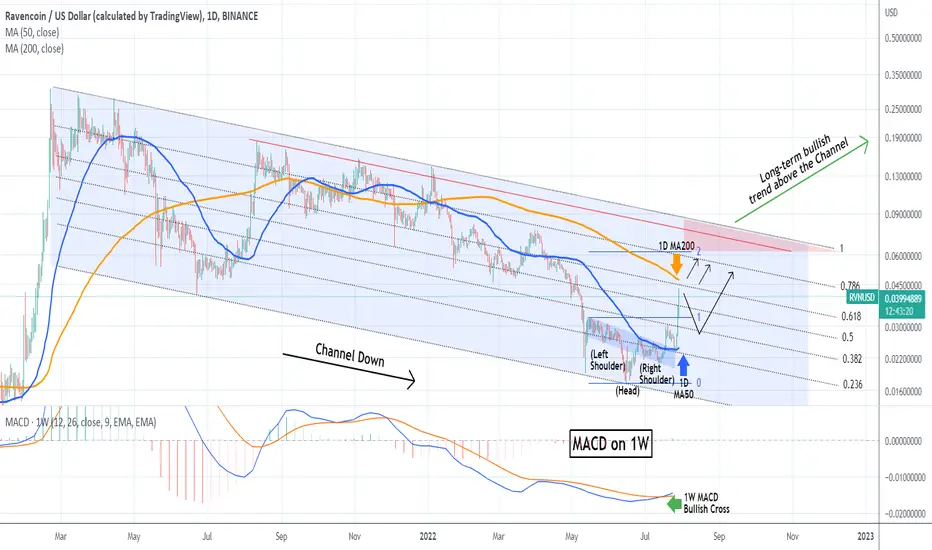
RVNUSD Strong success on our call. Make or break time!The Ravencoin (RVNUSD) is having an impressive first half into September as it held the 1D MA100 (green trend-line) as Support and rose aggressively above both the 1D MA50 (blue trend-line) and the 1D MA200 (orange trend-line) to hit the Red Trend-line and the top (Lower Highs) trend-line of the long-term Channel Down pattern, as we illustrated on our previous July 29 analysis:
As you see, the pattern played out exactly as we projected. That brings RVN ahead of critical crossroads. It is make or break time, as even though the rally that practically started after the Inverted Head and Shoulders pattern on the June 15 low, is strong enough to break above the Channel Down, we have to respect the red trend-line that has signaled a sell opportunity every time it has been touched.
As a result, being that close to the top of the Channel Down, a sell trade with the SL tight at the top of the pattern, offers a very favorable Risk/ Reward Ratio, with the target being the 1D MA100 just like on September 21 2021. However, be ready to reverse to buying again, if the top of the Channel Down breaks. In that case, will will target Resistance 1 at 0.14250.
--------------------------------------------------------------------------------------------------------
** Please support this idea with your likes and comments, it is the best way to keep it relevant and support me. **
--------------------------------------------------------------------------------------------------------

RVNUSD 0.0600 Ultimate TargetRavencoin (RVNUSD) has seen a very strong and rapid growth in the past 3 days after rebounding on the 1D MA50 (blue trend-line) and is now very close to the 1D MA200 (orange trend-line). The last rise of such magnitude has been from July 30 to August 11 2021.
RVN is doing so after a clear MACD Bullish Cross on the 1W time-frame with the bottom formation of June 15 being an Inverse Head & Shoulders (IH&S) pattern. That has a technical target of the 2.0 Fibonacci extension. Since we are that close to the 1D MA200, it would be less risky to buy only if it breaks or upon a pull-back to the 1D MA50.
--------------------------------------------------------------------------------------------------------
** Please support this idea with your likes and comments, it is the best way to keep it relevant and support me. **
--------------------------------------------------------------------------------------------------------
RVN Scalping orderis not really strong level if break the trend can make new low
ENTRY : 0.128
SL : 0.106
TP : 0.177
Risk : 17%
Profit : 38%

💡RVN: BUY Trade🚀🚀🚀🚀🚀🚀 #ALTSEASON2021📈#RVNUSDT
➡️Entry: 0.18$
🎯Target 1: 0.22$
🎯Target 2: 0.25$
🎯Target 3: 0.29$

Okay now Ravencoin have to be strong.Ravencoin now had a stronger correction. I am excited about which way it will continue


RVNBTC88% down from ATH
378 Days falling wedge break
BTC dominance dumping lots of alts already 3x to 5x
Sleeping from long time huge accumulation going on
270 Sat is key resistance if we break that targets are on chart.
Make it Crow
Team James

RVN/BTC TA Update (Market Structure Broken?)RVN/BTC
RVN broke a key support area at 292 sats which invalidated the current market structure.
By breaking key support levels especially if the area of confluence that acted as strong support for many months.
This signal a strong bearish momentum resulting in another market structure to be developed again for the next 1-2 months.
The RSI hasn't reached oversold levels yet, we may still see further selling pressure down to 260 sats area.
Do not try to catch the bottom, most often the price will go down further if they are no buyers present at key levels.

