RVNUSDT

#RVN Ready for an Explosive Bullish Move | Must Watch For BullsYello Paradisers! #RVN just broke out of the descending channel exactly as we expected... but will it hold this time, or is this another fakeout? Let’s break down this #Ravencoin setup:
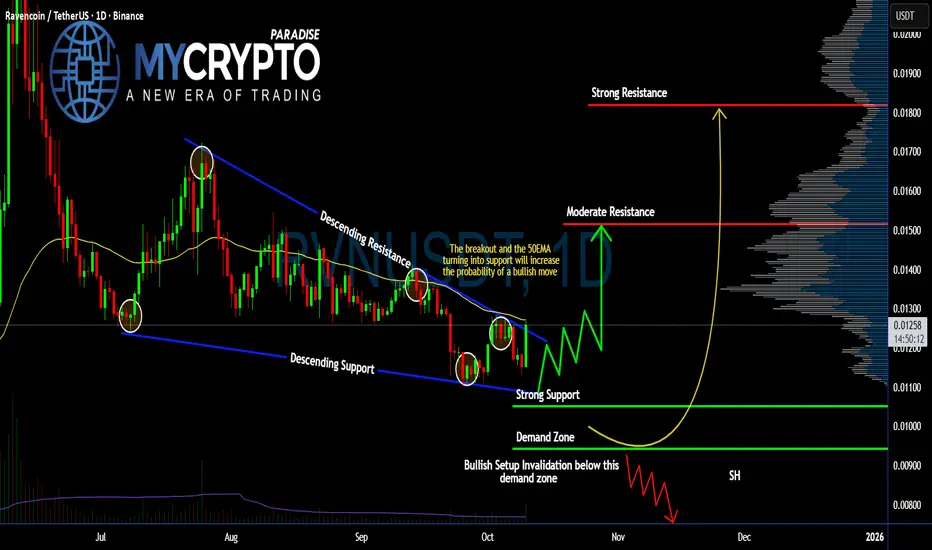
💎#RVNUSDT has been trading inside a well-respected falling wedge since July. After multiple rejections from the descending resistance, the price is about to break out and close above the structure. This move will also reclaim the 50EMA, which will act as support. If this EMA continues to hold, it will increase the probability of continuation to the upside.
💎The key bullish confirmation here is not just the breakout, but the structure of support forming right above the previously broken resistance line. This creates a possible bullish flip, turning old resistance into new support — one of the cleanest continuation patterns we look for.
💎If the current breakout holds, the next target for #RVNUSD to watch is at 0.015. A clean daily close and hold above that level would open the door for a stronger move toward 0.018, which is the next major resistance zone based on the volume profile.
💎Price is now holding above the strong support at 0.01052, and as long as we remain above the demand zone between 0.01052 and 0.00943, the bullish setup is valid. This area is now our invalidation level. A break below this zone would invalidate the structure and open up further downside.
Strive for consistency, wait for clear confirmations, and remember that discipline always beats chasing quick profits.
MyCryptoParadise
iFeel the success🌴
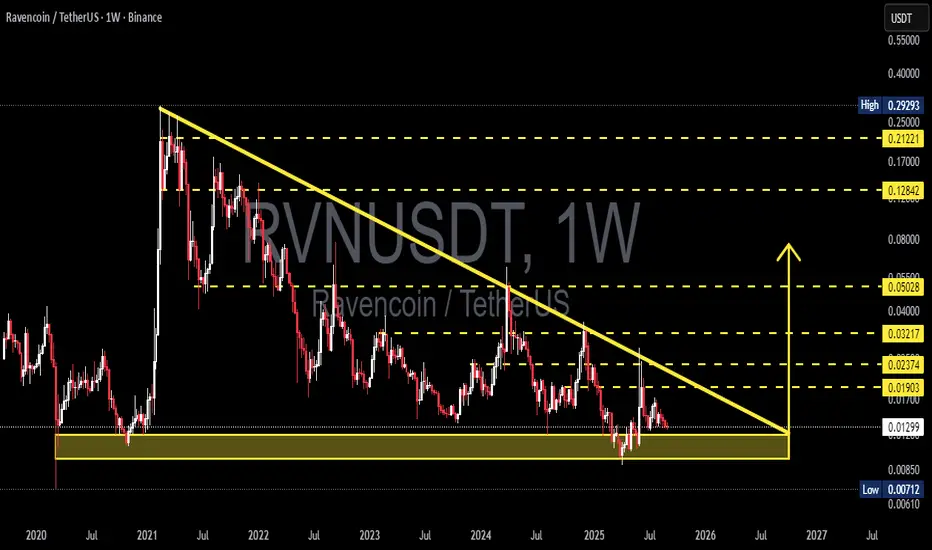
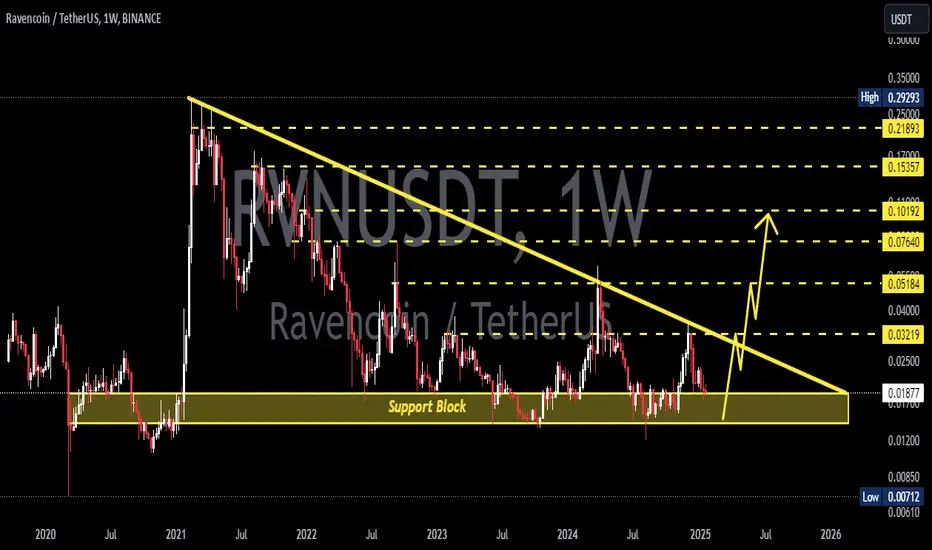
RVN/USDT — Descending Triangle: Breakout or Breakdown?Ravencoin (RVN) is now standing at one of its most critical levels since 2021. On the weekly chart, we clearly see a Descending Triangle pattern:
Lower Highs pressing the price down for years.
Strong demand zone around 0.00712 – 0.0130 USDT still holding as the last defense for buyers.
Price is now sitting right at the triangle’s apex, which means a major move is coming soon — either breakout or breakdown.
---
🔎 Technical Breakdown
Main pattern: Descending Triangle (statistically bearish, but positioned at strong demand).
Historical support: 0.00712 – 0.0130 (tested since 2021, sign of strong accumulation).
Descending trendline: rejected every rally since 2021, still intact.
Key resistances ahead: 0.0190 → 0.0237 → 0.032 → 0.050 → 0.128.
Major high: 0.2929 (far above, but valid long-term target if structure flips bullish).
---
🟢 Bullish Scenario
Trigger: Weekly close above descending trendline + successful retest, or breakout above 0.0190 USDT.
Additional confirmation: Strong volume breakout + weekly RSI reclaiming 50 or showing bullish divergence.
Upside targets:
1. 0.0190 (first resistance)
2. 0.0237 (historical barrier)
3. 0.0322 (trend reversal confirmation)
4. 0.0503 (major breakout level)
If momentum holds → potential extension toward 0.128.
Takeaway: A clean breakout could mark the first long-term bullish trend reversal for RVN in years.
---
🔴 Bearish Scenario
Trigger: Weekly close below 0.00712 USDT with strong volume.
Consequence: Breakdown from multi-year support → “last fortress” of buyers destroyed.
Downside target:
Retest 0.0071 (historical low). If lost, RVN may enter deeper price discovery zones.
Invalidation of bearish case: Price reclaiming above 0.0190.
Takeaway: Losing this demand zone could trigger a strong continuation to the downside.
---
⚖️ Big Picture
RVN is at a make-or-break point:
Breakout above → long-term trend reversal and new bullish cycle.
Breakdown below → bearish continuation with risk of new lows.
This is not just a technical setup; it also reflects overall crypto market sentiment. Bitcoin’s next major move will heavily influence RVN.
---
🎯 Strategy
Conservative traders: Wait for weekly close confirmation (breakout or breakdown).
Aggressive traders: Consider entries inside the demand zone with tight stops below 0.0070.
Risk management: Crucial! Weekly setups often bring big moves.
---
📌 Conclusion
RVN/USDT is “squeezed” at the apex of a descending triangle right on a multi-year demand zone.
Bullish case: breakout → 0.019 → 0.023.
Bearish case: breakdown < 0.0071 → opens the door for new lows.
Whichever direction plays out, a major RVN move seems very close.
---
#RVN #Ravencoin #RVNUSDT #CryptoAnalysis #TechnicalAnalysis #DescendingTriangle #Altcoin #PriceAction #ChartPattern #CryptoTrading
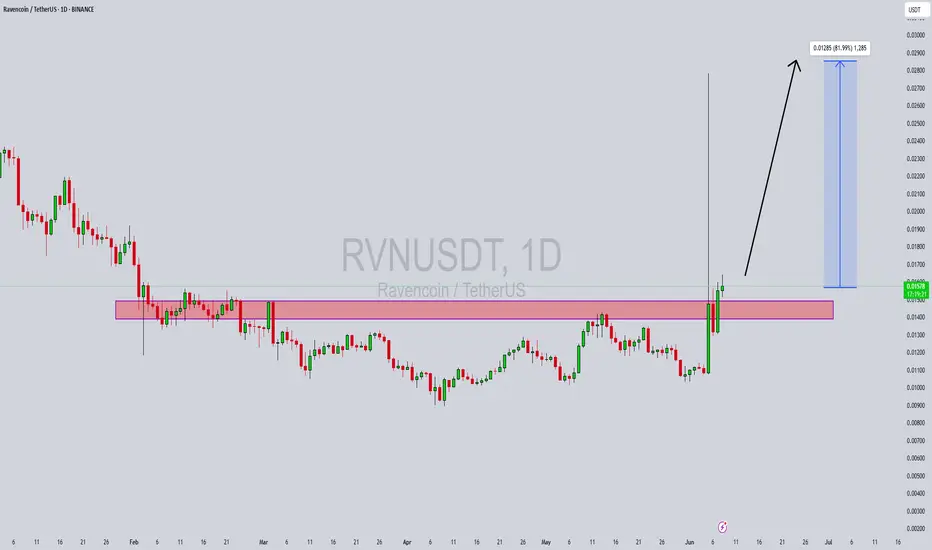
Ravencoin · Bullish Altcoins & Futures Trading Trade-NumbersRemember Ravencoin? At one point this project worked as a very strong signal and confirmation in support of our late 2025 altcoins market bull market thesis. The strong bullish jump and high volume in early June reveals a bottom, and a bottom reveals the end of a bearish period, and the end of a bearish period is followed by the inverse, a bullish cycle.
These pairs that move strongly in this way tend to perform strongly during the entire cycle. That is, RVNUSDT already produced a strong bullish breakout, which is nothing more than a whale purchase, and afterward went sideways.
People forget about it, excitement dies down and we move on to other things, hotter pairs let's say. After the consolidation is over, comes a new jump. This is the situation with RVNUSDT. I cannot make enough emphasis on another secure bet/chart setup/trade. This one will grow and we have proof already, the thing is that I think it is next in line. Not only RVNUSDT but I am also tracking and trading RVNBTC. They are both going up.
Technical analysis
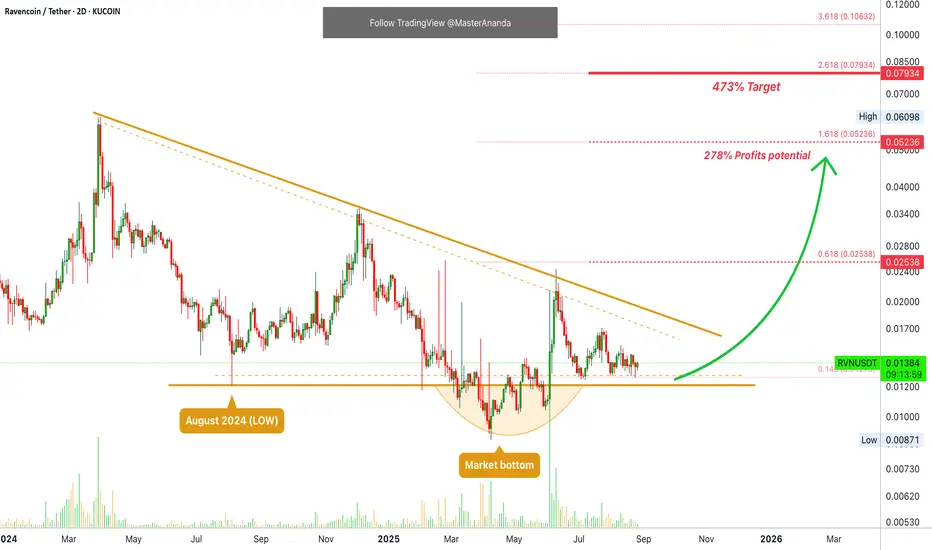
Notice the main low and support around August 2024, a year ago. Now notice how all the bearish action tends to stall around this level. Brown line on the chart.
In April the market moves below—break of support—just to recover with high volume after a few days. This break below support is the market bottom and the move is called "an excess." When the momentum goes beyond on one side. Excesses always tend to be corrected.
The triangular pattern with the lower highs is also interesting. This pattern points to a breakout happening soon. When the action reaches the apex, or gets close to it, the market booms.
The theory is that any direction is possible. In theory, people say the market can move down just as it can move up.
In actuallity, the market only can move up because the bearish wave is already over. Night follows day. After going down, the market grows. You cannot get night after night. You cannot get a bear market followed by a bear market.
In practice, we are set for a very strong bullish wave and breakout in the coming months. Short-term it can move, but we are always prepared to wait long.
Ravencoin is about to produce a bullish breakout. This is a friendly reminder.
Full Futures Trading Trade-Numbers below:
________
LONG RVNUSDT
ENTRY: 0.01250 - 0.01460 (STOP: 0.01240)
TARGETS: 0.01902, 0.02538, 0.03569, 0.04600, 0.05236
________
These setups can be approached with leverage up to 20X. If the stop-loss ranges around 3-5%, 20X is possible. If the stop-loss is 5-8%, then 10X is possible, etc.
A chart setup with 20X lev. potential can be extremely safe when approached with 2-3X. There are many ways to approach the market; opportunities are endless.
Thanks a lot for your continued support.
Namaste.
Ravencoin ( RVN)RVN usdt Daily analysis
Time frame 4hours
Risk rewards ratio >1.5
Target = 0.01133
Short position for short time

RVNUSDT Massive Breakout Loading? After 2 Years of Compression!
📈 Weekly Technical Analysis: Ravencoin (RVN/USDT)
🧠 Main Pattern: Descending Triangle ⚠️
Ravencoin has been consolidating within a Descending Triangle since early 2021 — typically a bearish continuation pattern, but one that can lead to a massive trend reversal if the upper boundary is broken.
🟨 Key Accumulation Zone:
📍 Support Area: $0.01280 – $0.01080
This zone has been tested multiple times and has shown strong buyer defense since 2022.
📏 Dynamic Resistance:
📍 Downward sloping trendline from the 2021 peak — currently acting as major resistance.
🟢 Bullish Scenario: Breakout Ahead? 🌕🚀
If RVN breaks above the descending trendline (~$0.01903) and closes strongly on the weekly chart, we could see a major uptrend unfold.
🎯 Bullish Targets:
🪙 $0.03217 — Minor horizontal resistance
🪙 $0.05028 — Key psychological level
🪙 $0.12842 — Major historical resistance
🪙 $0.21221 — Long-term bullish target
🔍 Breakout Confirmation Checklist: ✅ Weekly candle close above resistance
✅ Strong volume spike
✅ RSI rebound from oversold territory
🔴 Bearish Scenario: Breakdown Warning ⚠️📉
If price fails to hold the support zone at $0.01280:
❌ First target: $0.01080
❌ Breakdown risk: $0.00712
❌ Breakdown from triangle may confirm long-term bearish continuation
🎯 Conclusion & Strategy:
📌 Price is nearing the apex of a multi-year compression pattern
📌 A breakout could lead to exponential upside potential
📌 Great setup for swing or position traders
📌 Wait for confirmed breakout with volume before entry
#RVNUSDT #Ravencoin #CryptoBreakout #TechnicalAnalysis #AltcoinSeason #DescendingTriangle #BinanceTrading #BreakoutSignal

Ravencoin Bullish Continuation, Altcoins Bull Market ConfirmedRavencoin produced a major bullish breakout, we've seen many of those. It happens that you get one of these breakouts but the following week bullish action is dead. That was all, end of story. This isn't the case here and this is truly great news.
First, Ravencoin produced some of the biggest volume ever, only once was there a week with higher volume and the volume in the last two weeks is higher even than in the 2021 bull market. This clearly reveals the start of the next bullish phase, at least for this pair, but never in the history of Crypto has this project or any other gone on a bull market on its own, not in 2021 and not in 2025. What one does, the rest follows.
So we have a bullish continuation. Really high volume to break above EMA34 followed by additional growth. We can expect this trend to continue. These weekly candles are the biggest since 2021.
Get ready, because the same will happen across hundreds of altcoins.
Here is the daily timeframe:
Two days red and it is clear that this project is creating a new uptrend... Thank you for reading.
Namaste.

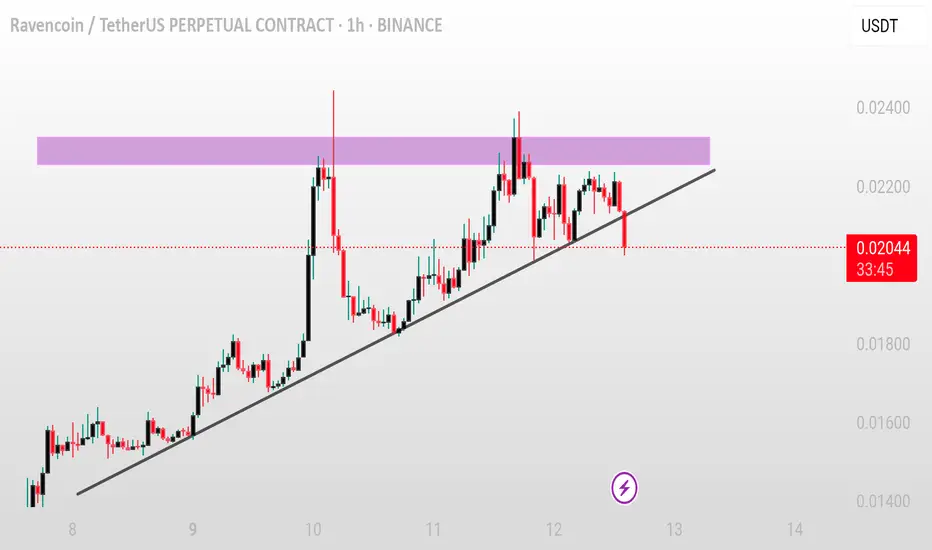
RVN/USDT – Ascending Trendline Breakdown in Play
**Pair:** RVN/USDT 💱
**Timeframe:** 1H ⏱️
**Pattern:** Ascending Trendline Breakdown Attempt ⚠️
RVN is currently attempting to break below a key ascending trendline near **0.0209**. This level has held several times, but selling pressure is increasing 📉.
**Bearish Scenario ❌**
A confirmed 1H close below **0.0205** could trigger downside momentum:
🎯 Target 1: 0.0195
🎯 Target 2: 0.0180
📉 Breakdown may accelerate if volume increases.
**Bullish Defense ✅**
If bulls reclaim **0.0220** and defend the trendline again, upside continuation remains possible.
🛑 SL (for shorts): above 0.0225
🔍 Wait for confirmation — fakeouts are common near support zones.
Altcoins Market Bull Market Confirmed, RavencoinI have something very, very interesting here, and it has two parts.
1) Ravencoin is breaking out with three digits green, +150% within today's candle.
2) This is very interesting because this is the exact same chart as all the other major and minor altcoins —What one does, the rest follows. It confirms the altcoins market bull market is here.
First, let me ask you something; Would an altcoin breakup by 150% in a single day in a correction or bear market? This only happens preceding a major bullish phase.
Ravencoin hit bottom early April, the low first happened on the 7th followed by double-bottom on the 9th. This led to a small recovery and now a massive bullish breakout.
All the altcoins we've been seeing, most of them, bottomed early April as well. All of these produced some growth between April and May. All of these went into a retrace late May to early June, and all those will start to break up soon.
The altcoins market bull market is already confirmed, this is proof.
Prepare for massive growth.
Thanks a lot for your continued support.
Namaste.

RVNUSDT Forming Bullish ReversalsRVNUSDT is currently showing a promising technical setup after an extended period of consolidation. The price has formed a strong base, supported by steady volume growth, which indicates renewed interest from both retail and institutional traders. This consolidation phase appears to be nearing completion, and a breakout from this level could trigger a powerful bullish rally. Based on the current structure and market momentum, a 70% to 80% gain is anticipated in the upcoming weeks.
Ravencoin (RVN) has maintained relevance in the blockchain space due to its unique focus on asset tokenization. It enables the creation and transfer of real-world assets on the blockchain, which is a growing narrative in the Web3 and DeFi sectors. As more investors seek alternative platforms to tokenize assets and explore decentralized finance, RVN is positioned to benefit from the increased use case demand and adoption.
Technically, RVNUSDT has respected key support zones, and the price action suggests accumulation by long-term holders. A confirmed breakout above recent resistance could catalyze the start of a bullish wave, with price targets aligning around historical resistance levels. The volume uptick further validates the possibility of a breakout, hinting at increased buyer activity and confidence in the project’s future.
Overall, RVNUSDT presents a compelling risk-reward setup for traders and investors watching altcoins with real utility and strong community backing. With the chart structure, fundamentals, and volume all aligning, this crypto pair could be preparing for a significant upward movement.
✅ Show your support by hitting the like button and
✅ Leaving a comment below! (What is You opinion about this Coin)
Your feedback and engagement keep me inspired to share more insightful market analysis with you!
RVN Looks Bullish (1W)It’s one of the coins we are highly bullish on.
A major liquidity pool has been swept, and the price has hit an important origin level.
As long as the upper green zone holds, it can move toward the targets on the daily and weekly timeframes. The targets are marked on the chart.
A weekly candle close below the invalidation level would invalidate this analysis.
For risk management, please don't forget stop loss and capital management
Comment if you have any questions
Thank You

RVNUSDT 1D AnalysisRVN ~ 1D Analysis
#RVN If you still have confidence in this coin, perhaps you can consider this support to start buying back with a short-term target of at least 10%+ from here.

RVNUSDT 1W AnalysisRVN ~ 1W Analysis
#RVN Buy gradually from here if you still have a Conviction on this coin with a short -term target of at least 20%+.

RVN is about to fly.All altcoins are looking beautiful, Expecting a 2x move for RVN Coin.
Weekly support hit, Send it

Trading opportunity for Ravencoin RVNUSDTBased on technical factors there is a Buy position in :
📊 RVNUSDT
🔵 Buy Now
🪫Stop loss 0.01040
🔋Target 0.01820
📏 R/R 2,2
💸RISK : 1%
We hope it is profitable for you ❤️
Please support our activity with your likes👍 and comments📝

RVNUSDT 1WRVN ~ 1W Analysis
#RVN Buy gradually from here with a short -term target of at least 20%+.
Reason, This is the lowest support block for now.

RVNUSDT 1WRVN ~ 1W Analysis
#RVN This is the lowest support for now. Buy from here if you still have a Conviction on this coin.

RVNUSDT 1WRVN ~ 1W Analysis
#RVN So far continues to maintain this support block. Buy from here if you still have a Conviction on this coin with a minimum target of 20%+
RVNUSDT Top Down AnalysisRVNUSDT Analysis
Blue Box: A Strong Entry Opportunity
We have a daily upward break from a key monthly demand zone—this is a significant move!
Highlights:
Monthly Demand Zone: Price has respected this area and broken upwards, showing strong buyer interest.
CDV Support: Cumulative delta volume is aligning perfectly, confirming active buyers in the market.
Blue Box Entry: Carefully chosen using volume footprint, volume profile, and liquidity heatmap. It’s an excellent level to consider.
Key Observations:
"The blue box is very carefully picked using volume footprint, volume profile, cumulative delta volume, and liquidity heatmap. When trading this zone, I will look for buyers and upward market structure breaks in lower time frames for confirmation."
This setup is looking great, and the confirmation from CDV adds extra confidence. Let’s keep an eye on this one! 🚀
Let me tell you, this is something special. These insights, these setups—they’re not just good; they’re game-changers. I've spent years refining my approach, and the results speak for themselves. People are always asking, "How do you spot these opportunities?" It’s simple: experience, clarity, and a focus on high-probability moves.
Want to know how I use heatmaps, cumulative volume delta, and volume footprint techniques to find demand zones with precision? I’m happy to share—just send me a message. No cost, no catch. I believe in helping people make smarter decisions.
Here are some of my recent analyses. Each one highlights key opportunities:
🚀 RENDERUSDT: Strategic Support Zones at the Blue Boxes +%45 Reaction
🎯 PUNDIXUSDT: Huge Opportunity | 250% Volume Spike - %60 Reaction Sniper Entry
🌐 CryptoMarkets TOTAL2: Support Zone
🚀 GMTUSDT: %35 FAST REJECTION FROM THE RED BOX
🎯 ZENUSDT.P: Patience & Profitability | %230 Reaction from the Sniper Entry
🎯 DEXEUSDT %180 Reaction with %9 Stop
🐶 DOGEUSDT.P: Next Move
🎨 RENDERUSDT.P: Opportunity of the Month
💎 ETHUSDT.P: Where to Retrace
🟢 BNBUSDT.P: Potential Surge
📊 BTC Dominance: Reaction Zone
🌊 WAVESUSDT.P: Demand Zone Potential
🟣 UNIUSDT.P: Long-Term Trade
🔵 XRPUSDT.P: Entry Zones
🔗 LINKUSDT.P: Follow The River
📈 BTCUSDT.P: Two Key Demand Zones
🟩 POLUSDT: Bullish Momentum
🌟 PENDLEUSDT.P: Where Opportunity Meets Precision
🔥 BTCUSDT.P: Liquidation of Highly Leveraged Longs
🌊 SOLUSDT.P: SOL's Dip - Your Opportunity
🐸 1000PEPEUSDT.P: Prime Bounce Zone Unlocked
🚀 ETHUSDT.P: Set to Explode - Don't Miss This Game Changer
🤖 IQUSDT: Smart Plan
⚡️ PONDUSDT: A Trade Not Taken Is Better Than a Losing One
💼 STMXUSDT: 2 Buying Areas
🐢 TURBOUSDT: Buy Zones and Buyer Presence
🌍 ICPUSDT.P: Massive Upside Potential | Check the Trade Update For Seeing Results
🟠 IDEXUSDT: Spot Buy Area | %26 Profit if You Trade with MSB
📌 USUALUSDT: Buyers Are Active + %70 Profit in Total
🌟 FORTHUSDT: Sniper Entry +%26 Reaction
🐳 QKCUSDT: Sniper Entry +%57 Reaction
📊 BTC.D: Retest of Key Area Highly Likely
This list? It’s just a small piece of what I’ve been working on. There’s so much more. Go check my profile, see the results for yourself. My goal is simple: provide value and help you win. If you’ve got questions, I’ve got answers. Let’s get to work!

RVNUSDT 1WRVN ~ 1W
#RVN If you still have Conviction on this coin. Buy in increments within this block. with a minimum target of 20%. It is only a matter of time until this resistance line is broken.

not your time to fly yet little Raven RVNmassive triangle still unconquered for RVN. Check back next year

RVNUSDT 1WRVN ~ 1W
#RVN If you still have Conviction on this coin. Buy in increments within this block. with a minimum target of 20%. It is only a matter of time until this resistance line is broken.

#RVN ( SPOT) ..Entry range(,0150 -- ,01650) . SL(,01481)#RVN
Entry range (,0150 -- ,01650)
SL .4H close below (,01481)
Last target (0.02839)
#RVN
#RVNUSDT
#RVNUSD
#swingtrade
#shortterminvestment
#ALTCOIN
#Cryptotading
#cryptoinvesting
#investment
##trading
#cryptocurrencytrading
#bitcoininvestments
#Investing_Coins
#Investingcoins
#Crypto_investing
#Cryptoinvesting
**** #Manta ,#OMNI, #DYM, #AI, #IO, #XAI , #ACE #NFP #RAD #WLD #ORDI #BLUR #RVN ****
#bitcoin
#BTC
#BTCUSDT
BINANCE:RVNUSDT
