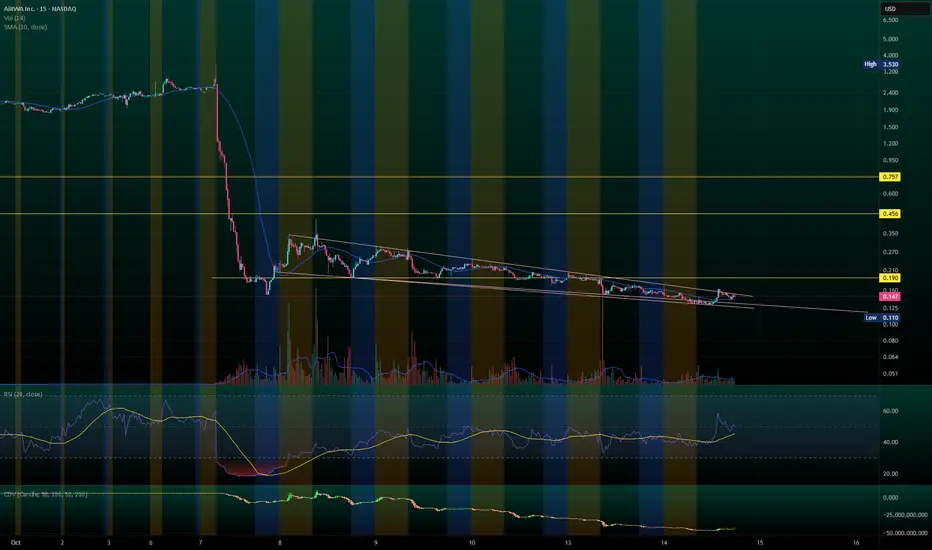
YYAI oversoldHard to say what has happened in the past week, but see below. In any case, I believe PA is about to reverse.
NASDAQ:YYAI Facts:
- YYAI has authorization to issue $200 m ATM shares
- YYAI has agreed to fund their new venture for $250 mil along with a second $250 mil from JuCoin
- YYAI has received $30 mil in SOL (see my other posts)
- If YYAI issued shares totaling more than approximately 20% of outstanding shares, they would need to file an 8-k within 4 business days of issuance, or else face legal problems
- There has been no 8-k and we are on day 5 post-dumparoo
- YYAI daily volume has gone 1000x from typical days (why?)
- YYAI short volume has been 5-10x the current outstanding shares
- YYAI is down 94% from two weeks ago
The question remains, was there dilution, if so how much? If no 8-k this week, can assume there was none or little (or worse, company is fraudulent).
If no 8-k the dump is from a massive coordinated short attack.
If dump was a massive coordinated short attack, price will likely rebound, unless attack continues.
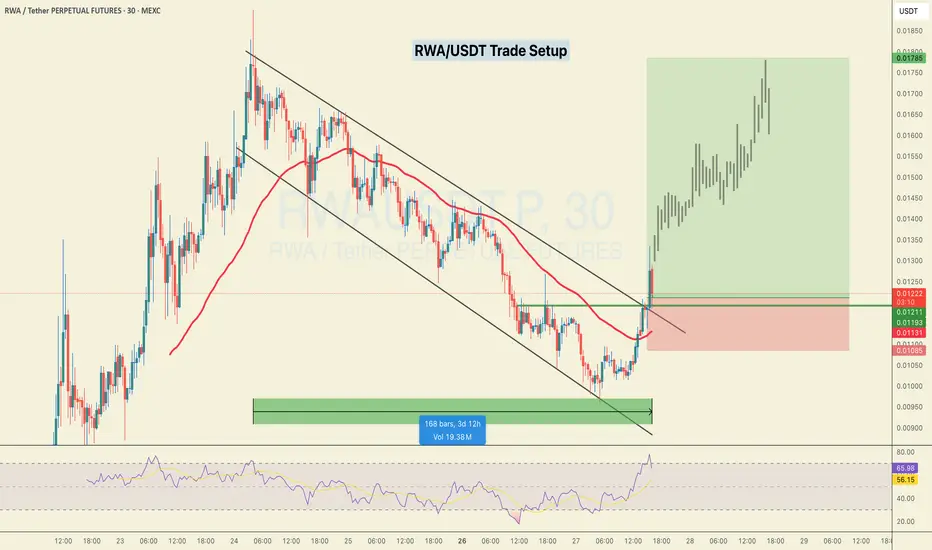
Rwacrypto
DMTR/USDT - ABSOLUTE GEM!! x50 MINIMUMTargeting the 0.003/35 area! Strong bounce and strength since last weeks crash - Real giant in RWA and AI sectors proven tech and innovation - BUYING ANY FURTHER DIPS BUT CONFIDENT OF UPWARDS PRICE - DONT SLEEP ON DMTR OVER THE NEXT 12months!! SEND ITTTT

YieldBricks | $YBR | Real world asset accumulation zone This #RWA gem YieldBricks ( MEXC:YBRUSDT ) is still trading inside the accumulation zone, and we are in the end of a healthy pullback → a good time to DCA.

ZKUSDT - your capital will be doubled on thisIf you want to double your capital in a short period, then ZK is the coin to focus on.
-It’s still at the bottom.
-It formed a symmetrical triangle and already broke out, now doing a retest.
-There’s also an inverse head & shoulders pattern in play.
-Currently sitting right on the 25 EMA support on the daily timeframe.
Buy it spot, and you’ll thank me later.
Best Regards:
Ceciliones🎯

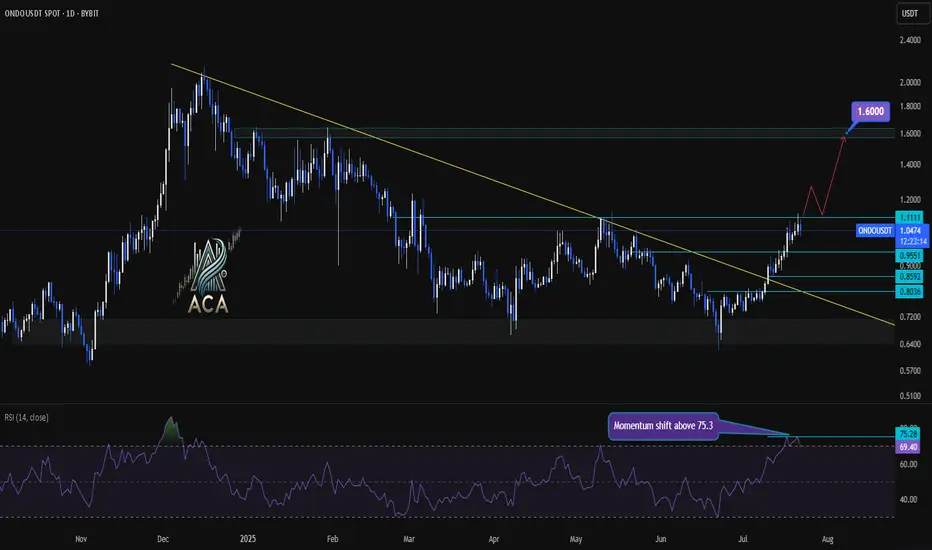
ONDOUSDT Daily Chart Analysis | Momentum Shift & Breakout LevelsONDOUSDT Daily Chart Analysis | Momentum Shift & Breakout Levels
🔍 Let’s dive into the ONDO/USDT daily chart and break down the latest momentum signals, key breakout areas, and targets for bulls.
⏳ Daily Chart Overview
The daily trend shows significant recovery after prolonged downward pressure, with price action now testing critical resistance levels. A key descending trend line has recently been challenged, highlighting a potential shift in market structure.
🔺 Bullish Setup
- Momentum Trigger: The RSI has closed above 75.3, signaling a strong momentum shift and upping the odds for continued upside.
- Breakout Confirmation: Watch for a daily candle close above the $1.1111 resistance level. This would confirm a bullish breakout and could serve as a solid trigger for further upside.
- Trend Line Dynamics: The price has decisively broken above the major descending trend line, which had capped rallies for months—removing a significant area of supply and emboldening bulls.
- Upside Target: Once confirmed, this setup opens the door for an advance towards the $1.60 area, where the next major resistance sits.
📊 Key Highlights
- Daily RSI closing above 75.3 reflects strong market momentum and buyer dominance.
- A daily candle close above $1.1111 can be used as a bullish trigger.
- The long-term descending trend line has been broken, indicating a major momentum shift.
- Immediate upside target stands at $1.60, representing a clear resistance level for profits or further evaluation.
🚨 Conclusion
Momentum is clearly shifting in favor of the bulls as technical barriers fall by the wayside. For traders looking to position long, confirmation above $1.1111 combined with the powerful RSI reading sets the stage for a move towards $1.60—keep these levels on your radar as the setup plays out!
CPOOL Is Winding Up for a Major Breakout! Key Levels to WatchYello, Paradisers! have you noticed how CPOOL has been quietly coiling for over three months without much noise?
💎After a prolonged downside, CPOOL is now completing a textbook 100-day accumulation band, which is historically the perfect springboard for a major trend reversal. Let’s break down why the next move could be explosive:
💎CPOOL is now facing a multi-month descending resistance at $0.165. This level is critical. A breakout here would likely trigger a strong push toward the top of the accumulation range, between $0.183 and $0.205. That’s the real test for the bulls, if they clear it, the upside opens up fast.
💎Above this zone, the next big target is $0.28 to $0.30, which lines up with the 50% Fibonacci retracement and is a strong resistance level. This is where caution is advised.
💎What makes this setup even more interesting is how fast CPOOL’s dynamic levels are tightening. That’s a classic sign of a volatility squeeze, the kind that usually leads to explosive moves. On the downside, $0.12 offers initial moderate support, but the real foundation sits between $0.100 and $0.095, where price has bounced hard three times since March.
Paradisers, strive for consistency, not quick profits. Treat the market as a businessman, not as a gambler.
MyCryptoParadise
iFeel the success🌴

$RWAUSDT 1D ChartLSE:RWA 1D chart shows a bullish bounce from the long-term descending trendline.
The price is now targeting the key resistance zone between $0.018175 and $0.021445.
A breakout above this range could trigger a strong rally of over +300%. Momentum looks promising.
Watch this level closely for confirmation.
DYRO, NFA

$RWA is ready for a massive 50% pump.About RWA:- Allo is building the world’s first exchange for tokenised stocks with 24/7 trading, low fees and instant settlement to democratize investing. Built on blockchain technology, Allo has tokenised $2.2B in RWAs, staked $50M in BTC, and launched a $100M lending facility.
The fundamentals look good, and so does the chart.
A massive breakout after 4 days of consolidation inside the channel.
ENTRY :- .01150 .01240
Target:- 1390, 1477,1558,1623,1785
SL : 1020
Keep the leverage low.
If you want me to post more setups like these, do show your support with a like.
Thank you
#PEACE
$RWA Breakout Setup LSE:RWA just broke out of the channel with strong momentum.
- Entry: NYSE:CMP
- Target: $0.01454 – $0.01900
- SL: $0.01064
DYRO, NFA

Phemex Analysis #73: Pro Tips to Trade OM Upon the 90% CrashMANTRA (OM) experienced a dramatic price crash of over 90% last Sunday (April 13th). While many initially suspected a "rug pull" event, similar to what happened with Luna and FTX, OM Founder JP Mullin attributes the massive sell-off to forced liquidations at an exchange, triggering a panic sell-off. While the exact cause of this 90% crash is still unconfirmed, this volatility presents significant trading opportunities.
We suggest that traders use smaller time frames, such as 1-hour or 15-minute charts, to identify more trading opportunities in this volatile situation.
Here are possible scenarios on the 15-minute chart:
Possible Scenarios
1. V-Shaped Recovery
If strong buying pressure emerges and quickly pushes the price back up to pre-crash levels, it could signal a V-shaped recovery. This would indicate that the market has absorbed the sell-off and buyers are back in control.
Pro Tips:
Watch for large green candles with significant volume on the 15-minute chart, that rise above $0.89 or $1.0.
Consider entering a long position on the breakout above key resistance levels ($0.89 & $1.0).
Place a stop-loss order below a recent swing low to protect against a reversal.
2. Consolidation and Accumulation.
The price may consolidate in a range after the crash, as the market tries to find a new equilibrium. This consolidation phase could represent a period of accumulation, where buyers are slowly absorbing the remaining supply.
Pro Tips:
Identify key support and resistance levels within the consolidation range, which is $0.89 to $0.73 or $1.0 to $0.55.
Consider range-bound trading strategies, such as buying near support and selling near resistance.
Alternatively, use Phemex Grid Bots to capitalize all the small price movement during the accumulation phase.
3. Further Decline
If the selling pressure continues or new negative information emerges, the price could decline further. This scenario would be characterized by continued large red candles and a lack of significant buying interest.
Pro Tips:
Monitor key support levels ($0.73, $0.55 & $0.45); a break below these levels could trigger further selling.
Consider exiting any long positions to avoid further losses.
Be cautious about entering new long positions until a clear bottom has been established.
Consider shorting opportunities if the price breaks down through significant support, but manage risk carefully.
Conclusion
The 90% crash in MANTRA (OM) has created a highly volatile trading environment. While the cause of the crash remains debated, the current market conditions offer substantial trading opportunities. By analyzing price action on smaller time frames, such as the 15-minute chart, and considering the scenarios outlined above, traders can potentially profit from both upward and downward price movements. However, it is crucial to exercise caution, manage risk effectively, and stay informed about any new developments related to MANTRA (OM).
Pro Tips:
Elevate Your Trading Game with Phemex. Experience unparalleled flexibility with features like multiple watchlists, basket orders, and real-time adjustments to strategy orders. Our USDT-based scaled orders give you precise control over your risk, while iceberg orders provide stealthy execution.
Disclaimer: This is NOT financial or investment advice. Please conduct your own research (DYOR). Phemex is not responsible, directly or indirectly, for any damage or loss incurred or claimed to be caused by or in association with the use of or reliance on any content, goods, or services mentioned in this article.

CPOOL Struggling to Hold—Will Bears Push It Even Lower?Yello, Paradisers! #CPOOL has been struggling to gain bullish momentum, and the risk of further downside is increasing. Let’s break it down.
💎#CPOOLUSDT has been stuck in a descending channel since its highs back in December 2024, and so far, the bears remain in control. As long as bulls fail to break out of this structure, the price will continue trending downward.
💎Recently, CPOOL bounced off the descending support at $0.1750, and looks in a position to be pushing towards $0.2160 and potentially $0.2500. But don’t get too excited just yet—this move remains within the bearish structure, and sellers are likely to step in again.
💎If the bears regain momentum, expect a breakdown below support, accelerating towards $0.1540, with key support levels waiting at $0.1250 - $0.1130. This is where weekly support could kick in, potentially leading to a higher time-frame reversal.
💎For bulls to take full control, CPOOL needs to reclaim and hold above $0.2850 - $0.3050. If that happens, we could be looking at the beginning of a strong bullish trend, with new highs on the horizon.
Strive for consistency, not quick profits. The market rewards discipline and patience—trade smart, Paradisers!
MyCryptoParadise
iFeel the success 🌴

$ONDO mechanism for BlackRock tokenizationYou know how optimistic we are about tokenizing real world assets and ONDO is one of the projects for tokenization. The most influential investment fund BlackRock is an investor in ONDO and is ready to tokenize its assets. My minimum forecast for the foreseeable future is $3.45. Buckle up!
Horban Brothers.

Pendle: A DeFi tool for risk and revenue sharingPendle is not just another DeFi project, it's a tool that cuts to the heart of the cryptocurrency profitability problem. Most people in the industry are chasing quick profits, not realizing that the market is a zero-sum game in which most people lose. Pendle, on the other hand, offers something different: the ability to split an asset into principal and future gains by tokenizing them. It's not just clever, it's brilliant. Why? Because it allows traders and investors to manage risk and return in a way that no one else can. Most DeFi protocols are just pretty wrappers for high-risk schemes. They promise you returns, but they don't tell you that you're risking everything, especially in a bear market. Pendle solves this problem by allowing you to lock in a return in advance or speculate on it. It's like insurance against volatility, but with the opportunity to earn more if you know what you're doing. And here's the paradox: the DeFi market is growing, but most participants don't even understand how the underlying economics work. Pendle gives you the tools to stay one step ahead. One more point: tokenizing yield through PT (base token) and YT (yield token) is not just a technical trick. It's a way to separate risks and opportunities. You can sell YT if you want to get rid of uncertainty, or buy it if you believe in yield growth. It's like options, but in the DeFi world where the rules aren't settled yet. And guess what? Most investors don't realize this. They only see the price of the PENDLE token, but they don't see what's behind it.
Alex Kostenich,
Horban Brothers.

ONDO Ready to Explode? Bulls Pushing for a Major Breakout!Yello, Paradisers! While most altcoins are struggling, #ONDOUSDT is showing incredible strength despite the ongoing market correction. But the big question is—can it break through resistance and rally higher? Let’s break it down!
💎#ONDO is currently forming what looks like an ascending triangle, a bullish pattern that signals a potential breakout. The price has been steadily climbing, but bulls now face a decisive resistance at $1.55–$1.60. This level is the neckline of the pattern, meaning a strong breakout here could send prices flying toward higher targets.
💎If ONDO manages to break out with strong volume, the next strong resistance lies at $1.84–$1.90—right around the recent 52-week high. Some short-term profit-taking could happen at this level, but if bulls push through, $2.10–$2.20 becomes the next major target, which aligns with the full pattern breakout projection.
💎On the downside, ONDO has strong support levels to hold the trend. The first support sits at $1.33–$1.295, reinforced by an ascending trendline. Just below, the EMA-250 adds another layer of protection against deeper corrections. Even if sellers gain momentum, ONDO enjoys a solid strong support at $1.18–$1.12, a key demand zone capable of absorbing heavy selling pressure.
Stay sharp, Paradisers! The market doesn’t forgive emotional decisions stick to the plan and execute like a pro!
MyCryptoParadise
iFeel the success🌴

Is CPOOL on the Verge of a Bullish Breakout?Yello, Paradisers! Could #CPOOL be preparing for a significant bullish reversal right now? What we’re seeing on the chart suggests that bulls may be quietly building momentum—but there’s one key breakout level they need to conquer first. Let’s break it down:
💎#CPOOL is currently trading within a descending channel, but things are starting to get interesting. The price just re-tested a major breakout level, and we’re seeing a strong reaction from that zone. This type of reaction is a classic bullish clue—suggesting buyers may be looking to take back control and push CPOOL higher from here.
💎CPOOL has a strong support presence at the levels of $0.250 and $0.265, this range has already proven its strength. Notice how CPOOL’s recent dip into this area triggered a sharp bounce that erased nearly three days of losses. This reaction from support is a strong indication that buyers are still defending this zone aggressively.
💎Over the next few hours, we could see CPOOL enter a short-term consolidation phase or dip slightly for a minor retest of the $0.30 support level. A clean hold above this zone would be a solid base for bulls to build on.
💎On the other hand, for bulls to really take charge, they must break above the $0.370 resistance level. If they manage to do that, the path opens up to a much more critical level at $0.425—the descending channel resistance. This level is pivotal as break out above this can create a powerful bullish rally pushing straight towards the $0.475 to $0.495 region, where a key 0.618 Fibonacci retracement level is waiting.
💎However, we need to be cautious around this Fibonacci zone. Historically, the 0.618 level often triggers profit-taking and temporary pullbacks. It’s a level where both bulls and bears tend to battle it out—so watch for potential hesitation or rejection in that area.
Patience and discipline are key here, Paradisers. The market often tests both bulls and bears before making decisive moves, so stay vigilant.
MyCryptoParadise
iFeel the success🌴

CPOOL on the Brink: Will Sellers Trigger a Massive Drop?Yello, Paradisers! #CPOOL has enjoyed a solid bullish leg recently, but things are starting to look heavy. The price is currently moving inside a major triangle pattern, a typical structure that signals a potential corrective phase. While bulls still hold their ground, there are clear signs that sellers could take control if key support levels are broken.
💎The first major neckline support sits between $0.3800 and $0.3620, and this is where the real battle is happening right now. It’s a critical zone for #CPOOLUSDT, as bulls will need to defend it to avoid further downside pressure. If this level holds, we could see consolidation within the current range, giving bulls another chance to regain control.
💎However, if sellers manage to break through this support, it’s likely to trigger a corrective wave that could push the price toward the next lower support zone between $0.2995 and $0.2850. This region is particularly significant because it aligns with the triangle pattern target, making it a logical area for a reaction. Buyers stepping in aggressively here could lead to a sharp “slingshot” rebound.
💎On the flip side, bulls face a strong descending resistance level at $0.4720, which also aligns with horizontal resistance. This zone will be a tough one to break, and until CPOOL clears it, any bullish moves will remain capped.
Paradisers, this setup is looking very promising—but don’t forget, discipline and patience are key in this market.
MyCryptoParadise
iFeel the success🌴

Last chance before we go up!!RWA Inc. is a cryptocurrency that focuses on tokenizing real-world assets, aiming to bridge traditional finance with blockchain technology. Recently, RWA Inc. has experienced a notable decline in its market value. Over the past week, the price has decreased by approximately 18.60%, underperforming compared to the global cryptocurrency market, which saw a decline of about 1.40% during the same period.
COINGECKO
As of January 3, 2025, RWA Inc.'s price is approximately $0.08496, with a 24-hour trading volume around $3,077,637. This represents a 2.62% decrease in the last 24 hours. The current market capitalization is approximately $10,696,511, with a circulating supply of about 125,898,562 RWA tokens.
COINMARKETCAP
The recent downturn in RWA Inc.'s value aligns with a broader market trend affecting many cryptocurrencies, particularly those associated with real-world assets (RWA). A recent Bitcoin sell-off has had a cascading effect, leading to significant losses across various RWA tokens.
COINMARKETCAP
It's important to note that the cryptocurrency market is highly volatile, and such fluctuations are common. While the recent decline may be concerning, it's also an opportunity to reassess and strategize for potential recovery. Staying informed about market trends and developments within the RWA sector can provide valuable insights for future investment decisions.
For the most current information, consider monitoring real-time cryptocurrency tracking platforms and staying updated with news from reputable financial sources.

SOIL in countertrendI've been noticing more than once that SOIL usually moves against the market or, at least, it does so for a couple of days. Then if market keeps going in a certain direction for many days it follows.
In this case we can see cryptomarket dumping and shaping up bearish on weekly timeframe, in this case instead SOIL seems to be slowing the dumping and shaping up as reversal on W:
while on daily instead it's attempting to bounce. Pretty weird, right? If you guys want a promising RWA this is a bag I feel confident to suggest. below around 0.636 USDT area it's all buy zone in my opinion. I'd avoid using leverage in this period, I expect a red month.
Good luck.

Ava alt coin season targetsWith tokenisation and RWA sector AVA can be interesting opportunity
GATEIO:AVAUSDT Main idea I shared in march 2024. So here is updates
From global accumulation zone on W tf we pumped on news. But with news our without price will deliver this coin to the right targets! Like you can see we got reaction at 0.38 lvl by fib and just close all Order flow what we've form in 2022
Possible Targets and explanation idea
➡️Half B market cap realistic targets at 1.681 lvl and new ath
➡️2 years in accumulation zone with since May 2024 clear buy back signals
➡️Since 2022 Money inflow from big players MP indicator
➡️After local pump over 400% some of them fix profit and we can see Money Outflow.
➡️ Hard to say about timing but for upcoming alt season I think 2 flag marked targets can be good zones to start fix profit step by step
Hope you enjoyed the content I created, You can support with your likes and comments this idea so more people can watch!
✅Disclaimer: Please be aware of the risks involved in trading. This idea was made for educational purposes only not for financial Investment Purposes.
---
• Look at my ideas about interesting altcoins in the related section down below ↓
• For more ideas please hit "Like" and "Follow"!

Polytrade (RWA project) $TRADEPolytrade continues its momentum! One of our favorite projects in the RWA sector. I expect the price to rise to the area of $6.5 minimum. Dynamics is positive, held 50 EMA, now only up!

HTS (HOME3) undervalued GEM in RWA world. ICT analysis.everything is shown in the charts.
targets are measured by SDP.
the token itself is a microcap gem.


CPOOL - Looking good here for potential further upward momentumCPOOL - Looking good here for potential further upward momentum. CPoolUSDT
