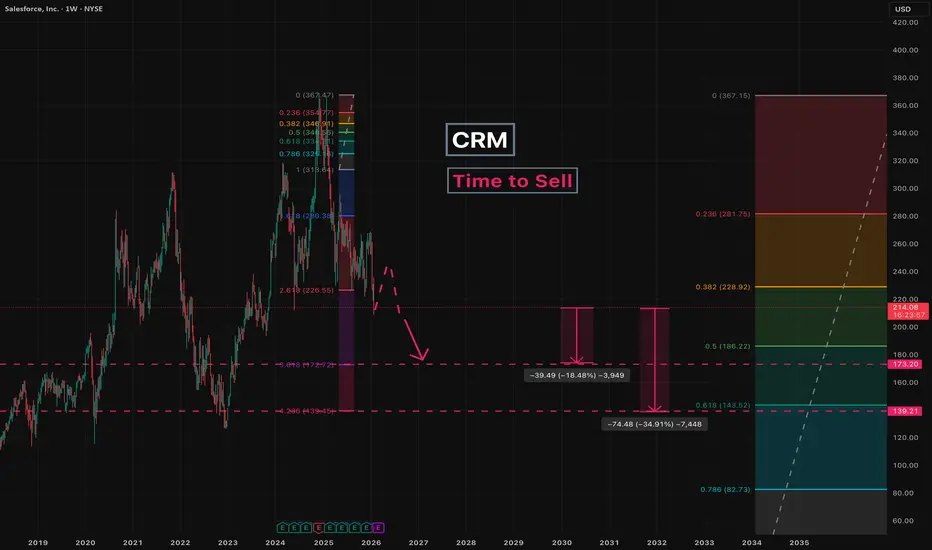
CRM - Time to SellSince December 2024, a five -wave impulsive decline has been developing.
We are now entering the fifth wave.
At the moment, a minor pullback is possible before the decline continues, so caution is advised.
A return to the 367 level from current prices appears unlikely.
Key targets:
173
139
Estimated downside potential from current levels:
18–35%
---
Please subscribe and leave a comment!
You’ll get new information faster than anyone else.
---
Salesforce
Is Salesforce Now a Defense Contractor?Salesforce has reached a defining inflection point that fundamentally transforms its corporate identity. The company, historically known as a commercial software provider, has secured a massive $5.64 billion contract with the U.S. Army extending through 2035. For the first time, the tech giant is positioning itself as a "defense prime contractor" and embracing the Trump administration's provocative rebranding of the Department of Defense as the "Department of War." This move not only stabilizes the company's revenue stream with a long-term, firm-fixed-price agreement but also places it at the center of U.S.-China geopolitical competition and brings it closer to the traditional defense industrial base.
The market has responded with enthusiasm - analysts have raised price targets above $320 per share, and investors view the contract as a bond-like guarantee of stable cash flow. The company's stock surged to the $257 range in early 2026, reflecting Wall Street's revaluation of Salesforce as critical national infrastructure rather than as a volatile SaaS business. However, the pivot carries significant risks. It jeopardizes Salesforce's operations in China, where it has operated for years through local partnerships, and raises serious questions about data sovereignty in Europe, particularly given the U.S. CLOUD Act. With 20% of revenues coming from Europe, Salesforce is entering direct conflict with the digital sovereignty demands of leaders like Macron and Scholz.
The technological dimension is equally compelling: Salesforce is aggressively investing in Agentforce, its autonomous AI agent platform, competing directly with Palantir for dominance in the government software market. The technology promises radical automation of military logistics and personnel management, leveraging Salesforce's enormous advantage in commercial customer data across millions of users. CEO Marc Benioff has emphasized their pricing advantage, undercutting competitors by amortizing R&D costs across their massive commercial base. Yet questions remain: can this pivot deliver long-term returns, or will the company find itself caught in trade wars, sanctions, and regulatory restrictions that undermine future profitability? The transformation from SaaS giant to defense contractor represents either a brilliant strategic repositioning or a dangerous entanglement with geopolitical risk.

Salesforce Wins $5.6B Army Deal: AI & Strategic AnalysisAn in-depth analysis of Salesforce’s $5.6B U.S. Army contract and its multi-domain impact on CRM stock.
Geostrategy and Geopolitics: The Defense Pivot
Salesforce effectively entered the hard-power arena with its $5.6 billion U.S. Army contract. This move transcends typical software procurement. It signals a strategic alignment between Silicon Valley innovation and national security imperatives. The Pentagon, now emphasizing an "AI-first" warfighting stance, requires robust commercial partners. Salesforce’s "Missionforce" initiative directly addresses this geopolitical need. By securing this foothold, Salesforce mitigates risks associated with purely commercial market fluctuations. The deal positions the company as a critical infrastructure provider for the Department of Defense. This geopolitical integration offers a long-term hedge against global economic instability.
Business Models and Economics: The IDIQ Structure
Investors must scrutinize the "indefinite-delivery, indefinite-quantity" (IDIQ) nature of this agreement. While the $5.6 billion headline figure grabs attention, it represents a ceiling, not guaranteed revenue. The actual economic value depends entirely on the velocity of task orders. This business model shifts the focus from immediate bookings to long-term consumption utility. Analysts note a transition from buying software to "orchestrating outcomes at scale." Consequently, revenue recognition will likely trickle in rather than surge. This structure demands patience from shareholders expecting immediate quarterly spikes.
Technology and High-Tech Innovation: Agentic AI
The core value proposition lies in "Agentic AI." Salesforce aims to deploy autonomous agents that streamline logistics and decision-making. This technology leapfrogs traditional static dashboards. The Army contract specifically targets the unification of disparate data sources. By creating a "trusted data fabric," Salesforce lays the groundwork for advanced AI deployment. This focus aligns with the Pentagon’s broader GenAI.mil initiative. Success here proves that Salesforce’s AI tools work in high-stakes, chaotic environments.
Industry Trends and Competition
The government IT sector remains a crowded battlefield. Microsoft and Oracle traditionally dominate this space, while Palantir commands the data analytics niche. Salesforce’s entry disrupts this oligopoly. The contract validates Salesforce’s ability to compete for massive federal allocations. It challenges the assumption that CRM tools lack the robustness for defense applications. This trend suggests a blurring line between enterprise customer service tools and military-grade logistics. Salesforce is aggressively carving out market share from established defense contractors.
Management and Leadership: Strategic Alignment
Salesforce leadership executed a precise pivot toward the public sector. Kendall Collins, CEO of Missionforce, effectively operationalized this strategy. This leadership success highlights an adaptive corporate culture capable of navigating complex federal procurement. Furthermore, alignment with Defense Secretary Pete Hegseth’s "AI-first" vision demonstrates high-level strategic synergy. Peter Lington, VP for the Department of War business, emphasizes data as a "strategic asset." This coherent messaging between corporate executives and Pentagon leadership instills market confidence.
Cyber Security and Data Sovereignty
Security remains the linchpin of this deal. The Army requires absolute trust in its data before unleashing autonomous agents. Salesforce’s "Computable Insights" subsidiary addresses these specific security mandates. The emphasis on a "Modular Open-Source Approach" (MOSA) reduces vendor lock-in risks. It also forces Salesforce to prove its cybersecurity resilience constantly. Any breach would jeopardize not just the contract, but the company's entire federal reputation. Therefore, cybersecurity excellence acts as the primary gatekeeper for realizing the contract’s full value.
Macroeconomics and Market Sentiment
Salesforce shares ticked up 0.6% to $229.40 following the news. This muted reaction reflects investor caution regarding the macroeconomic environment. High interest rates continue to pressure tech valuations. Traders currently weigh the "hype" of AI against tangible book orders. The upcoming February 25 earnings report becomes the critical litmus test. The market demands proof that federal wins effectively counter broader economic slowdowns. Until then, the stock likely remains range-bound, waiting for concrete revenue data.
Patent Analysis and Science
The underlying science of this deal rests on data unification and API orchestration. Salesforce must leverage its intellectual property to connect legacy military systems. This requires advanced patent-protected methods for data ingestion and normalization. The "Golden Record" concept, a single source of truth, relies on sophisticated algorithmic reconciliation. Future patent filings will likely focus on "Agentic" behaviors and secure government cloud architectures. This intellectual property moat protects Salesforce from competitors seeking to clone its government-specific solutions.

CRM - Minor Downtrend Line Broken!CRM - CURRENT PRICE : 260.57
CRM previously entered a downtrend following a double-top reversal , which pushed the stock into a prolonged bearish trend. However, current price action shows early signs of trend change as CRM successfully breaks above the minor downtrend line with strong momentum.
Momentum indicators are confirming the shift:
⚡RSI has turned bullish and moved decisively above 50
⚡MACD shows a bullish crossover with improving histogram
With improving trend structure and bullish indicators, CRM may continue its upward recovery. Price may extend toward 278.00 and 296.00 as long as it stays above 242.00 (near EMA 50).
ENTRY PRICE : 260.57
FIRST TARGET : 278.00
SECOND TARGET : 296.00
SUPPORT : 242.00

Salesforce (NYSE: $CRM) Stock: Record Q3 & Breakout SetupSalesforce (NYSE: NYSE:CRM ) delivered a standout fiscal Q3 2026, posting record results driven by explosive growth in Agentforce and Data 360, its fastest-scaling AI and data platforms. Revenue rose 9% year-over-year to $10.3 billion, with subscription and support revenue reaching $9.7 billion, up 10%. The company generated a strong $2.3 billion in operating cash flow, a 17% annual increase, while free cash flow surged 22% to $2.2 billion.
A major highlight was the accelerating expansion in performance obligations. Current RPO hit $29.4 billion, up 11% Y/Y, while total RPO climbed to $59.5 billion, signaling strong visibility into future revenue. Salesforce also raised full-year FY26 guidance to as high as $41.55 billion, supported by the newly completed Informatica acquisition, which enhances the company’s enterprise data capabilities across governance, integration, metadata, and MDM.
Agentforce and Data 360 were the clear growth engines. Combined ARR reached $1.4 billion, soaring 114% Y/Y. Agentforce ARR alone surpassed half a billion, up 330% Y/Y, with over 9,500 paid deals and more than 3.2 trillion tokens processed through its LLM gateway. Data 360 saw massive record ingestion growth, including a 341% spike via Zero Copy. This adoption momentum strengthens Salesforce’s long-term target of $60B+ organic revenue and its FY30 Profitable Growth Framework.
TECHNICALS
The chart shows NYSE:CRM reclaiming demand after months of compression inside a descending trendline. Price recently bounced sharply from the $225–$235 support zone, where accumulation has been active for nearly two years. The breakout attempt above the long-term trendline is now in focus.
If price secures a clean close above $255–$260, upside targets open toward $290, and ultimately the $369 all-time-high zone. RSI sits mid-range, signaling room for expansion, while MACD hovers near a bullish cross. Failure to hold above $255 could re-expose the $225 demand region.

Salesforce’s AI Pivot: The Rise of the Agentic EnterpriseSalesforce (CRM) stands at a pivotal intersection of software legacy and artificial intelligence innovation. Despite a year-to-date stock correction of 32%, the company’s fundamentals tell a story of aggressive evolution. The cloud pioneer is systematically re-engineering its DNA to dominate the "Agentic Era." Investors focusing solely on the current share price of $227 may miss the underlying structural shift. With Q3 earnings approaching, we analyze the multi-domain drivers fueling Salesforce’s fundamental ascent.
Financial Resilience: Economics & Business Models
The subscription economy remains Salesforce's financial fortress.
In Q2 Fiscal 2026, the company generated $10.2 billion in revenue, a 10% annual increase. Crucially, $9.7 billion of this flowed from stable subscriptions and support. This recurring revenue model insulates the company against macroeconomic volatility. Furthermore, management’s focus on operational efficiency drove adjusted earnings per share (EPS) to $2.91, beating prior periods. This discipline balances aggressive R&D spending with shareholder returns, a vital equilibrium in high-interest rate environments.
High-Tech & Science: The "Agentic" Shift
Salesforce is redefining the science of work. CEO Marc Benioff envisions an "Agentic Enterprise" where human workers and AI agents collaborate seamlessly. This is not theoretical; the Data & AI division’s revenue more than doubled to $1.2 billion last quarter. The company’s proprietary platform, Agentforce, utilizes advanced Large Language Models (LLMs) to automate complex workflows. This moves beyond simple chatbots to autonomous agents capable of executing multi-step tasks in sales and service.
Patent Analysis: We anticipate a surge in IP filings regarding "autonomous agent orchestration" as Salesforce builds a legal moat around this technology.
Strategic M&A: Technology & Cyber
Data is the fuel for AI, and Salesforce just bought a bigger pipeline. The recent acquisition of Informatica secures critical cloud data management infrastructure. This strategic move allows Salesforce to ingest, clean, and secure vast datasets from disparate sources.
Cybersecurity Implication: By controlling the data layer, Salesforce offers a "walled garden" for enterprise clients. This reduces cyber risk and ensures data governance, a primary concern for Fortune 500 CIOs adopting AI.
Geopolitics & Geostrategy: Middle East Expansion
Salesforce is aggressively diversifying its geographic footprint. The recent launch of an Arabic version of Agentforce signals a strategic pivot toward the Middle East. This region is currently investing heavily in digital transformation to diversify away from oil dependence. By providing localized, AI-driven automation, Salesforce embeds itself into the infrastructure of emerging economic powers. This reduces reliance on Western markets and taps into sovereign wealth capital flowing into technology.
Management & Leadership: Culture of Innovation
Leadership is driving a forced evolution. Benioff is pivoting the company culture from "Cloud First" to "Agent First." This cultural shift is difficult but necessary to avoid obsolescence. The integration of Informatica and the push for $60 billion in revenue by 2030 demonstrate a long-term commitment to growth. Management is willing to sacrifice short-term margins for long-term dominance in the AI application layer.
Outlook: The December Catalyst
All eyes turn to Wednesday, December 3. Salesforce will release its Q3 2025 earnings after the bell. Analysts expect revenue of $10.27 billion and further EPS growth. The market will scrutinize the adoption rates of Agentforce and cloud subscription metrics. A positive report could validate the "Agentic" strategy and reverse the stock's recent bearish trend. For the strategic investor, Salesforce represents a disconnect between current sentiment and fundamental reality.
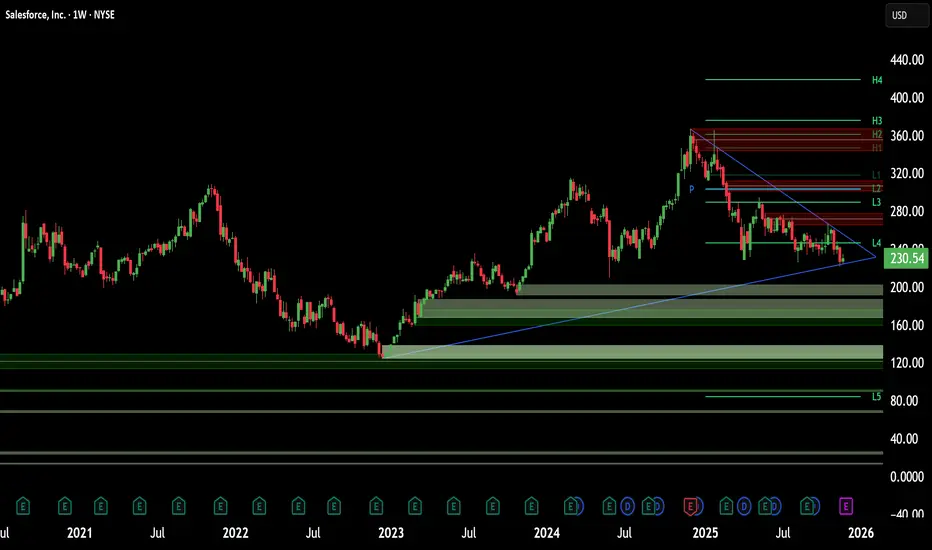
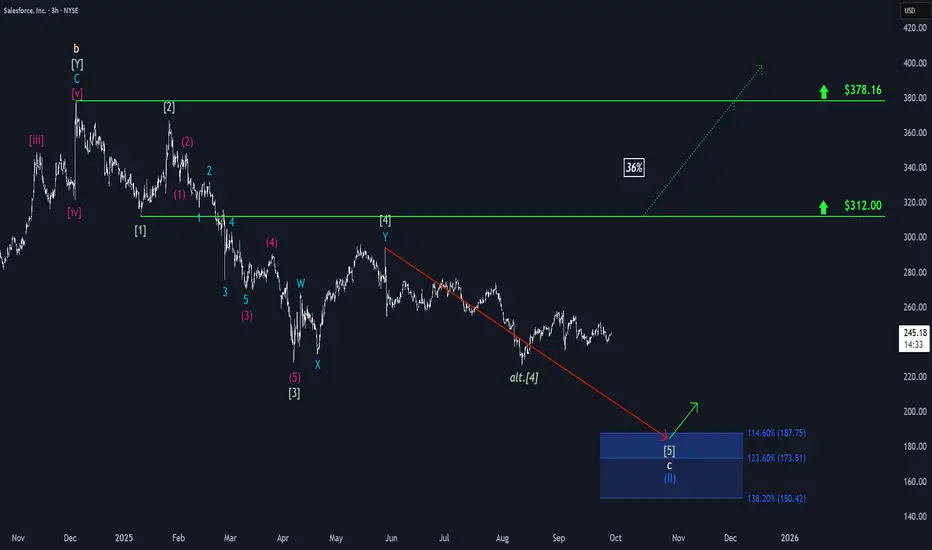
Salesforce: Trading SidewaysSalesforce has struggled to gain clear momentum in either direction over the past two weeks, which has resulted in mostly sideways trading. Looking ahead, we continue to anticipate renewed downward pressure in the near term, which could push the stock into our blue Target Zone between $187.75 and $150.42, thereby completing the broader correction of blue wave (II). After this move, we expect a new upward trend to emerge, which makes the blue zone an attractive entry point for long positions. For risk management, a stop can be placed 1% below the lower boundary of the zone. However, there remains a 36% chance that CRM will not reach our Target Zone and instead will break out directly above resistance at $312, potentially surpassing the higher $378.16 level as well. In that scenario, we would place the stock in a broader (green) upward impulse.
CRM - Salesforce - Earnings Beat, Shares Down? $286 Retest?We're currently watching the last stages down into this Ascending Wedge as we approach a very key and important load-up zone at the $227s. Looking for consolidation, bounce out wedge back north to retest those $287s.
CRM reported an earnings beat, guidance lower for Q3 than Street expects, but ultimately has been beatened down by the Rise of AI and it's incrouchment on Software Business Models with the Likes of a Customizable CRM. Their challenge will be continuing to leverage their Einstein AI which has brought a revolutionary approach to the CRM space in itself.

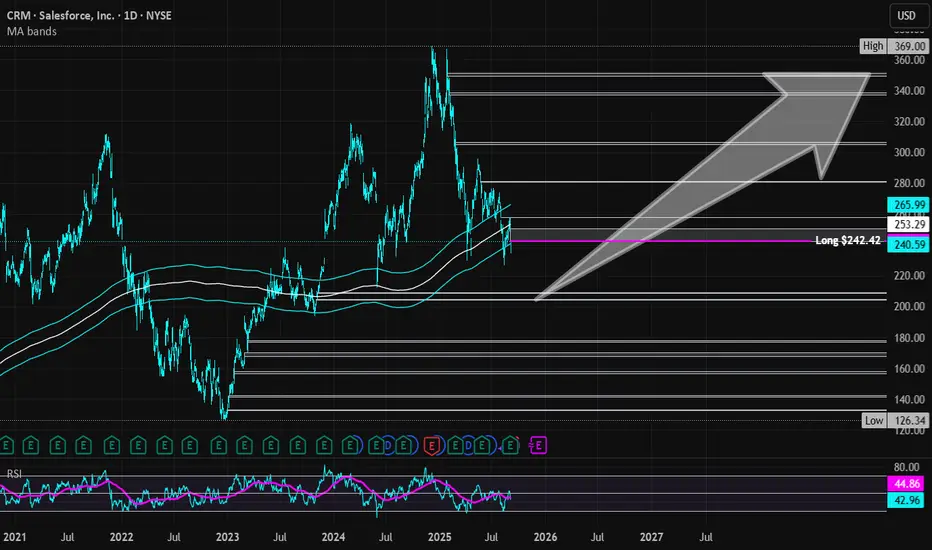
Salesforce | CRM | Long at $242.42Salesforce NYSE:CRM : firing their workforce... migrating toward an AI-driven Agentforce platform, instating a $20 billion increase to its share buyback program (now totaling $50 billion), and strong growth in regions like the UK, France, Canada, and Asia Pacific (particularly among small and medium businesses). The CEO recently declared significant productivity gains (e.g., 30% in engineering) through digital labor and expressed optimism about supporting U.S. government efficiency with Agentforce.
What's good for business isn't necessarily good for the common people. Welcome to AI, folks!
It looks like NYSE:CRM is moving toward a future of full AI. Even if revenue dips due to a slowing economy, I except earnings to soar higher and higher by dropping the humans from the payroll...
Thus, at $242.42, NYSE:CRM is in a personal buy zone as it bounces within my historical simple moving average band. Near-term, I think the price may dip into the low $200's if the US economy continues to show signs of weakening. But AI is only going to boost returns... fortunately for investors, but unfortunately for the workforce...
Targets into 2028:
$306.00 (+26.2%)
$350.00 (+44.3%)
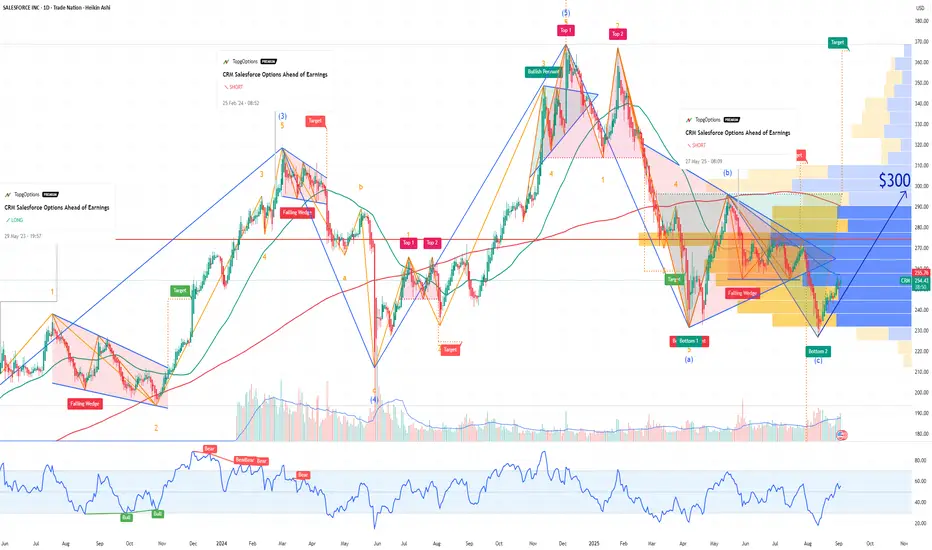
CRM Salesforce Options Ahead of EarningsIf you ahven`t bought CRM before the rally:
Now analyzing the options chain and the chart patterns of CRM Salesforce prior to the earnings report this week,
I would consider purchasing the 300usd strike price Calls with
an expiration date of 2025-12-19,
for a premium of approximately $7.52.
If these options prove to be profitable prior to the earnings release, I would sell at least half of them.
Disclosure: I am part of Trade Nation's Influencer program and receive a monthly fee for using their TradingView charts in my analysis.
Vibe coding a risk to Salesforce moatSalesforce (CRM) is facing structural disruption. Not cyclical. Structural. The threat isn’t from Microsoft or Oracle. It’s from culture. From code.
Vibe coding, fast, open-source, AI-native development, is gaining speed. It’s cheaper, faster and skips bloated architecture. It’s not about replacing CRM software. It’s about rethinking workflows.
Salesforce is vulnerable at the bottom. SMEs don’t want complex SaaS stacks. They want modular tools, cheap, fast, scalable. This is where vibe code thrives. No legacy clients. No enterprise red tape.
As SMEs shift, the threat creeps upstream. Large corporates follow. Once adoption takes hold, momentum builds.
This is the Innovator's Dilemma. The incumbent is too invested to pivot. Too big to self-disrupt. So the change is ignored until it’s too late.
Yes, Salesforce has scale and capital. But it's built to sell software, not to be software. Culture eats strategy. Code eats incumbents.
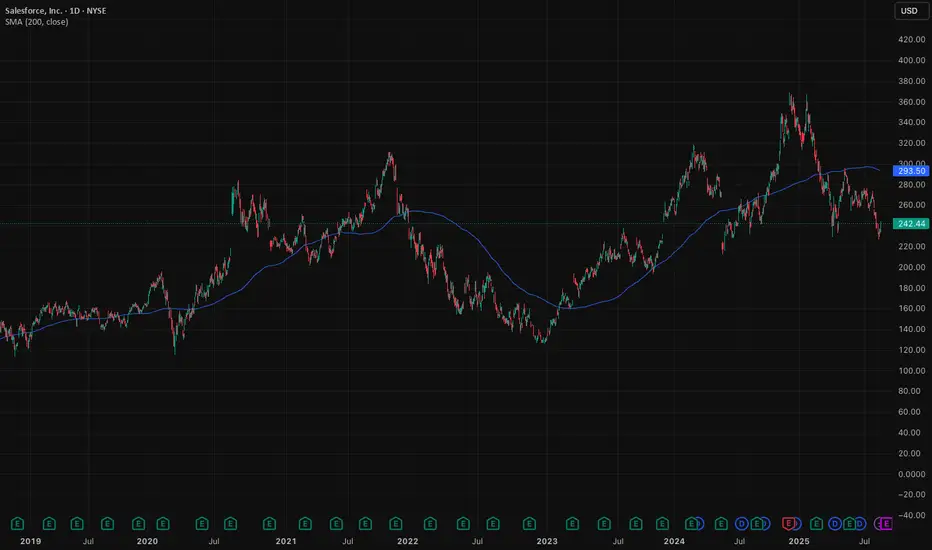
Technicals are cracking. CRM is trading below its 200-day moving average. RSI is drifting lower. No panic, just quiet decay. Valuation isn't reassuring either, CRM trades at roughly 23–26× forward earnings, a discount to its historical average. That signals caution, not comfort.
Disrupt or be disrupted.
The risk isn’t earnings. It’s irrelevance.
The forecasts provided herein are intended for informational purposes only and should not be construed as guarantees of future performance. This is an example only to enhance a consumer's understanding of the strategy being described above and is not to be taken as Blueberry Markets providing personal advice.
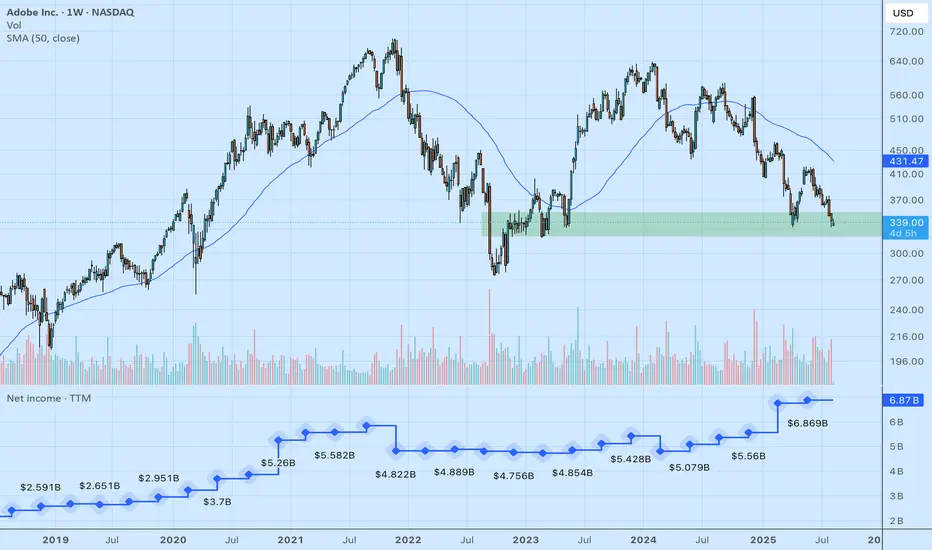
$ADBE is an IA sleeping giantHi there, I bring you Adobe today.
Between 2020 and 2024, Adobe delivered sustained growth, moving from $12.87 B in 2020 to $21.51 B in 2024, an impressive 67% cumulative increase. Operating income grew from $4.24 B to $6.74 B over the same period. Net income peaked at $5.26 B in 2020, dropped in 2021–2022, and recovered to $5.56 B in 2024 , with a 14.1% rebound in 2023 and a modest 2.4% gain in 2024, today sits at 6.87B.
Also shows great margins. NASDAQ:ADBE operates with industry-leading profitability. Gross margin in 2024 was 89% , reflecting low COGS for subscription-based products. Operating margin was 36% , down slightly from its 2021 peak due to higher R&D and sales investments. Net margin stood at 26% in 2024.
Return metrics are also strong. ROE exceeded 37% in 2024 (boosted by large buybacks reducing equity) and ROA was 17%. This is far ahead of peers like Salesforce (ROE 10%, ROA 6.4% ) and even in line with Microsoft numbers.
Adobe consistently generates robust FCF, moving from $6.88 B in 2021 to $7.87 B in 2024. The dip in 2023 (–6.1%) was due to higher tax payments, but 2024 saw a 13.4% rebound. FCF margins have hovered around 37–40%, providing ample capital for reinvestment and buybacks.
Long-term debt rose from ~$10.7 B in 2020 to $15.2 B in 2024 , while equity declined due to repurchases, pushing the debt-to-equity ratio from 0.84 in 2021 to 1.14 in late 2024. Leverage is still manageable given Adobe’s EBITDA and cash flows.
Adobe does not pay dividends, instead returning capital via buybacks. Over the last decade, it repurchased $39.7 B worth of stock, including $3.4 B in the most recent quarter. In March 2024, it authorized a new $25 B buyback program through 2028. (Bullish Bullish Bull)
Versus Salesforce, Adobe has smaller revenue but much higher margins and ROE. Microsoft surpasses Adobe in scale but not in gross margins (Adobe 89% vs Microsoft 70%). Adobe’s valuation (around 19x forward EPS ) is below its historical average, giving it a slight relative discount despite strong fundamentals.
Post Q2 2025, Adobe raised its FY guidance to 23.60 B revenue and $20.70 adjusted EPS , above prior consensus. Last quarter: $5.87 B revenue (+11% YoY) and $5.06 EPS (vs $4.97 expected) . Growth is expected to be driven by AI-powered Creative Cloud and Document Cloud, with analysts forecasting 10% annual revenue growth and sustained high margins.
Cheers!
Pablin
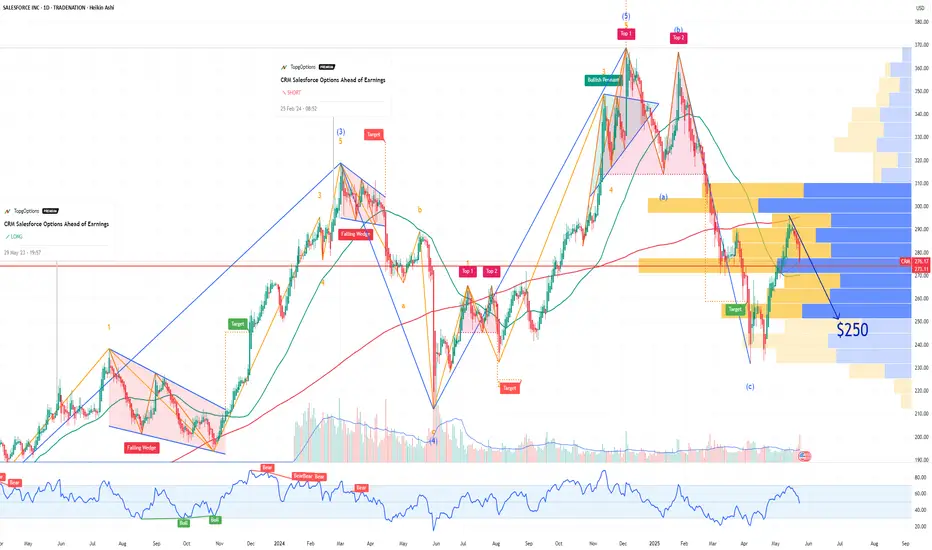
CRM Salesforce Options Ahead of EarningsIf you haven`t bought CRM before this rally:
nor sold this top:
Now analyzing the options chain and the chart patterns of CRM Salesforce prior to the earnings report this week,
I would consider purchasing the 250usd strike price Puts with
an expiration date of 2025-6-20,
for a premium of approximately $5.15.
If these options prove to be profitable prior to the earnings release, I would sell at least half of them.
Disclosure: I am part of Trade Nation's Influencer program and receive a monthly fee for using their TradingView charts in my analysis.
Salesforce: Further ProgressDue to continued downward pressure, Salesforce has made further progress in realizing our primary scenario. During the ongoing green wave , we still expect the stock to sell off below the support at $274. However, if the price imminently climbs above the resistance at $312, we will have to reconsider the structure of the ongoing decline and reckon with a magenta five-wave downward move. We currently assign this alternative scenario a 36% probability.
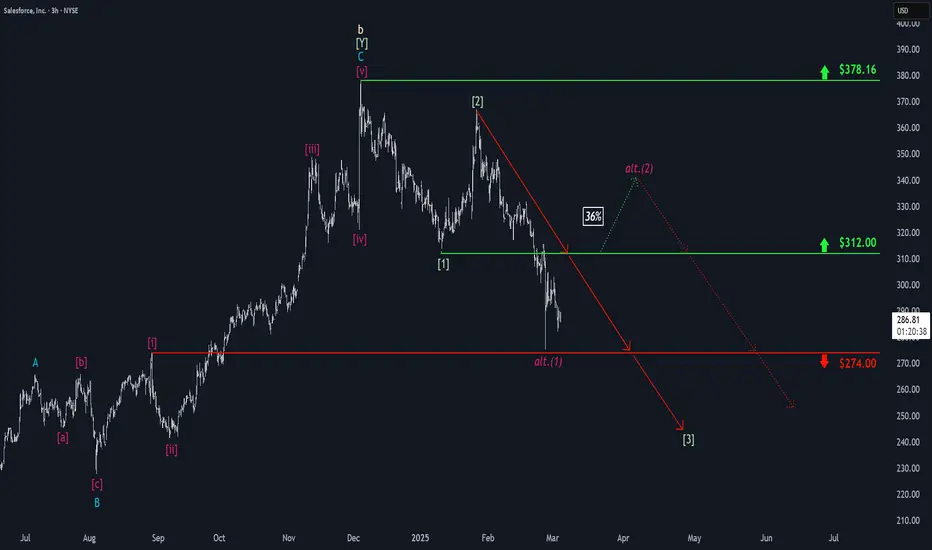
Salesforce: Wave b Top Established!On December 4, CRM peaked briefly, hitting a new record high at $378.16. Since then, the price has been unable to revisit this level, initiating a first downward impulse. Therefore, we now consider the prominent wave b top as established and are preparing for a significant sell-off, with extension targets below the $274 support. Thus, the still ongoing correction should continue.

COSTCO 850 AFTER EARNIGS ?? 5 STRONG REASONS WHY !!!
thanks to
WWW.CAFECITYSTUDIO.COM
NY RUNS GLOBAL INC .
Robust Financials:Costco has consistently demonstrated strong financial performance. Its revenue growth, profitability, and debt management are impressive.
The company’s ESG (Environmental, Social, and Governance) score for its industry is good, indicating responsible business practices .
Customer Loyalty and Resilience:Costco’s loyal customer base contributes to its stability. Even during economic downturns, consumers tend to remain loyal to the brand.
This loyalty makes Costco stock relatively recession-resistant, which is a valuable asset for long-term investors.
Analyst Sentiment:Over the past few months, analysts have revised their average price target for Costco upwards significantly. This suggests positive sentiment and confidence in the company’s future prospects.
There is high visibility into Costco’s activities for the coming years, supporting predictable sales.
Inflationary Pressures:The recent inflationary pressures have positively impacted Costco stock. As the Federal Reserve adjusts its monetary policy, companies like Costco may benefit from higher prices and increased consumer spending.
Valuation Considerations:While Costco’s fundamentals are strong, it’s essential to consider valuation. The company operates with relatively high earnings multiples.
Investors should weigh the potential upside against the current valuation when projecting the stock price.

10% December slide for Salesforce (CRM)
Despite raised guidance, we see a 10% correction ahead for Salesforce. This doesn't mean it won't experience a next leg up. Near-term short opportunity! Wave 5 ending and overbought. The stock's rapid ascent may have led to overvaluation, making it susceptible to a pullback as investors take profits.
We see a 10% reversal to the $320 price range this December.
Keep your charts clean and easy to understand.
Your strategy should look for easy-to-identify repeating patterns.
Be alert.
Trade green.

Salesforce - $CRM - Set to FLYSalesforce is primed for a major move higher, and here’s why:
1️⃣ H5 Indicator is GREEN
2️⃣ Hasn't reach bull flag measured move yet
3️⃣ Massive 3-Year Cup-and-Handle Pattern Breakout with a retest. Now NYSE:CRM will move higher!
4️⃣ Wr% consolidation box is thriving
5⃣ All Time High Free Range 🐔
6⃣ Impressive FCF Growth: Driving higher margins and profitability. Intrinsic Value (Fair Value): $419 - 21% higher
🎯 $383 (Aug 2025)
📏 $502 (Before 2028)
Are you sold on this H5 Setup?
NFA

Salesforce (CRM): Decision Point ApproachingNYSE:CRM has risen higher than anticipated, but we are still holding on to our bearish scenario. Initially, we expected another leg down following the wick that we identified as wave ((a)), but the stock surprised us by pushing to a higher high, surpassing the levels of wave 1 and wave B at $348.86.
This move invalidated our first bearish scenario, activating our secondary outlook of a flat correction where wave ((b)) exceeds wave 1, which aligns with the current structure.
From here, our outlook is straightforward: if our bearish scenario holds, NYSE:CRM should drop below the wave ((a)) level, which is yet to be determined. However, if the stock rises above $360 and sustains trading at that level, the bearish outlook will be invalidated, requiring a complete re-charting of $CRM.
A decision point is approaching, and we will monitor the stock closely for further developments.

SALESFORCE $CRM | STRONG TREND UP TO EARNINGS Dec. 3rd, 2024SALESFORCE NYSE:CRM | STRONG TREND UP TO EARNINGS Dec. 3rd, 2024
BUY/LONG ZONE (GREEN): $338.75 - $400.00
DO NOT TRADE/DNT ZONE (WHITE): $331.00 - $338.75
SELL/SHORT ZONE (RED): $250.00 - $250.00
Weekly: Bullish
Daily: Bullish
4H: Bullish
1H: Bearish
NYSE:CRM releases earnings today, Tuesday Dec 3rd, after market close. Price ranges up to previous earnings on Aug 28th. This range finally breaks out and creates a bullish trend that has held strong leading up to today's earnings. High timeframes show bullish trend (my trend determining indicator), along with current chart trend bands (my channel/bands directional bands). ATM Straddles suggest the expected move to be around 7.25%, or $24.00 in either direction. This is on pace with it's average and historical earnings moves (previous 8 - 12 quarters).
My estimated moves:
Downside: ~$300
Upside: ~$360
(30-45 DTE)
This is what I would personally look at before entering trades, everything is subject to change on a daily basis and as I analyze different timeframes and ideas.
ENTERTAINMENT PURPOSES ONLY, NOT FINANCIAL ADVICE!
trendanalysis, trendtrading, priceaction, priceactiontrading, technicalindicators, supportandresistance, rangebreakout, rangebreakdown, rangetrading, chartpatterntrading, chartpatterns, crm, NYSE:CRM , salesforce, salesforce earnings, earningsplay, salesforcetrend, salesforcetrade, crmtrend, crm earnings, crmtrade, crmstrongbullishtrend, salesforcestrongbullishtrend, options, optionstrading, atmoptions, atmstraddles, atmstrangles, willcrmbeatexpectedmove, expectedearningsmoves,

Docusign - An Opportunity for New Entrants▫️Docusign - NASDAQ:DOCU - for new entrants
▫️ Bottom to bottom cycles are 26 - 31 weeks
▫️ I am hoping for a pull back into that window between 26 - 31 weeks to add an allocation.
▫️ This would coincide with the 50 weekly moving average and some good historic price support.
▫️ A bid at the range $70 - $76 would be ideal but as low as $66 would be better.
▫️ The DSS Bressert also seems to indicate a pull back us due.
Company has a nice balance sheet and high deferred revenue, meaning purchasers have paid up front for future services demonstrating they have faith in the company and what it provides. Docusign is integrated with some of the largest companies in the tech industry and likely to grow with these companies. The company piggy backs off all the growth in these firms and has had delayed price action relative to the tech greats it is aligned with.
Sorry for these rougher charts but better to get them out than not at all.
One to watch

SALESFORCE $CRM - 5/17 - THE STOCK GAUNTLET CONTINUES! ⚔️🛡️ THE STOCK GAUNTLET CONTINUES! ⚔️🛡️
STOCK/ TRADE SETUP UPDATE: 5/17
5⃣ NYSE:CRM - SALESFORCE
Video Analysis:
Show some love by: ❤️
LIKING l FOLLOWING l SHARING
Hit the🔔as well to be notified when each video drops
NFA #tradingstrategy #HIGHFIVESETUP
NYSE:CRM

Salesforce Set to Soar: Here’s Why!NYSE:CRM
Salesforce Set to Soar: Here’s Why!
Salesforce is primed for a major move higher, and here’s why:
1️⃣ #HIGHFIVESETUP: Our proven trading strategy signals bullish trends.
2️⃣ Bull Flag Breakout: Already breaking out, heading toward the next key point.
3️⃣ Massive 3-Year Cup-and-Handle Pattern: NYSE:CRM is on the verge of a significant breakout.
4️⃣ Impressive FCF Growth: Driving higher margins and profitability.
🎯 Price Targets:
First Price Target: $383 (Aug 2025)
Second Price Target: $500 (2028)
What do you think of this trade setup? Are you adding it to your watchlist?
NFA
#trading #QQQ #SPY
