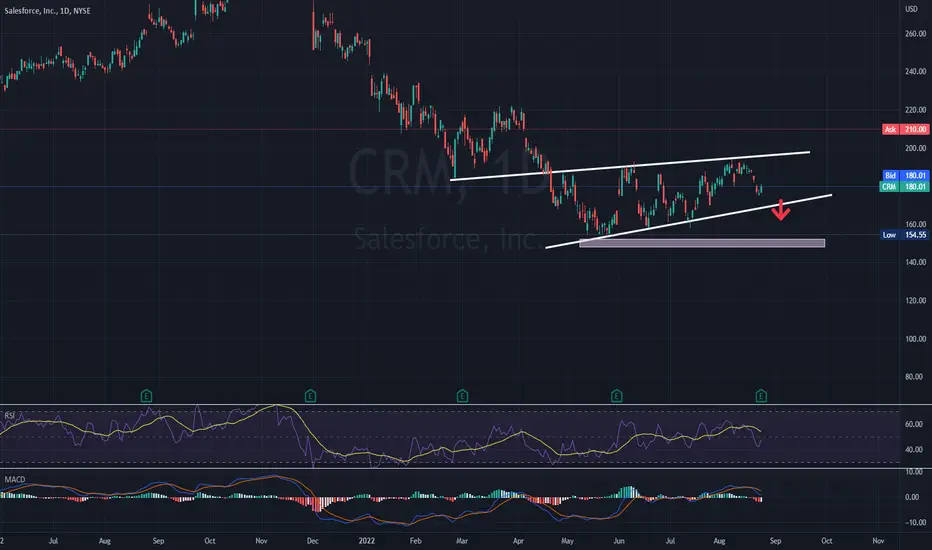
Salesfoce was meant to rebound even before Elliot took a stake1. Salesforce is set to soar after Elliot Management took a stake.
2. Even before that, the stock was already forming a falling wedge pattern on the daily chart.
3. Salesforce RSI was also forming a bullish divergence pattern.
Salesforce

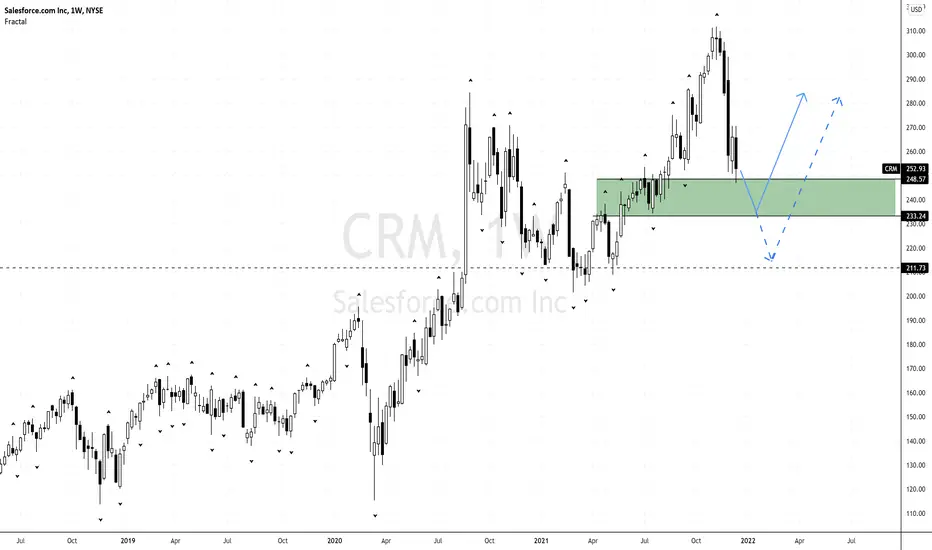
CRM Salesforce - Weekly Chart ConcernHello friends, today you can review the technical analysis idea on a 1W linear scale chart for Salesforce, Inc (CRM).
The CRM price chart is self-explanatory. I posted about this stock in December 2021 and since that point, the price is down about 54%. It's not out of the water just yet as price has a possibility to head lower. There is a strong trend line where price may bounce from with historical support but that would mean price needs to come down another 29%. There is also a weekly Death Cross (50D and 200D SMA cross) that occurred recently, which may cause price to head lower. I have also included the Volume and RSI in this chart.
If you enjoy my ideas, feel free to like it and drop in a comment. I love reading your comments below.
Disclosure: This is just my opinion and not any type of financial advice. I enjoy charting and discussing technical analysis . Don't trade based on my advice. Do your own research! #millionaireeconomics

CRM Salesforce.com: Bigger Drop ComingHello friends, today I am completing a technical analysis on the 1M linear scale chart for Salesforce.com ( CRM ), traded on the NYSE.
#CryptoPickk notes the following:
1) Salesforce.com price has been falling month over month, down about 20% from it's all time high price.
2) The price has been supported by a multi-year arc line (in red color). In the past year, the price was supported by a rising trendline (in yellow color), however it broke that support and has potential to fall further.
3) Historically the price has had very large swings as shown in the chart.
4) Based on a Fibonacci Retracement, the price has the potential to touch the 0.236 level around $160-$165, which is also where the price can touch the multi-year arc line. This would be about a 48% drop from the all time high price.
5) There is also a multi-year Bearish Divergence which formed that is also a major reason why a further price drop may be coming. You can see the price has formed HIGH HIGH and RSI and Stoch RSI has formed LOWER HIGH.
6) Keep an eye on the RSI (relative strength index) as it has touched the 49-50 level historically before seeing a bounce. This may be a place to potentially start dollar cost averaging in.
7) This isn't the first time the price has potential to see a sizable drop as it has shown historically that it drops and then recovers.
What are your opinions on this?
If you enjoy my ideas, feel free to like it and drop in a comment. I love reading your comments below.
Disclosure: This is just my opinion and not any type of financial advice. I enjoy charting and discussing technical analysis. Don't trade based on my advice. Do your own research! #cryptopickk

CRM UPDATE CRM is complete a big contracting reverse triangle , wave C is a zigzag , and wave c of this zigzag is a terminal
at this levels i prefer to be a buyer for long time

Selling CRM at swing highs.Salesforce - 30d expiry - We look to Sell at 164.77 (stop at 172.51)
Intraday rallies continue to attract sellers and there is no clear indication that this sequence for trading is coming to an end.
166.59 has been pivotal.
166 continues to hold back the bulls.
Preferred trade is to sell into rallies.
The primary trend remains bearish.
Our profit targets will be 145.55 and 140.55
Resistance: 153.40 / 158.00 / 165.00
Support: 148.35 / 145.00 / 137.00
Disclaimer – Saxo Bank Group.
Please be reminded – you alone are responsible for your trading – both gains and losses. There is a very high degree of risk involved in trading. The technical analysis , like any and all indicators, strategies, columns, articles and other features accessible on/though this site (including those from Signal Centre) are for informational purposes only and should not be construed as investment advice by you. Such technical analysis are believed to be obtained from sources believed to be reliable, but not warrant their respective completeness or accuracy, or warrant any results from the use of the information. Your use of the technical analysis , as would also your use of any and all mentioned indicators, strategies, columns, articles and all other features, is entirely at your own risk and it is your sole responsibility to evaluate the accuracy, completeness and usefulness (including suitability) of the information. You should assess the risk of any trade with your financial adviser and make your own independent decision(s) regarding any tradable products which may be the subject matter of the technical analysis or any of the said indicators, strategies, columns, articles and all other features.
Please also be reminded that if despite the above, any of the said technical analysis (or any of the said indicators, strategies, columns, articles and other features accessible on/through this site) is found to be advisory or a recommendation; and not merely informational in nature, the same is in any event provided with the intention of being for general circulation and availability only. As such it is not intended to and does not form part of any offer or recommendation directed at you specifically, or have any regard to the investment objectives, financial situation or needs of yourself or any other specific person. Before committing to a trade or investment therefore, please seek advice from a financial or other professional adviser regarding the suitability of the product for you and (where available) read the relevant product offer/description documents, including the risk disclosures. If you do not wish to seek such financial advice, please still exercise your mind and consider carefully whether the product is suitable for you because you alone remain responsible for your trading – both gains and losses.


CRM - BEARISH SCENARIOSalesforce, Inc. is a San Francisco, California-based software company with a $150.2 billion market capitalization. The company delivered a -40.86% return since the beginning of the year, while its 12-month returns are down by -44.84%.
Despite the announcement that the company will execute its first-ever share buyback program and the plans to lift the prices that it charges for the Slack team communications app that it acquired last year the stock remain under pressure.
The next stop is located at the $ 110 support level
Risk Disclosure: Trading Foreign Exchange (Forex) and Contracts of Difference (CFD's) carries a high level of risk. By registering and signing up, any client affirms their understanding of their own personal accountability for all transactions performed within their account and recognizes the risks associated with trading on such markets and on such sites. Furthermore, one understands that the company carries zero influence over transactions, markets, and trading signals, therefore, cannot be held liable nor guarantee any profits or losses.

Up and up with Salesforce.End of flat, Exit C pre confirmed. Ready to bet on a rise.
We are not in the business of getting every prediction right, no one ever does and that is not the aim of the game. The Fibonacci targets are highlighted in purple with invalidation in red. Confirmation level, where relevant, is a pink dotted, finite line. Fibonacci goals, it is prudent to suggest, are nothing more than mere fractally evident and therefore statistically likely levels that the market will go to. Having said that, the market will always do what it wants and always has a mind of its own. Therefore, none of this is financial advice, so do your own research and rely only on your own analysis. Trading is a true one man sport. Good luck out there and stay safe.

SALESFORCE - BEARISHS CENARIOSalesforce's second-quarter results topped Wall Street expectations, but the downtrend is more likely to continue due to the worsening of the business outlook.
inflation and slowing U.S. growth are some of the main reasons for the company cut its revenue forecast
The next price target is located at the $ 150 support level.
Risk Disclosure: Trading Foreign Exchange (Forex) and Contracts of Difference (CFD's) carries a high level of risk. By registering and signing up, any client affirms their understanding of their own personal accountability for all transactions performed within their account and recognizes the risks associated with trading on such markets and on such sites. Furthermore, one understands that the company carries zero influence over transactions, markets, and trading signals, therefore, cannot be held liable nor guarantee any profits or losses.
CRM Salesforce Options Ahead Of EarningsLooking at the CRM Salesforce options chain, i would buy the $175 strike price Puts with
2022-8-26 expiration date for about
$5.25 premium.
Looking forward to read your opinion about it.

Salesforce – Is it to Fall Even Further?Fundamental Indicators:
Sector – Technology
US Business Cycle Stage – late cycle, when this sector is not favourable
Revenue – consistent growth for the past 10 years, 26% annual growth 5-year average
Profits – significant drop from 2021
Net margin – quite low with 3.59% for tech company
P/E – extremely high at 188 compared to S&P500 with 21 and Technology sector 27
Liabilities - debt ratio is at 0.37 which is within normal limits, Net Debt/ EBITDA is negative – no problems with debt
Conclusion – great financial performance for the past 10 years but given the extremely high PE ratio and the current global economic situation it is grossly overpriced, so it is very likely to continue correcting
Technical Analysis (Elliott Waves):
Main scenario of this idea suggests that we are still observing development of the global growth cycle which is currently at the stage of completing the first leg of corrective wave 4 (see higher timeframe graph)
Since the correction of March 2020, the stock price considerably updated historic highs but slightly choppy with a challenging EW count, in this case an Ending Diagonal has been chosen as wave 5 (see guidelines for Ending Diagonals below)
From the high of October 2021 there has been a sharp fall in a clear impulsive move of wave A, followed by a sideway correction in wave B
The next move in wave C is expected to reach $115-$122 and this will finalise the first leg of the global corrective wave 4
This is a higher timeframe to reflect the full history of Salesforce and to provide full wave count:
This is the link to the guidelines for Ending Diagonals
What do you think about Salesforce and its short term prospects?
Also let me know if you would like to see other stocks, indices, Forex or Crypto analysed using Elliott Waves.
Thanks

Salesforce at resistance?Salesforce
Short Term
We look to Sell at 190.76 (stop at 198.93)
The medium term bias remains bearish. Bespoke resistance is located at 191.00. Trading within a Bearish Channel formation. We look for losses to be extended today.
Our profit targets will be 169.86 and 158.00
Resistance: 191.00 / 224.00 / 260.00
Support: 168.00 / 140.00 / 115.00
Disclaimer – Saxo Bank Group. Please be reminded – you alone are responsible for your trading – both gains and losses. There is a very high degree of risk involved in trading. The technical analysis, like any and all indicators, strategies, columns, articles and other features accessible on/though this site (including those from Signal Centre) are for informational purposes only and should not be construed as investment advice by you. Such technical analysis are believed to be obtained from sources believed to be reliable, but not warrant their respective completeness or accuracy, or warrant any results from the use of the information. Your use of the technical analysis, as would also your use of any and all mentioned indicators, strategies, columns, articles and all other features, is entirely at your own risk and it is your sole responsibility to evaluate the accuracy, completeness and usefulness (including suitability) of the information. You should assess the risk of any trade with your financial adviser and make your own independent decision(s) regarding any tradable products which may be the subject matter of the technical analysis or any of the said indicators, strategies, columns, articles and all other features.
Please also be reminded that if despite the above, any of the said technical analysis (or any of the said indicators, strategies, columns, articles and other features accessible on/through this site) is found to be advisory or a recommendation; and not merely informational in nature, the same is in any event provided with the intention of being for general circulation and availability only. As such it is not intended to and does not form part of any offer or recommendation directed at you specifically, or have any regard to the investment objectives, financial situation or needs of yourself or any other specific person. Before committing to a trade or investment therefore, please seek advice from a financial or other professional adviser regarding the suitability of the product for you and (where available) read the relevant product offer/description documents, including the risk disclosures. If you do not wish to seek such financial advice, please still exercise your mind and consider carefully whether the product is suitable for you because you alone remain responsible for your trading – both gains and losses.

May the force (sales) be with youSaleforce
Short Term - We look to Buy a break of 192.11 (stop at 179.00)
Although the bears are in control, the stalling negative momentum indicates a turnaround is possible. This stock has recently been in the news headlines. A bullish reverse Head and Shoulders is forming. A break of yesterdays high would confirm bullish momentum. We look for gains to be extended today.
Our profit targets will be 232.75 and 240.00
Resistance: 190 / 224.00 / 260.00
Support: 168.00 / 140.00 / 115.00
Disclaimer – Saxo Bank Group. Please be reminded – you alone are responsible for your trading – both gains and losses. There is a very high degree of risk involved in trading. The technical analysis, like any and all indicators, strategies, columns, articles and other features accessible on/though this site (including those from Signal Centre) are for informational purposes only and should not be construed as investment advice by you. Such technical analysis are believed to be obtained from sources believed to be reliable, but not warrant their respective completeness or accuracy, or warrant any results from the use of the information. Your use of the technical analysis, as would also your use of any and all mentioned indicators, strategies, columns, articles and all other features, is entirely at your own risk and it is your sole responsibility to evaluate the accuracy, completeness and usefulness (including suitability) of the information. You should assess the risk of any trade with your financial adviser and make your own independent decision(s) regarding any tradable products which may be the subject matter of the technical analysis or any of the said indicators, strategies, columns, articles and all other features.
Please also be reminded that if despite the above, any of the said technical analysis (or any of the said indicators, strategies, columns, articles and other features accessible on/through this site) is found to be advisory or a recommendation; and not merely informational in nature, the same is in any event provided with the intention of being for general circulation and availability only. As such it is not intended to and does not form part of any offer or recommendation directed at you specifically, or have any regard to the investment objectives, financial situation or needs of yourself or any other specific person. Before committing to a trade or investment therefore, please seek advice from a financial or other professional adviser regarding the suitability of the product for you and (where available) read the relevant product offer/description documents, including the risk disclosures. If you do not wish to seek such financial advice, please still exercise your mind and consider carefully whether the product is suitable for you because you alone remain responsible for your trading – both gains and losses.

CRM: Its not all doom and gloom!!Saleforce
Short Term - We look to Buy at 168.45 (stop at 151.44)
They reported earnings with forecasted earnings rising despite strong dollar headwinds. This led to a jump in premarket and could provide impetus for further rise up. There is scope for mild selling at the opening but loses should be limited. Our outlook is bullish. Dip buying offers good risk/reward.
Our profit targets will be 222.00 and 240.00
Resistance: 185.75 / 224.00 / 260.00
Support: 168.00 / 140.00 / 115.00
Please be advised that the information presented on TradingView is provided to Vantage (‘Vantage Global Limited’, ‘we’) by a third-party provider (‘Signal Centre’) . Please be reminded that you are solely responsible for the trading decisions on your account. There is a very high degree of risk involved in trading. Any information and/or content is intended entirely for research, educational and informational purposes only and does not constitute investment or consultation advice or investment strategy. The information is not tailored to the investment needs of any specific person and therefore does not involve a consideration of any of the investment objectives, financial situation or needs of any viewer that may receive it. Kindly also note that past performance is not a reliable indicator of future results. Actual results may differ materially from those anticipated in forward-looking or past performance statements. We assume no liability as to the accuracy or completeness of any of the information and/or content provided herein and the Company cannot be held responsible for any omission, mistake nor for any loss or damage including without limitation to any loss of profit which may arise from reliance on any information supplied by Signal Centre.

SalesForce (NYSE: $CRM) Wicks Under The 0.786 Fibs! 🕯️Salesforce, Inc. provides customer relationship management technology that brings companies and customers together worldwide. Its Customer 360 platform empowers its customers to work together to deliver connected experiences for their customers. The company's service offerings include Sales to store data, monitor leads and progress, forecast opportunities, gain insights through analytics and relationship intelligence, and deliver quotes, contracts, and invoices; and Service that enables companies to deliver trusted and highly personalized customer service and support at scale. Its service offerings also comprise flexible platform that enables companies of various sizes, locations, and industries to build business apps to bring them closer to their customers with drag-and-drop tools; online learning platform that allows anyone to learn in-demand Salesforce skills; and Slack, a system of engagement. In addition, the company's service offerings include Marketing offering that enables companies to plan, personalize, and optimize one-to-one customer marketing journeys; and Commerce offering, which empowers brands to unify the customer experience across mobile, web, social, and store commerce points. Further, its service offerings comprise Tableau, an end-to-end analytics solution serving various enterprise use cases; and MuleSoft, an integration offering that allows its customers to unlock data across their enterprise. The company provides its service offering for customers in financial services, healthcare and life sciences, manufacturing, and other industries. It also offers professional services; and in-person and online courses to certify its customers and partners on architecting, administering, deploying, and developing its service offerings. The company provides its services through direct sales; and consulting firms, systems integrators, and other partners. Salesforce, Inc. was incorporated in 1999 and is headquartered in San Francisco, California.

SALESFORCE - Monthly Demand ContactedNYSE:CRM
CRM has contacted Monthly Demand and is in line with the Monthly Demand that the S&P 500 has contacted.
There are several stocks that are currently aligned with the Monthly Demand of the S&P 500 ** See my profile for more stock scenarios**
CRM has the potential to rocket with institution demand coming into play. This trade has the potential to reach new highs in the long term.
As we reach PEAK FEAR in the markets, we are liking to have reached a bottom on the S&P 500

CRM at 200 WMA for the first time since pandemicCRM at 200 WMA for the first time since March 2020. With CRM due to report earnings next week, this zone may attract buying interest.

Buy Salesforce (CRM) at 190$-192$ to target 212$-215$Buy Salesforce at market (probably 190$-192$ range) than w8 some days to sell at 212$-215$

Nancy Pelosi bought calls for these companiesNancy Pelosi bought calls for these companies... what more do you need to know?

Expecting Salesforce Price Rejections Below $240Expecting to see price rejections around 234 level as sell off continues on Salesforce. With the daily rejection on last week trading day, this might be a reversal signal...
N.B
- Let emotions and sentiments work for you
-ALWAYS Use Proper Risk Management In Your Trades
CRM Ready to Crash?CRM looks to have lost its bullish momentum. My guess is that it'll consolidate near the $312 resistance before ultimately falling to AT LEAST $287. My bold prediction is that it'll fall to $267 by Dec 10 and use the top of the gap as a support for a bounce but...Only Time Will Tell

Let's all buy a metric shit ton of $CRM and get rich.This is a chart of $CRM. The bars pattern is of $FTNT. You can do this with $ADBE and a number of other tech stocks as well. You'll probably notice $ADBE is leading, I'm betting $CRM will follow. Both will catch up to $FTNT.
The structure is ready, we've been drawing this bull flag forever. We've lost all hope in stocks. Biden flushed everyone out that is scared of a little tax bump but only poors worry about taxes... they sold the bottom. It's time.

SalesForce CRM short 15min monitor 5minSalesForce CRM short 15min monitor 5min
1:98
Looks good trade.
Lets monitor.
Small lot size
Disclaimer: just an idea
