SAND/USDT - Descending Trendline: Breakout or Another Rejection?SAND/USDT on the Daily timeframe remains in a primary downtrend (macro downtrend) after failing to hold previous high levels. Price continues to trade below a well-defined descending trendline, confirmed by multiple rejections, indicating that selling pressure is still dominant.
However, over the past few weeks, price has shown demand reactions at lower levels, suggesting a potential consolidation phase or a technical relief bounce before the next directional move.
---
Pattern Explanation
Primary Pattern: Descending Trendline (Bearish Continuation Structure)
Price consistently forms lower highs and lower lows, confirming a healthy bearish structure.
Currently, price is approaching trendline resistance, a critical area that will determine whether:
A breakout and trend shift occurs, or
A strong rejection and bearish continuation takes place.
Additionally, a short-term base formation can be observed near the lows, which may trigger a technical bounce if resistance is successfully broken.
---
Key Levels
Resistance Zones:
0.139 – 0.147 → Minor resistance & trendline area
0.161 – 0.172 → Supply zone / prior breakdown level
0.210 → Major resistance & bearish structure invalidation
Support Zones:
0.130 – 0.125 → Current local support
0.113 – 0.105 → Strong demand zone / potential accumulation area
---
Bullish Scenario
The bullish scenario is only valid if:
Price breaks and closes above the descending trendline on the Daily timeframe
Additional confirmation comes from the formation of a higher high after the breakout
If a valid breakout occurs:
First target: 0.147 – 0.161
Next target: 0.172
Maximum upside target (bullish extension): 0.210
Such a move would indicate a medium-term trend reversal, not merely a temporary pullback.
---
Bearish Scenario
If price:
Fails to break above the trendline
Faces strong rejection around the 0.139 – 0.147 area
Then bearish continuation may follow:
Retest of 0.130
A breakdown could open the path toward 0.113 – 0.105
As long as price remains below the descending trendline and below 0.172, the overall bias stays bearish continuation.
---
Conclusion
SAND/USDT remains structurally bearish, but price is currently trading within a critical decision zone.
Traders are advised to:
Wait for confirmed breakout signals for bullish setups, or
Look for rejection at the trendline for bearish continuation opportunities.
Aggressive entries are not recommended without confirmation, as this area represents a battle zone between buyers and sellers.
#SAND #SANDUSDT #CryptoAnalysis #TechnicalAnalysis #Downtrend #TrendlineResistance #Altcoin #BearishMarket #CryptoTrading
SAND

SAND BuyLong Signal (4H)The market maker collected buy orders with a large bearish candle. This was a liquidity grab, as the origin of that bearish move was quickly mitigated.
After taking the low, price quickly reversed to the upside and formed a bullish CH.
We have two entry points and should enter the position using DCA.
There are two targets marked on the chart that we are waiting to be hit.
If you would like us to analyze a coin or altcoin for you, first like this post, then comment the name of your altcoin below.

#SAND/USDT PUMP COMING ON SAND! #SAND
The price is moving within a descending channel on the 1-hour frame, adhering well to it, and is heading for a strong breakout and retest.
We have a bearish trend on the RSI indicator that is about to be broken and retested, which supports the upward breakout.
There is a major support area in green at 0.1980, representing a strong support point.
We are heading for consolidation above the 100 moving average.
Entry price: 0.2080
First target: 0.2121
Second target: 0.2170
Third target: 0.2217
Don't forget a simple matter: capital management.
When you reach the first target, save some money and then change your stop-loss order to an entry order.
For inquiries, please leave a comment.
Thank you.

Bloktopia OutlookNobody is talking about #BLOK, so it's the best time to rise. It's like #SAND and #MANA when nobody knew them. 700X possible!

SAND is Ready for 130% + Up Move SAND is making a Triangle pattern at Support zone and It is Ready for Breakout from that pattern . and at the same time Altcoin Season Index is at 74 , when it is >75 it is sign of very bullish in altcoins and Breakouts will have very high potential to give a big move .
and at the same time Bitcoin dominance is decreasing and altcoins dominance is started increasing , so look on all the altcoins
and follow proper risk management , it has very good chances to move UP side but first we have to protect the down side , where risk management comes into game .
Follow for more Ideas and potential coins/ Stocks .

Sand Short to 0.23$Sand Short to 0.2308
Enter 0.345
SL 0.3609
TP 0.23
Sand will retest Symmetrical Triangle's top.
SL would have manually in case of wick above the top
Low leverage can enter now

SANDUSDT UPDATE#SAND
Update
SAND Technical Setup
Pattern: Falling Wedge Pattern
Current Price: $0.280
Target Price: $0.38
Target % Gain: 40.33%
Technical Analysis: SAND is trading inside a long-term falling wedge on the daily chart, showing signs of accumulation at the lower trendline. A recent bounce highlighted a 40% rally, and a breakout above resistance could unlock further upside potential.
Time Frame: 1D
Risk Management Tip: Always use proper risk management and set stop-loss near key support.

BIG PUMP COMING ON SAND!SAND is looking like a classic market cycle, ready for a strong recovery and bull run. I expect a significant pump on this coin soon. This is a prime opportunity to buy at these levels.
A huge vertical move is coming—mark my words.
As always, stay profitable.
Dalin Anderson

SAND Breakout Alert!🚨 SAND Breakout Alert! 🚨
SAND is currently testing the red resistance zone 🔴
If price breaks out, the first target will be the green line level 🎯
A confirmed breakout here would signal bullish continuation and could push price higher ✅

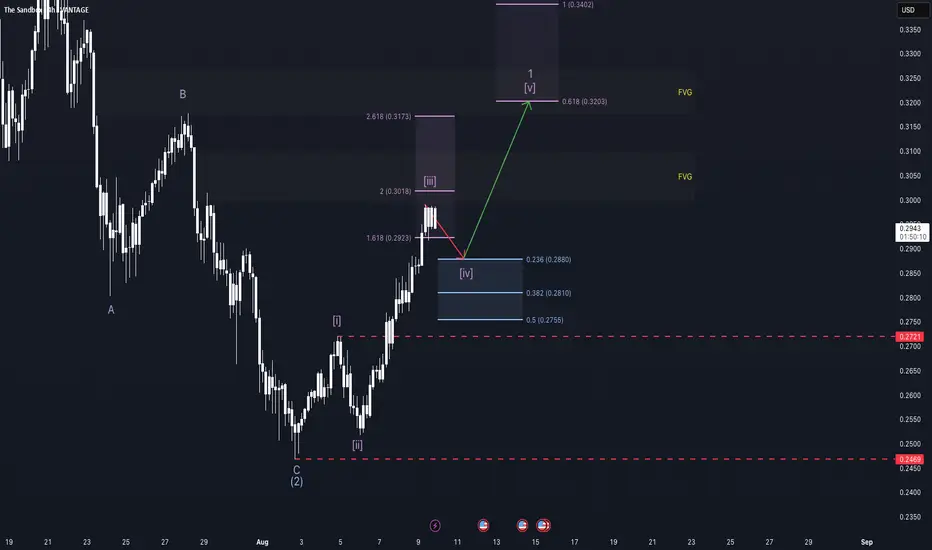
Undecided. - SAND/SAN weekly update August 9 - 15thThe Sandbox (SAND) is currently advancing within a strongly aligned Elliott Wave structure. At the Cycle degree, price is in Wave 3; at both the Primary and Intermediate degrees, it is also in Wave 3; and at the Minute degree, the market is completing a smaller Wave 3. From a Smart Money Concepts perspective, it would make sense for price to dip into the lower highlighted Fair Value Gap (FVG) before continuing higher, as this aligns with key Fibonacci retracement levels. Even a quick wick into this zone would be sufficient to rebalance price before continuation.
Following this potential retracement, the structure anticipates a short Wave 4 followed by Wave 5, which is projected to terminate in the upper FVG marked on the chart. This interpretation fits well with the overall bullish macro structure. However, if Wave 4 were to drop below the top of Wave 1, the current count would be invalidated. A move below the start of Wave 1 would raise the probability that the current advance is part of a more complex corrective structure rather than a sustained impulse.
From a derivatives perspective, funding rates remain positive while open interest is stagnating, indicating steady but not accelerating long participation. The liquidity heatmap shows significant liquidity resting below the Wave 2 low, which could act as a magnet for a short-term sweep before continuation.
On a broader level, this setup aligns with the macroeconomic backdrop. The CME FedWatch Tool currently shows a 88.9% probability of a Federal Reserve rate cut at the September FOMC meeting. Such expectations often lead to markets front-running the event, potentially fuelling impulsive Wave 3 rallies across the crypto sector. However, if bullish positioning becomes excessive, the risk of a “sell-the-news” reaction or a liquidation event increases — particularly in assets like SAND, which are already in extended third waves. Institutional positioning likely occurred earlier in the cycle, leaving retail traders to provide the momentum for the next legs up.
As long as key support levels hold and the lower FVG provides the anticipated reaction, SAND remains well-positioned for a continued advance toward the 0.320–0.340 range, with multiple wave degrees supporting the bullish case.
#SANDBOX #SAND #SANDUSD #SANDUSDT #Analysis #Eddy#SANDBOX #SAND #SANDUSD #SANDUSDT #Analysis #Eddy
A reversal structure has formed on the weekly and daily time frames, and the necessary confirmations have been given on the weekly time frame. Considering the structure formed on the above time frame, as well as the behavior of this currency in the past chart, it is expected that this currency will perform a good pump.
I have identified the important supply and demand zones of the higher timeframe for you.
This analysis is based on a combination of different styles, including the volume style with the ict style.
Based on your strategy and style, get the necessary confirmations for this analysis to enter the trade.
Don't forget about risk and capital management.
The responsibility for the transaction is yours and I have no responsibility for your failure to comply with your risk and capital management.
💬 Note: The red order block cannot stop the growth of the price of this currency and by 1.20 dollar this currency will be pumped more than 300%.
Be successful and profitable.

SAND/USDT Analysis – Major Accumulation or Imminent Breakdown?🔍 Overview:
SAND is currently trading at a crucial historical support zone, which has held firm multiple times since mid-2022. The chart shows a prolonged accumulation phase, offering significant potential for a major breakout or a decisive breakdown depending on market reaction.
---
🧠 Price Structure & Price Action:
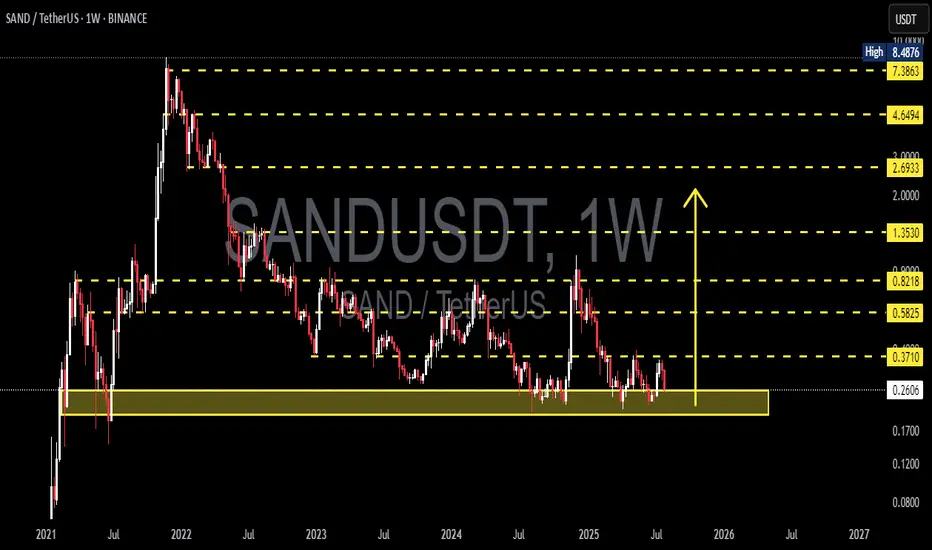
After reaching an all-time high at $8.4876 in late 2021, SAND has been in a long-term downtrend.
However, over the past year, it has formed a wide base around the $0.26–$0.37 range — a clear sign of potential accumulation.
Price is currently moving sideways in a compression structure, signaling the build-up of energy for the next explosive move.
---
🧱 Key Levels:
Level Function Status
$0.2613 Primary Historical Support Currently being tested
$0.3710 Local Resistance Needs to be reclaimed
$0.5825 Major Resistance Bullish confirmation level
$0.8218 Weekly S/R Flip Mid-range target
$1.3530 Psychological Resistance Potential medium-term target
$2.6933 / $4.6494 Expansion Phase Targets Long-term upside potential
$7.3863 Pre-ATH Resistance Late-cycle target
---
🟢 Bullish Scenario:
1. If price holds and bounces off the $0.26–$0.37 demand zone, a bullish reversal may unfold.
2. A weekly close above $0.3710 would be the first sign of strength.
3. Breaking $0.5825 with solid volume would confirm trend reversal and open the path toward $0.82 – $1.35.
📌 Additional Bullish Confirmation:
Bullish divergence on RSI (if present)
Increasing volume during upward moves
---
🔴 Bearish Scenario:
1. A clear breakdown below $0.2613 on the weekly timeframe would signal a loss of major support.
2. This opens downside risk toward:
$0.17
$0.12
Possibly even $0.08 if the market seeks a deeper revaluation.
3. Such a move would likely represent a full structure reset.
📌 Additional Bearish Confirmation:
Strong bearish candles with high volume
Weak or no bullish reaction within the demand zone
---
🔁 Formations in Play:
Accumulation Rectangle: A sideways range often found at market bottoms before new bull cycles.
Multi-year Base Formation: Can serve as a launchpad for major parabolic moves if resistance is broken.
---
📚 Conclusion:
SAND is at a make-or-break zone. The market is coiled like a spring — preparing either for a new bullish expansion or for further downside pain. Smart traders and investors will:
Wait for breakout confirmation
Or exit positions on breakdown signals
This is a golden zone for preparation, not reaction.
---
📌 Suggested Trading Plan:
✅ Bullish Bias: Scale in within support zone; tight stop below $0.26
❌ Bearish Bias: Short only after weekly close below $0.26
🧠 Neutral/Waiting: Let the market prove itself
#SANDUSDT #CryptoBreakout #AltcoinAnalysis #TechnicalAnalysis #MetaverseToken #SupportZone #BullishScenario #BearishOutlook #SmartMoneyAccumulation #CryptoTA #AccumulationPhase
SANDUSDT Breaks Major Downtrend – Golden Pocket Retest!
Technical Analysis:
SAND/USDT has successfully broken out of a descending trendline that had been capping the price since late 2024. The breakout occurred with increased volume, signaling strong buyer interest.
Following the breakout, price rallied and is now retesting a key support zone, which includes:
A demand zone (yellow box) between 0.2748 - 0.2885, aligning with the Fibonacci Golden Pocket (0.618 - 0.5)
A solid horizontal support around 0.2913
Fibonacci retracement levels are clearly defined:
0.3126
0.3467
0.4010
0.5417
Up to major resistance near 0.9384
---
Bullish Scenario 🟢:
If the price holds above the Golden Pocket zone and prints bullish confirmation (such as a bullish engulfing or hammer candlestick), then further upside potential is likely:
1. Initial targets: 0.3126 and 0.3467
2. Mid-range targets: 0.4010 and 0.5417
3. Long-term potential: 0.6981 and possibly the major resistance at 0.9384
Stronger confirmation would come from a daily candle closing above 0.3126.
---
Bearish Scenario 🔴:
If price breaks below the 0.2748 zone, it could indicate a failed breakout, potentially leading to:
1. Initial support: 0.2700
2. Deeper pullback zone: 0.2131 (previous low)
3. Potential fakeout of the trendline breakout
A daily close below 0.2748 would strongly validate the bearish setup.
---
Chart Pattern Overview:
Descending Triangle Breakout already confirmed
Price is now in the retest phase of the breakout
The Golden Pocket Fibonacci zone is the crucial point of trend continuation or reversal
---
Conclusion:
The breakout from the long-standing downtrend marks a strong shift in structure. However, a successful retest at the Golden Pocket will be key to confirming further bullish continuation. If buyers defend this zone, SAND is likely to print a higher low and resume its upward move.
#SANDUSDT #CryptoBreakout #AltcoinAnalysis #TechnicalAnalysis #FibonacciLevels #TrendlineBreakout #GoldenPocket #BullishSetup #BearishSetup

SAND – Rotation in PlaySAND is showing early signs of strength off the long-term demand zone near $0.23–0.24, where it's been accumulating for several months. Price just printed a strong weekly bounce, up +16%, reclaiming the bottom of the range.
This area has acted as a key base since mid-2023 — with each touch producing a notable reaction. Now trading at $0.286, SAND is attempting to rotate toward the top of the established range.
Key Levels
Support (Range Low): $0.23–0.24 (strong demand zone)
Resistance (Mid-Range): $0.43
Range High: $0.85
A clean flip of the mid-range ($0.43) could open the door to test $0.70+.
📌 Risk management: A break and weekly close below $0.23 invalidates this setup. As long as it holds, the upside potential is attractive from a risk/reward standpoint.
This is a classic accumulation > reclaim > expansion structure. Let the chart speak if the range holds, the rotation is in play.

SAND/USDT at Critical Support Zone – Rebound Potential?Detailed Technical Analysis:
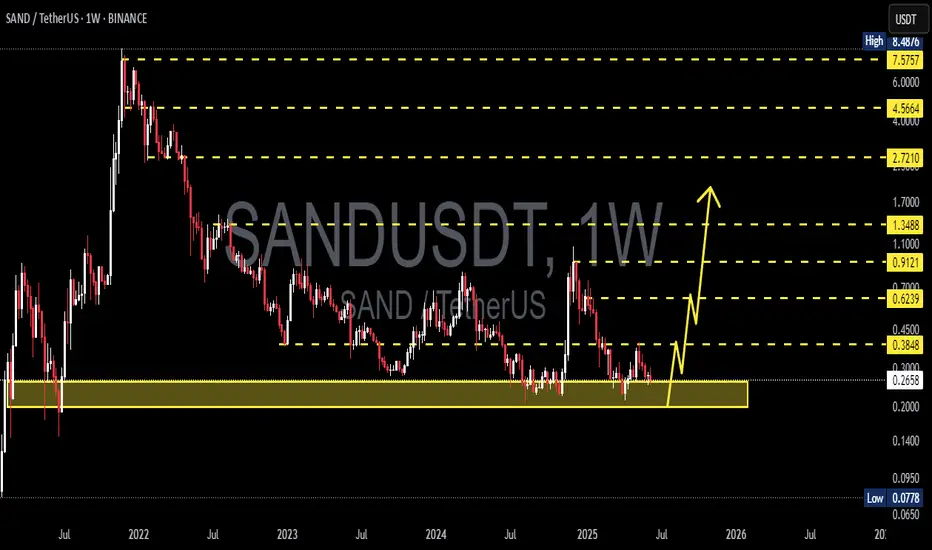
The SAND/USDT weekly chart shows the price currently hovering around a historically strong support zone between $0.20 – $0.25. This yellow-marked demand area has been tested multiple times since 2021 and has consistently prevented further downside, making it a crucial decision point for both bulls and bears.
🟢 Bullish Scenario:
If the price manages to hold this key support and prints bullish price action (e.g., a bullish engulfing or hammer candlestick), a reversal is likely. The projected upward path on the chart outlines the next key resistance levels:
1. $0.3710 – Initial resistance.
2. $0.4500 – First major breakout confirmation.
3. $0.5825 - $0.7000 – Mid-term resistance cluster.
4. $0.8218 - $1.3530 – Longer-term targets if bullish momentum sustains.
Bullish Confirmation:
Weekly candle close above $0.37
Breakout with strong volume beyond $0.45
🔴 Bearish Scenario:
If the price breaks below and closes under the $0.20 support zone, it would signal a bearish continuation, with possible downside targets at:
1. $0.14 – Minor historical support.
2. $0.09 - $0.075 – Extreme low support region and historical bottom.
Bearish Confirmation:
Weekly close below $0.20
Strong breakdown volume without immediate bullish rejection
📊 Chart Pattern Overview:
✅ Triple Bottom / Accumulation Zone:
The current support area resembles a potential triple bottom structure or long-term accumulation phase. If confirmed, this pattern could mark the beginning of a new bullish cycle.
🧠 Conclusion:
SAND is at a make-or-break level. As long as the price holds above the $0.20 - $0.25 support zone, bullish recovery remains a valid possibility. However, a breakdown below this level could trigger a significant bearish move.
#SANDUSDT #CryptoAnalysis #AltcoinSeason #TechnicalAnalysis #BullishScenario #BearishScenario #CryptoTrading #PriceAction #SupportResistance #TripleBottom

SANDUSDT 1W AnalysisSAND ~ 1W Analysis
#SAND Buy back gradually from here if you still have confidence in this coin with a short term target of at least 20%+ from this support.
sand buy spot "🌟 Welcome to Golden Candle! 🌟
We're a team of 📈 passionate traders 📉 who love sharing our 🔍 technical analysis insights 🔎 with the TradingView community. 🌎
Our goal is to provide 💡 valuable perspectives 💡 on market trends and patterns, but 🚫 please note that our analyses are not intended as buy or sell recommendations. 🚫
Instead, they reflect our own 💭 personal attitudes and thoughts. 💭
Follow along and 📚 learn 📚 from our analyses! 📊💡"

SANDUSD targeting the 1day MA200 at 0.42000Sandbox / SANDUSD has entered a Channel Up structure ever since it double bottomed on Support A and crossed above the Falling Resistance.
Now it's supported by the 1day MA50 and is aiming at a new Higher High on the 1day MA200.
Target 0.42000
Follow us, like the idea and leave a comment below!!

SANDUSDT 1D Analysis SAND ~ 1D Analysis
#SAND Buy gradually from here if you still have confidence in this coin with a short term target of at least 15%+ from here.

#SAND/USDT#SAND
The price is moving within a descending channel on the 1-hour frame and is expected to break and continue upward.
We have a trend to stabilize above the 100 moving average once again.
We have a downtrend on the RSI indicator that supports the upward move with a breakout.
We have a support area at the lower boundary of the channel at 0.2790, which acts as strong support from which the price can rebound.
Entry price: 0.2828
First target: 0.2890
Second target: 0.2971
Third target: 0.3048

SANDUSD: The recovery back to 1.07350 has started.Sandbox (SANDUSD) is marginally bearish on its 1D technical outlook (RSI = 43.227, MACD = -0.001, ADX = 35.488) as it dropped below its 1D MA50 again. However, the breakout over its 5 month LH trendline has already happened and calls for a long term recovery. As you can see the Fibonacci retracement levels form fairly symmetric Resistances with the previous LH levels, so we expect them one by one to get filled (final TP = 1.07350).
## If you like our free content follow our profile to get more daily ideas. ##
## Comments and likes are greatly appreciated. ##

TradeCityPro | SAND: Critical Support Test After Pullback👋 Welcome to TradeCity Pro!
In this analysis, I want to review the SAND coin for you. It’s one of the most popular Metaverse projects, widely recognized and among the top in its category.
✔️ This project’s coin currently holds a market cap of $693 million and ranks 91st on CoinMarketCap.
⏳ 4-Hour Timeframe
As you can see on the 4H chart, after a bullish leg that pushed the price up to 0.3140, a correction phase began. Following the break of 0.2903, the price has now corrected down to 0.2714.
🔍 If this 0.2714 level breaks, the price could continue down to the support at 0.2437 — so a break below 0.2714 would be a valid short entry.
👀 Personally, I prefer waiting for the price to first bounce off 0.2714, move upward, and print a lower high relative to 0.2903, then break 0.2714 on a second attempt. In that case, the short setup becomes much more reliable.
🔽 That said, even if the level breaks now without a bounce — since RSI is already near the oversold zone — I’ll still open a short. If RSI enters oversold, it could lead to a sharp drop.
⚡️ One negative factor for short positions is that volume has been decreasing since the price started correcting from 0.3140, which isn't a good signal for further downside — there’s a divergence between price and volume.
📈 However, that’s a positive signal for potential long positions. When volume drops during a correction in an uptrend, it shows buyers still have control. As long as this divergence persists, the uptrend is more likely to continue than to reverse.
📊 For long positions, if buying volume enters the market and the price holds above 0.2714, you can enter based on lower-timeframe structure breaks. The main long entry will be confirmed once the price breaks above the 0.3140 high.
📝 Final Thoughts
This analysis reflects our opinions and is not financial advice.
Share your thoughts in the comments, and don’t forget to share this analysis with your friends! ❤️

SANDUSDT 1D AnalysisSAND ~ 1D Analysis
#SAND Buy gradually after successfully penetrating this resistant line with a short -term target of at least 15%+.
