SAND/USDT - Descending Trendline: Breakout or Another Rejection?SAND/USDT on the Daily timeframe remains in a primary downtrend (macro downtrend) after failing to hold previous high levels. Price continues to trade below a well-defined descending trendline, confirmed by multiple rejections, indicating that selling pressure is still dominant.
However, over the past few weeks, price has shown demand reactions at lower levels, suggesting a potential consolidation phase or a technical relief bounce before the next directional move.
---
Pattern Explanation
Primary Pattern: Descending Trendline (Bearish Continuation Structure)
Price consistently forms lower highs and lower lows, confirming a healthy bearish structure.
Currently, price is approaching trendline resistance, a critical area that will determine whether:
A breakout and trend shift occurs, or
A strong rejection and bearish continuation takes place.
Additionally, a short-term base formation can be observed near the lows, which may trigger a technical bounce if resistance is successfully broken.
---
Key Levels
Resistance Zones:
0.139 – 0.147 → Minor resistance & trendline area
0.161 – 0.172 → Supply zone / prior breakdown level
0.210 → Major resistance & bearish structure invalidation
Support Zones:
0.130 – 0.125 → Current local support
0.113 – 0.105 → Strong demand zone / potential accumulation area
---
Bullish Scenario
The bullish scenario is only valid if:
Price breaks and closes above the descending trendline on the Daily timeframe
Additional confirmation comes from the formation of a higher high after the breakout
If a valid breakout occurs:
First target: 0.147 – 0.161
Next target: 0.172
Maximum upside target (bullish extension): 0.210
Such a move would indicate a medium-term trend reversal, not merely a temporary pullback.
---
Bearish Scenario
If price:
Fails to break above the trendline
Faces strong rejection around the 0.139 – 0.147 area
Then bearish continuation may follow:
Retest of 0.130
A breakdown could open the path toward 0.113 – 0.105
As long as price remains below the descending trendline and below 0.172, the overall bias stays bearish continuation.
---
Conclusion
SAND/USDT remains structurally bearish, but price is currently trading within a critical decision zone.
Traders are advised to:
Wait for confirmed breakout signals for bullish setups, or
Look for rejection at the trendline for bearish continuation opportunities.
Aggressive entries are not recommended without confirmation, as this area represents a battle zone between buyers and sellers.
#SAND #SANDUSDT #CryptoAnalysis #TechnicalAnalysis #Downtrend #TrendlineResistance #Altcoin #BearishMarket #CryptoTrading
Sandbox

#SAND/USDT PUMP COMING ON SAND! #SAND
The price is moving within a descending channel on the 1-hour frame, adhering well to it, and is heading for a strong breakout and retest.
We have a bearish trend on the RSI indicator that is about to be broken and retested, which supports the upward breakout.
There is a major support area in green at 0.1980, representing a strong support point.
We are heading for consolidation above the 100 moving average.
Entry price: 0.2080
First target: 0.2121
Second target: 0.2170
Third target: 0.2217
Don't forget a simple matter: capital management.
When you reach the first target, save some money and then change your stop-loss order to an entry order.
For inquiries, please leave a comment.
Thank you.

#SANDBOX #SAND #SANDUSD #SANDUSDT #Analysis #Eddy#SANDBOX #SAND #SANDUSD #SANDUSDT #Analysis #Eddy
A reversal structure has formed on the weekly and daily time frames, and the necessary confirmations have been given on the weekly time frame. Considering the structure formed on the above time frame, as well as the behavior of this currency in the past chart, it is expected that this currency will perform a good pump.
I have identified the important supply and demand zones of the higher timeframe for you.
This analysis is based on a combination of different styles, including the volume style with the ict style.
Based on your strategy and style, get the necessary confirmations for this analysis to enter the trade.
Don't forget about risk and capital management.
The responsibility for the transaction is yours and I have no responsibility for your failure to comply with your risk and capital management.
💬 Note: The red order block cannot stop the growth of the price of this currency and by 1.20 dollar this currency will be pumped more than 300%.
Be successful and profitable.

SAND/USDT Analysis – Major Accumulation or Imminent Breakdown?🔍 Overview:
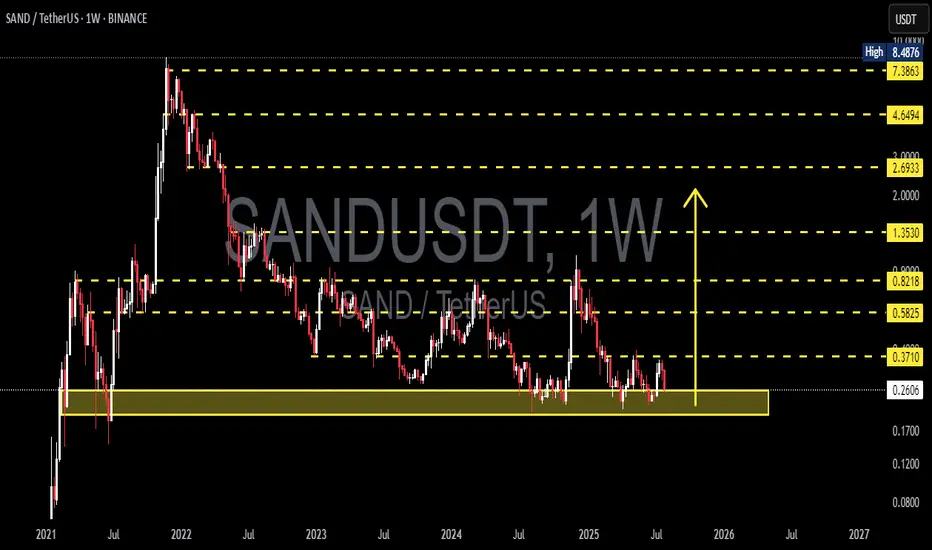
SAND is currently trading at a crucial historical support zone, which has held firm multiple times since mid-2022. The chart shows a prolonged accumulation phase, offering significant potential for a major breakout or a decisive breakdown depending on market reaction.
---
🧠 Price Structure & Price Action:
After reaching an all-time high at $8.4876 in late 2021, SAND has been in a long-term downtrend.
However, over the past year, it has formed a wide base around the $0.26–$0.37 range — a clear sign of potential accumulation.
Price is currently moving sideways in a compression structure, signaling the build-up of energy for the next explosive move.
---
🧱 Key Levels:
Level Function Status
$0.2613 Primary Historical Support Currently being tested
$0.3710 Local Resistance Needs to be reclaimed
$0.5825 Major Resistance Bullish confirmation level
$0.8218 Weekly S/R Flip Mid-range target
$1.3530 Psychological Resistance Potential medium-term target
$2.6933 / $4.6494 Expansion Phase Targets Long-term upside potential
$7.3863 Pre-ATH Resistance Late-cycle target
---
🟢 Bullish Scenario:
1. If price holds and bounces off the $0.26–$0.37 demand zone, a bullish reversal may unfold.
2. A weekly close above $0.3710 would be the first sign of strength.
3. Breaking $0.5825 with solid volume would confirm trend reversal and open the path toward $0.82 – $1.35.
📌 Additional Bullish Confirmation:
Bullish divergence on RSI (if present)
Increasing volume during upward moves
---
🔴 Bearish Scenario:
1. A clear breakdown below $0.2613 on the weekly timeframe would signal a loss of major support.
2. This opens downside risk toward:
$0.17
$0.12
Possibly even $0.08 if the market seeks a deeper revaluation.
3. Such a move would likely represent a full structure reset.
📌 Additional Bearish Confirmation:
Strong bearish candles with high volume
Weak or no bullish reaction within the demand zone
---
🔁 Formations in Play:
Accumulation Rectangle: A sideways range often found at market bottoms before new bull cycles.
Multi-year Base Formation: Can serve as a launchpad for major parabolic moves if resistance is broken.
---
📚 Conclusion:
SAND is at a make-or-break zone. The market is coiled like a spring — preparing either for a new bullish expansion or for further downside pain. Smart traders and investors will:
Wait for breakout confirmation
Or exit positions on breakdown signals
This is a golden zone for preparation, not reaction.
---
📌 Suggested Trading Plan:
✅ Bullish Bias: Scale in within support zone; tight stop below $0.26
❌ Bearish Bias: Short only after weekly close below $0.26
🧠 Neutral/Waiting: Let the market prove itself
#SANDUSDT #CryptoBreakout #AltcoinAnalysis #TechnicalAnalysis #MetaverseToken #SupportZone #BullishScenario #BearishOutlook #SmartMoneyAccumulation #CryptoTA #AccumulationPhase
THE SANDBOX mid - to long - termThis might seem obvious to some, but it’s worth emphasizing —
📌 When analyzing charts like this, switch to a Line Chart instead of Candlesticks.
Why?
It filters out market noise and shake-outs
You can clearly see how price respects key zones and levels
Candles often distort the picture with wicks — line charts show the real body movement
Bullish Setup:
Market has printed a clean W-bottom, confirming bullish intent.
We are currently retesting the neckline of the pattern — a common and healthy move before continuation.
A successful retest could lead to an impulsive move upward toward target zones.
🎯 Target Zones:
Green zone (top) — this is the maximum target in the current structure.
Anything above the red line already carries increased risk, and should be approached with caution.
Above green zone = extreme risk / high-probability rejection unless backed by strong fundamentals.

SANDBOX RALLY..Since 2021, SAND has been quiet but now holds strong support at $0.22. I believe a rally to $2.70 is likely in the coming months.
(ITS NOT A FINANCIAL ADVISE)

#SAND/USDT#SAND
The price is moving within a descending channel on the 1-hour frame and is expected to break and continue upward.
We have a trend to stabilize above the 100 moving average once again.
We have a downtrend on the RSI indicator that supports the upward move with a breakout.
We have a support area at the lower boundary of the channel at 0.2790, which acts as strong support from which the price can rebound.
Entry price: 0.2828
First target: 0.2890
Second target: 0.2971
Third target: 0.3048

SANDUSD: The recovery back to 1.07350 has started.Sandbox (SANDUSD) is marginally bearish on its 1D technical outlook (RSI = 43.227, MACD = -0.001, ADX = 35.488) as it dropped below its 1D MA50 again. However, the breakout over its 5 month LH trendline has already happened and calls for a long term recovery. As you can see the Fibonacci retracement levels form fairly symmetric Resistances with the previous LH levels, so we expect them one by one to get filled (final TP = 1.07350).
## If you like our free content follow our profile to get more daily ideas. ##
## Comments and likes are greatly appreciated. ##

TradeCityPro | SAND: Critical Support Test After Pullback👋 Welcome to TradeCity Pro!
In this analysis, I want to review the SAND coin for you. It’s one of the most popular Metaverse projects, widely recognized and among the top in its category.
✔️ This project’s coin currently holds a market cap of $693 million and ranks 91st on CoinMarketCap.
⏳ 4-Hour Timeframe
As you can see on the 4H chart, after a bullish leg that pushed the price up to 0.3140, a correction phase began. Following the break of 0.2903, the price has now corrected down to 0.2714.
🔍 If this 0.2714 level breaks, the price could continue down to the support at 0.2437 — so a break below 0.2714 would be a valid short entry.
👀 Personally, I prefer waiting for the price to first bounce off 0.2714, move upward, and print a lower high relative to 0.2903, then break 0.2714 on a second attempt. In that case, the short setup becomes much more reliable.
🔽 That said, even if the level breaks now without a bounce — since RSI is already near the oversold zone — I’ll still open a short. If RSI enters oversold, it could lead to a sharp drop.
⚡️ One negative factor for short positions is that volume has been decreasing since the price started correcting from 0.3140, which isn't a good signal for further downside — there’s a divergence between price and volume.
📈 However, that’s a positive signal for potential long positions. When volume drops during a correction in an uptrend, it shows buyers still have control. As long as this divergence persists, the uptrend is more likely to continue than to reverse.
📊 For long positions, if buying volume enters the market and the price holds above 0.2714, you can enter based on lower-timeframe structure breaks. The main long entry will be confirmed once the price breaks above the 0.3140 high.
📝 Final Thoughts
This analysis reflects our opinions and is not financial advice.
Share your thoughts in the comments, and don’t forget to share this analysis with your friends! ❤️

SANDBOX: $0.55 | Waiting for RESETthe metaverse ahead of its time
where market discounted the 10year reality in just 24 months after launching
very well regulated float gradually increasing
as the original investors finally unloads holdings
COST of OGs $0.003 to $0.005
Stabilization for buy back should be at $0.18 and all the way to $0.07
kinda like cardano or doge where at sub .10 cents DEALERS or BROKER custodians
began ACCUMULATING heavily for that next Bull RUN

SAND BOX bullishsand box on monthly and weekly TF looks really bullish to me, and im expecting a huge upside movement to about $3 for mid-term

#SAND #SANDUSDT #SANDBOX #LONG #SWING #AMD #Eddy#SAND #SANDUSDT #SANDBOX #LONG #SWING #AMD #Eddy
SANDUSDT.P SWING Long AMD Setup
Important areas of the upper time frame for scalping are identified and named.
This setup is based on a combination of different styles, including the volume style with the ict style. (( AMD SETUP ))
Based on your strategy and style, get the necessary confirmations for this Swing Setup to enter the trade.
Don't forget risk and capital management.
The entry point, take profit point, and stop loss point are indicated on the chart along with their amounts.
The responsibility for the transaction is yours and I have no responsibility for not observing your risk and capital management.
By scratching the price and time bar, you can see the big picture and targets.
Note: The price can go much higher than the second target, and there is a possibility of a 50%-100% pump on this currency. By observing risk and capital management, obtaining the necessary approvals, and saving profits in the targets, you can keep it for the pump.
Be successful and profitable.

$SAND Sandbox Over 70% Retracement... Ready for Higher?NYSE:SAND Sandbox has committed a over 70% retracement after superbuy signal from a height of approximately $1
Current Price: $0.36
Price action is forming a Falling Wedge and Bullish Divergences Spotted also
Expecting a retest of previous supports - now resistances at 0.41, 0.54, 0.7, 0.82, 0.96
#sand Invalidation is at under 0.3

Is There Hope for Sandbox ($SAND) or Is The Gameverse Dead?The Decline of NYSE:SAND : A Look at Its Current State
Once a shining star in the play-to-earn (P2E) gaming and NFT ecosystem, Sandbox ( NYSE:SAND ) has seen a staggering decline from its all-time high of $8.44 to a mere $0.34 at the time of writing. This sharp drop has left investors and gamers questioning the future of metaverse gaming and the sustainability of blockchain-based virtual worlds.
Despite recent hype around Web3 gaming and metaverse adoption, the broader NFT and P2E sectors have remained relatively muted, contributing to NYSE:SAND ’s price drop. However, does this spell the end for The Sandbox, or is a reversal on the horizon?
Technical Analysis
The Relative Strength Index (RSI) currently sits at 23, indicating that NYSE:SAND is in heavily oversold territory. Typically, an RSI below 30 suggests that an asset is due for a rebound, as selling pressure diminishes.
The daily chart is forming a rising wedge pattern, which is a traditionally bearish formation. If the pattern holds, further declines could be expected. However, the $0.39 pivot zone is a critical resistance level. Should NYSE:SAND manage to break above this level, it could spark a campaign towards the $1 mark, a move that would be monumental for the token.
Currently, NYSE:SAND is down 7.27% on the day, with a 14% decline over the last 24 hours. The lack of bullish momentum suggests that investors remain hesitant about a potential comeback. However, if volume spikes and momentum shifts, a short-term recovery could be on the table.
Market Data & Sentiment
- Current Price: $0.3487
- 24-Hour Trading Volume: $113.85 million
- Market Cap: $859.36 million
- Circulating Supply: 2.46 billion NYSE:SAND
Despite the downturn, The Sandbox maintains a top-100 ranking in the crypto market, proving that it still holds relevance. The challenge now is for the platform to reignite user interest and expand beyond its current stagnation.
The Road Ahead: Dead or Dormant?
While the NFT and metaverse hype has faded, it doesn’t necessarily mean the sector is dead. Innovation, adoption, and strategic partnerships could breathe life back into NYSE:SAND and other metaverse tokens.

SANDUSDT 1WSAND ~ 1W Analysis
#SAND Buy gradually from here if you still have a Conviction on this Coin with a minimum target of 20%+

TradeCityPro | SAND: Analyzing the Key Support & Resistances👋 Welcome to TradeCity Pro!
In this analysis, I will review the SAND coin. The Sandbox project is one of the largest metaverse projects in crypto, and during the previous bull run, it received significant attention from market participants. Recently, with Bitcoin’s latest upward move, SAND experienced a growth of nearly 300%.
📅 Daily Timeframe: Corrections and Key Supports
As mentioned, the daily timeframe shows a strong upward trend, which extended up to $0.9327. After reaching this level with significant volume, the price entered a corrective phase.
🔍 Currently, the price has corrected to the $0.5414 level, a critical support zone overlapping with the 0.5 Fibonacci level. This creates an important support range between the 0.5 and 0.618 Fibonacci levels. It appears the price is forming a base in this area to potentially regain bullish momentum and start the next leg upward. However, the possibility of a trend reversal and further decline also exists.
📊 In recent candles, buying volume in the market increased. However, with the release of yesterday’s news favoring the US dollar, nearly all assets, including US stocks and crypto, experienced declines. SAND also followed this trend with a red daily candle, engulfing the previous bullish candle.
🧩 It’s possible for the market to form a range box between $0.5414 and $0.6983, setting up a new bullish or bearish structure. Given SAND’s recent 300% growth, the likelihood of forming a bullish structure is higher. However, this is only a possibility, and we need to wait for the market to establish a new structure.
✨ The RSI oscillator is also within a box between 41.60 and 61.04. Breaking either of these levels could introduce momentum into the market. Overall, the current market volume still favors buyers.
📈 Long Positions:
The first trigger for a long position is $0.6983, which is considered a risky trigger. However, the rejection candle from yesterday adds importance to this level.
The main trigger is $0.93277, which is the major price ceiling. If this level is broken, the next resistance will be at $1.4155.
📉 Short Positions:
The first support zone is the range between 0.5 and 0.618 Fibonacci levels, as marked. If this zone breaks, the price could see the next corrective leg down to $0.4042.
If this level is broken, it would suggest the bullish trend has ended, with subsequent targets at $0.3068 and $0.2342.
📝 Final Thoughts
This analysis reflects our opinions and is not financial advice.
Share your thoughts in the comments, and don’t forget to share this analysis with your friends! ❤️


Sand 4h - Accumulation RangeREMEMBER that a lot of investors sell stocks or crypto for fiscal conditions in 2024 to close the year.
For that, we have low buy liquidity , and even with that pressure on the price , SAND is trying to remaning in the same range as 1 week ago, so a breakout can restart a new HH , so patience.
Im bullish on it if the 0,65usd resistance its broken and became a support.

SANDUSDT Trade LogSAND is showing strong potential for growth with recent market activity. This could be an excellent opportunity to buy and hold for the mid-to-long term. The metaverse and gaming narratives are gaining traction again, and SAND could be a key player.
Recommendation: Accumulate and hold. Watch for further confirmation of bullish momentum.

The Sandbox (SAND)SAND/USDT Analysis 📊
Recently, SAND has demonstrated significant performance, managing to shift its trajectory from a descending channel and reach the top of an ascending channel. Below is a more detailed analysis of the current situation and potential scenarios:
⚖️ Current Situation:
Breakout from the Descending Channel: SAND has exited the descending channel and is currently undergoing a pullback. This move started from the support zone (0.19 – 0.23 USD).
Current Correction: The upward wave has corrected to the 0.5 Fibonacci zone (0.45 – 0.49 USD). This level is a key zone for the continuation of the trend.
Red Resistance Zone: The price is currently facing significant resistance in the range of (0.8 – 0.99 USD). A successful close above this level is crucial for the continuation of the uptrend.
🔍 Upcoming Scenarios:
Bullish Scenario:
If the price manages to break and sustain above the red resistance zone (0.8 – 0.99 USD), the following targets become achievable:
1.618 Fibonacci: 1.41 – 1.69 USD
2.272 Fibonacci: 2.42 – 2.9 USD
2.618 Fibonacci: 3.94 – 4.98 USD
High volume entry during the breakout of the red resistance zone is essential.
Bearish Scenario:
If the price fails to break through the red resistance zone, a deeper correction is likely:
0.618 Fibonacci level: 0.4 – 0.43 USD
Green PRZ Zone: If the 0.618 Fibonacci level is lost, the price might drop to this zone, which includes daily resistance and the middle line of the channel.
⚙️ RSI Indicator:
RSI Support: The trendline connecting the RSI lows can serve as support during a price correction. The range (33.88 – 39.26) is key for RSI support.
Entry into Overbought Zone: RSI movement towards the overbought zone can push the price toward higher targets. Overextended zones (86.33 – 92.15) are accessible.
RSI Middle Line: This line could act as support and help stabilize the uptrend.
⚡️ Key Points:
Red Resistance Zone (0.8 – 0.99 USD): Sustaining above this zone is crucial for the continuation of the uptrend.
Formation of Strong Bullish Candles and Significant Volume: Strong bullish candlestick formations and a sharp increase in volume can confirm the breakout of this resistance.
Volume Consideration: High volume entry during the breakout of the resistance zone is a positive signal.
Price Behavior at the 0.5 Fibonacci Level: This level serves as the primary initial support.
PRZ Support Zone: In case of a correction, this zone (overlapping with daily resistance and the middle line of the channel) could prevent further price declines.
🔔 Summary:
The technical analysis of SAND indicates that after breaking out of the descending channel, the price is at a critical stage. A breakout above the red resistance zone (0.8 – 0.99 USD) could open the path for higher targets. However, traders should pay close attention to price behavior around key support and resistance zones and should not neglect risk management.
🟠 Practical Suggestions:
For Entering a Trade: Wait for a breakout of the red resistance zone along with high volume.
Risk Management: Diversify your capital into multiple parts and set stop-loss orders below key support levels.
Stay Updated: Given the constantly changing market conditions, staying updated with new analyses is essential.
⏰ Stay tuned for the next updates!

SAND tends to finish wave c before going up.As I can see right now, SAND is going down, forming the five waves of wave (c). If we count the waves, we will be in the third wave of wave c. If this is right, then we want wave 4 and 5 which will be ended around 0.59. Then it will be completed the correction wave to be ready for going UP!

$SAND/USDT Analysis NYSE:SAND is trading within an ascending channel with a strong support zone around $0.85-$0.87.
A breakout above the channel's midline suggests bullish momentum, targeting $1.11 +26% .

The Sandbox ($SAND): Leading the GameFi and Metaverse RevivalThe GameFi and Metaverse sectors are roaring back, with The Sandbox ( NYSE:SAND ) at the forefront of this resurgence. After a prolonged downtrend, NYSE:SAND has staged a remarkable comeback, surging 292% in just over two weeks. Starting from $0.20, it touched nearly $1 before consolidating around $0.75, currently down 3%. This rally has reignited interest in GameFi projects, positioning NYSE:SAND as a key player alongside Decentraland (MANA), Gala (GALA), and Axie Infinity (AXS), which have also seen significant gains.
Fundamental Catalysts
Several factors underscore NYSE:SAND ’s impressive performance. On-chain data reveals a surge in daily transactions, reaching 11,597—the highest in the past week. This spike indicates growing investor confidence and heightened network activity. Additionally, the rise in exchange withdrawals suggests that long-term holders are moving their tokens off exchanges, signaling a bullish sentiment and reduced sell pressure.
The Sandbox ecosystem has also benefited from renewed interest in the Metaverse and GameFi sectors, as projects with tangible utility and strong communities attract capital during this market phase. This broader revival aligns with the resurgence of decentralized applications and virtual worlds, where NYSE:SAND remains a prominent utility token.
Technical Outlook
From a technical standpoint, NYSE:SAND has broken out of a long-term falling wedge pattern—typically a bullish reversal signal. This pattern had previously led to a 75% decline, but the recent 292% surge marks a significant recovery. The breakout has set the stage for potential further gains, with the next target at $1.40. However, caution is warranted as the Relative Strength Index (RSI) is currently in overbought territory.
A retracement to the 38.2% Fibonacci level could provide a strategic entry point for investors looking to capitalize on the next rally. This correction would be healthy, allowing NYSE:SAND to build a stronger foundation for its upward trajectory.
Broader Market Dynamics
NYSE:SAND ’s performance is closely linked to the broader cryptocurrency market, particularly Bitcoin ( CRYPTOCAP:BTC ). As CRYPTOCAP:BTC eyes the $100,000 milestone, altcoins like NYSE:SAND often mirror its movements. A sustained Bitcoin rally could propel NYSE:SAND toward its $1.20 target and beyond, especially as the GameFi narrative gains traction.
The recent surge in Metaverse-related tokens reflects a growing consensus that virtual worlds and decentralized gaming will play a crucial role in the next phase of blockchain adoption. The Sandbox’s strong fundamentals, combined with its active development and partnerships, position it well to benefit from this trend.
Investor Takeaway
The Sandbox’s rally is more than just a technical bounce; it represents a fundamental resurgence in the GameFi and Metaverse sectors. Investors should monitor key support and resistance levels, stay attuned to Bitcoin’s movements, and watch for signs of continued on-chain strength. NYSE:SAND ’s journey from $0.20 to nearly $1 is a testament to its potential, and the path to $1.40 and beyond could be within reach if the current momentum holds.
