Major Breakout Setup Forming on Bitcoin’s 1-Hour Chart👋🏻 Hey everyone! Hope you’re doing great! Welcome to SatoshiFrame channel.
✨ Today we’re diving into the 1-Hour Bitcoin analysis. Stay tuned and follow along!
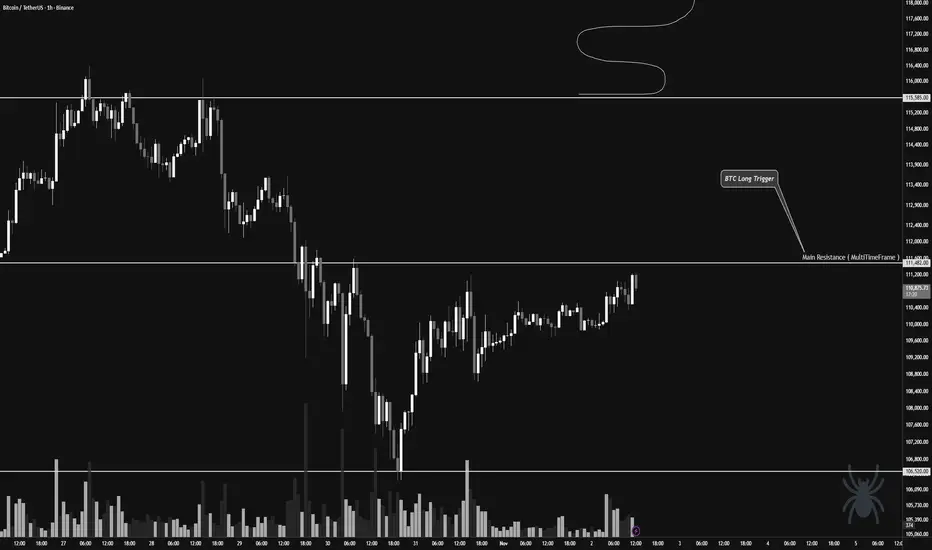
👀 On Bitcoin’s 1-hour timeframe, we can see that Bitcoin has built a multi-timeframe accumulation zone as the weekend began. It has now successfully broken above the top of this range, but we have a notable resistance area to keep an eye on.
The $111,482 price zone is a strong resistance level, and when price reached this zone, it faced heavy rejection and selling pressure. This area could provide the best trigger for a breakout. If Bitcoin manages to break above it, we could see a strong bullish leg and further upside momentum.
🧲 Bitcoin’s trading volume has slightly decreased over the past few days, so we’re waiting for volume expansion during the New York session to see what kind of reaction we get — this will guide our trade setup. Since there’s also a meeting between the U.S. and Chinese presidents tomorrow, we might prepare a speculative position ahead of that event to capture potential volatility and profits.
My current bias on Bitcoin remains bullish, as the trend hasn’t broken any significant support levels yet.
💵 Meanwhile, Tether Dominance (USDT.D) has reacted three times to its upper resistance zone on higher timeframes but failed to break above it. This suggests a bullish outlook for the crypto market, as a rejection in Tether Dominance could lead to downside movement there — fueling a strong bullish leg across the market.
✍️ The main long setup will trigger on a break above the $111,482 resistance zone. Confirmation can be taken from RSI oscillator signals and increasing buying volume.
We can open this low-risk long position (around 0.5% risk), and if tomorrow’s session brings clear bullish triggers, we can add to the position for larger exposure.
❤️ Disclaimer : This analysis is purely based on my personal opinion and I only trade if the stated triggers are activated .
Satoshimultiframe
Has Bitcoin entered the distribution phase yet?👋🏻 Hey everyone! Hope you’re doing great! Welcome to SatoshiFrame channel.
✨ Today we’re diving into the 4-Hour Bitcoin analysis. Stay tuned and follow along!
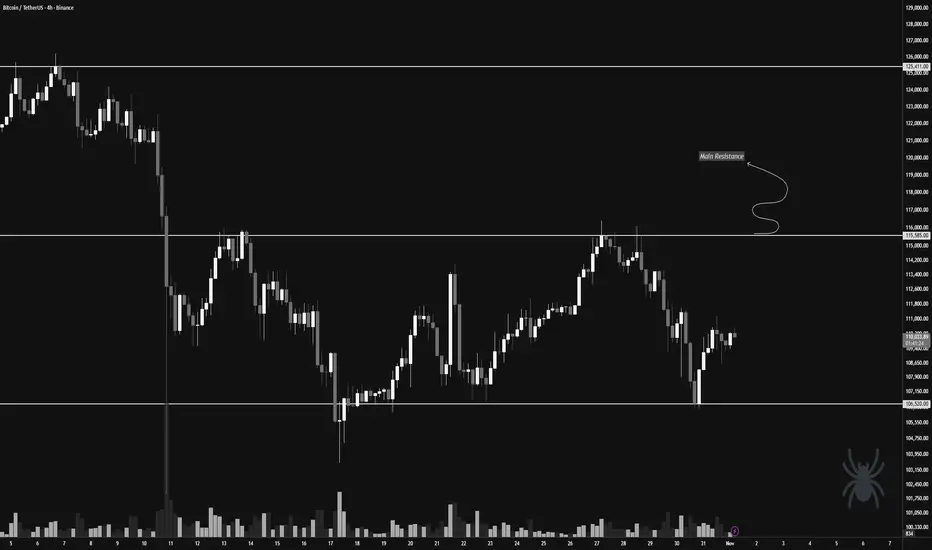
👀 On the 4-hour timeframe, we can see that Bitcoin recently dropped due to the impact of the FOMC news but then rebounded from the key support level at $106,520 and is now facing its multi-timeframe resistances. Looking at the chart more broadly, we notice equal highs and lows around the $115,585 and $106,520 zones. With a breakout of either of these levels, Bitcoin could experience a sharp and significant move.
🧲 Bitcoin’s selling volume has slightly increased, and if the supports break, this selling could turn into pressure — collectively applying downward force on the market price. Then, buyers may re-enter and start buying Bitcoin again. The hypothesis of a possible distribution phase could turn into a valid theory; however, we must be cautious — if Bitcoin decides to move upward after Monday’s session, it could confirm a new all-time high and continue its upward trend.
✍️ The main scenario for Bitcoin lies around the $115,585 price zone. If this level breaks, we could enter a long position and stay with it for a potentially extended upward move. It’s worth noting that an increase in buying volume along this path could serve as a strong confirmation for our long position.
On the other hand, the short position scenario would become valid if the price breaks below the support and selling pressure intensifies, giving us a high-momentum short setup.
❤️ Disclaimer : This analysis is purely based on my personal opinion and I only trade if the stated triggers are activated .
Bitcoin Breakout or a Deeper Rest Ahead ?👋🏻 Hey everyone! Hope you’re doing great! Welcome to SatoshiFrame channel.
✨ Today we’re diving into the 4-Hour Bitcoin analysis. Stay tuned and follow along!
👀 We’re looking at Bitcoin on the 4-hour timeframe. Bitcoin is currently in a bullish correction and awaiting tomorrow’s news. It’s worth noting that this upward correction is happening below the key resistance level at $115,555. A breakout above this zone could allow Bitcoin to continue the bullish leg it has already started.
🧮 Looking at the RSI oscillator, Bitcoin’s momentum previously entered the overbought area but has now exited and is oscillating below the 70 zone, which now acts as the current resistance level.
✔️ Let’s pay closer attention to Bitcoin’s trading volume — as price approached its major resistance, volume increased. However, given the upcoming news, this wasn’t enough to break resistance, and Bitcoin was rejected from that zone, pulling slightly downward. This downward move isn’t very strong and is accompanied by weak corrective momentum.
✍️ The current Bitcoin scenarios have been updated — you can now focus more closely on these scenarios in the next part of the analysis.
🟢 Long position scenario: A breakout above the key resistance level at $115,555, combined with rising buy volume and an RSI swing above the 70 zone, could mark the end of the correction and continuation of the bullish move.
❤️ Disclaimer : This analysis is purely based on my personal opinion and I only trade if the stated triggers are activated .

USDT Dominance Breakdown and Market Rally !!!👋🏻 Hey everyone! Hope you’re doing great! Welcome to SatoshiFrame channel.
✨ Today we’re diving into the 4-Hour USDT.D analysis. Stay tuned and follow along.
👀 On the 4-hour timeframe, USDT dominance was rejected downward as it approached its seller-taker zone. With heavy USDT selling, it lost its key support at 4.89%, giving us a confirmation signal for long positions. USDT dominance is now sitting on a key support at 4.74%, with another close support at 4.61%. If these two key levels are broken, the prices of coins can become significantly more expensive.
🔍 Which support zone currently acts as the key one? The 4.74% level can create a short-term pullback in the market, but if you look closely, it has not yet shown any sign of weakening the downtrend or stopping the heavy USDT sell-off. Sellers are not interested in holding USDT in their wallets, and over the past weeks, we have also seen large USDT minting from the issuing company.
Regarding the 4.61% level: breaking this zone will likely require a whale liquidation move, clearing many short positions and large sell orders, which could then trigger a price rally.
🧮 On the 4-hour timeframe, the RSI oscillator is currently in the OverSell zone. Since we cannot rely only on this, we look at the daily timeframe. On the daily chart, USDT dominance is pushing below the 50 level, indicating continued broad selling pressure of USDT — a behavior usually aligned with breakouts in the crypto market.
⁉️ So what information is USDT dominance giving us now? If we observe dominance behavior on the 4-hour chart and compare it with the daily structure, we can identify the beginning of a strong bullish leg in the market, where the prerequisites are the breakdown of the multi-timeframe support zones mentioned in the first paragraph.
❤️ Disclaimer : This analysis is purely based on my personal opinion and I only trade if the stated triggers are activated .

Second Leg Incoming? Ethereum Needs Volume.👋🏻 Hey everyone! Hope you’re doing great! Welcome to SatoshiFrame channel.
✨ Today we’re diving into the 4-Hour Ethereum analysis. Stay tuned and follow along.
👀 Looking at Ethereum on the 4-hour timeframe, we can see that just like Bitcoin, Ethereum began a strong bullish leg yesterday, breaking several of its multi-timeframe resistances. With this price jump, it has now reached its resistance area at $4,252. Keep in mind that the market may take a short rest at this level, and price may experience a brief pullback to the downside.
🧮 The RSI oscillator is currently exiting the OverBuy zone, which is a sign that a multi-timeframe correction may begin for Ethereum.
🕯 During this bullish leg, Ethereum’s volume has increased slightly. However, since sell orders have been lower than before, this volume increase does not appear very strong on the 4-hour chart. Therefore, if Ethereum intends to form its second bullish leg upward, we will likely need to see a more noticeable increase in buying volume.
✍️ The scenario ahead for Ethereum, like Bitcoin, is independent of any trade or position, and it simply helps us better understand Ethereum’s corrective price behavior.
🛡 Ethereum, similar to Bitcoin, is entering a price resting phase. This rest can extend down toward support levels, and if a stronger bullish continuation wants to form, we may see a reversal reaction near these zones. If such a move occurs, the analysis and scenarios will be updated for you.
❤️ Disclaimer : This analysis is purely based on my personal opinion and I only trade if the stated triggers are activated .

Ethereum weakened or holding structure? | ETH 1H Analysis👋🏻 Hey everyone! Hope you’re doing great! Welcome to SatoshiFrame channel.
✨ Today we’re diving into the 1-Hour Ethereum analysis. Stay tuned and follow along.
👀 We observe Ethereum on the 1-hour timeframe. After breaking and stabilizing at the $3,889 zone, Ethereum formed a higher low on this area and is now moving along a trendline (dynamic support), with an important static resistance at $3,982.50. Price has reacted to this level once but has not succeeded in breaking it!!!
🧮 Using the RSI oscillator is a reasonable approach in this situation. Since Ethereum is currently in a box/trading range, a breakout requires entering overbuy territory and surpassing the 70 level. Note that there is a significant oscillation support below the average, at the 44.5 zone, which holds strong validity and represents our swing low.
🐷 Pay attention to Ethereum’s volume. To break the specified zone, Ethereum needs to show a strong reaction, fill sell orders, and liquidate futures contracts. Therefore, we need buyer market makers to support the breakout, causing volume to increase through a price jump.
✍️ The scenario forming for Ethereum may require some patience and could play out differently, because we are now facing the second touch of this level, so the win rate of this scenario may be slightly lower.
🟢 Long Position Scenario
Breaking Ethereum’s resistance at $3,982.50 along with surpassing the 70 RSI level and seeing a significant increase in buying volume and price squeeze can form a good long position scenario on Ethereum.
❤️ Disclaimer : This analysis is purely based on my personal opinion and I only trade if the stated triggers are activated .

Bitcoin is now positioned below its main resistance! | Day 10👋🏻 Hey everyone! Hope you’re doing great! Welcome to SatoshiFrame channel.
✨ Today we’re diving into the 1-Hour Bitcoin analysis. Stay tuned and follow along!
👀 Bitcoin has still not succeeded in breaking the resistance zone at $111,458. However, Bitcoin formed a higher low compared to its previous low, which increases the probability of breaking this resistance and gives it a higher win rate for a breakout.
🧮 Pay attention to the RSI oscillator. The 70 zone has maintained its overlap with Bitcoin just like yesterday, with the difference that the RSI support zone is now in the 45 range, which also overlaps with the newly formed higher low.
💰 Bitcoin’s volume in the 1-hour time frame has increased after forming a higher low, meaning this low is being respected by buyers, and the desire to break multi-timeframe resistances has increased. Breaking the current resistance zone requires strong buying volume so that sell orders are filled and some futures orders get liquidated.
✍️ The expected scenario for Bitcoin does not differ significantly from yesterday’s scenario.
🟢 Long Position Scenario
Break the key resistance at $111,458, surpass the 70 level on RSI and enter overbuy territory, accompanied by increased buying volume and a price squeeze.
❤️ Disclaimer : This analysis is purely based on my personal opinion and I only trade if the stated triggers are activated .

Can BTC break the 111681$ resistance? | BTC 1H Analysis D2👋 Hey everyone! Hope you’re doing great! - ❤️ Welcome to Satoshi Frame .
📅 Today we’re diving into the 1-hour Bitcoin analysis. Stay tuned and follow along!
👀 On the 1-hour timeframe of Bitcoin (BTC), we can see that — similar to USDT.D — it is moving within a range box, but inversely positioned near a Maker Buyer support and a multi-timeframe Low at $111,681. A confirmed breakout above this zone could push Bitcoin upward toward the box midline.
🧮 Looking at the RSI oscillator, we can see that it’s currently oscillating between the Oversell (30) Low and the static ceiling around 53. A breakout beyond either of these boundaries would likely signal the start of Bitcoin’s next move.
🕯 Recent volume on Bitcoin has increased as it reached the Maker Buyer zone — strong buying pressure from market makers has helped defend this support level effectively. Right now, Bitcoin sits just below a resistance area that will require a significant uptick in buying volume to break and confirm stability above it.
🧠 For Bitcoin positioning, we can consider that this current Low is very strong and unlikely to break easily, so the main focus should remain on long positions:
🟢 Long Scenario: Once Bitcoin breaks the multi-timeframe resistance at $111,681, combined with RSI surpassing the 53 threshold and a visible increase in buying volume, a long position setup becomes valid.
🔴 Short Scenario: Since the Maker Buyer support is very strong and USDT.D has been repeatedly rejected at its top, it’s better to wait until the Maker Buyer zone breaks with a large whale candle before considering short setups.
❤️ Disclaimer : This analysis is purely based on my personal opinion and I only trade if the stated triggers are activated .
