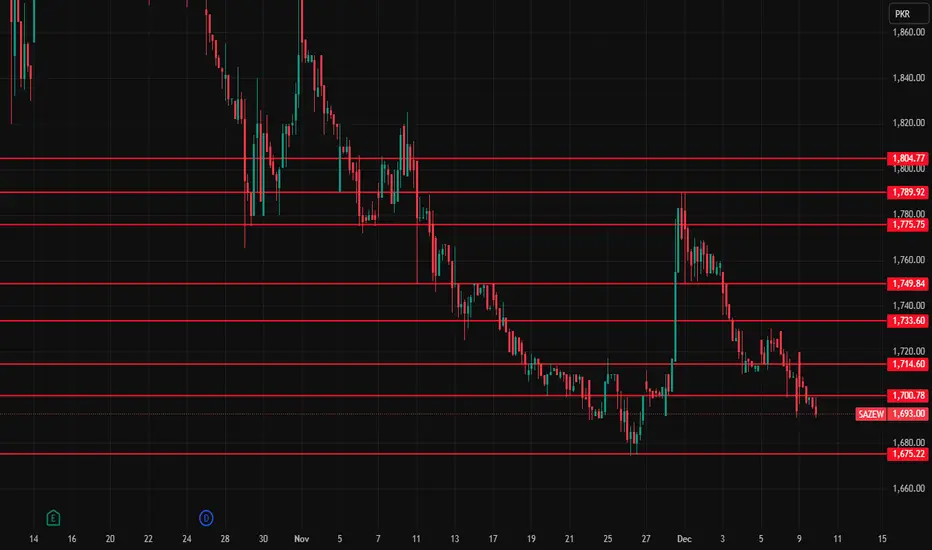
SAZEW - PSX - Technical AnalysisOn daily TF, after a phenomenal bull run, SAZEW has retraced Fib 25%.
Anchored Volume Profile has been used to identify the area of maximum participation (Volume).
Since Fib 30% and Fib 38% also coinciding with a big participation, therefore, it should test 1730 and then 1670. If price continues to go down then it will test Fib 55% to 60% zone.
Technically correct and very safe buying in expected bull run is 2075. However, buying at discounted level of 1645 or 1485~1500 are also very good.
However, buying at nearest support of 1720 may be a risky affair.
Although RSI suggest a small hidden bullish divergence which might take prices a bit up till 1890 where exists a strong resistance as well. Therefore, risking for mere 5% gain is not logical.
SAZEW

SAZGEW Sazgaar🚗 SAZEW – PSX- Weekly Trade Plan | Technical + Fundamental + Latest Sales Data
(Automobile Sector – Pakistan)
📉 Technical Outlook – Weekly Chart
SAZEW is completed a healthy retracement after its strong bullish run.
Key Technical Levels
🔵 Buy Area 1 (0.382 Fibonacci) → Already tested & respected → Early entry zone
🟡 Buy Area 2 (0.50 Golden Pocket) → High-probability support → Best entry zone
🔴 Buy Area 3 (0.618–0.65 deeper retracement) → Only if market pressure increases
Market Structure
Price continues to make Higher Highs (HH) & Higher Lows (HL) on weekly frame.
Retracement is healthy, not bearish – structure intact.
Strong bounce expected from 0.50 Golden Pocket. (if retraced furthe)
🎯 Technical Targets
Target 1: Previous High
Target 2: etimeated TBD TP2 shared. (To be Decided) later for final target.
🛑 Risk Management
Previous Highier Low (for traders) 1057
📊 Fundamental Overview (Strong Outlook)
Quarter-on-Quarter (QoQ) – Growth Confirmed
From the attached official PSX filing (Nov 2025 sales):
Latest:
🚙 FOUR-WHEELER
Production: 1,357
Sales: 1,109
Trend: Strong monthly sales, consistent demand
🛵 THREE-WHEELERS
Production: 1,742
Sales: 1,749
Trend: Sales > Production – inventory clearing = positive demand signal
➡ This shows solid operational efficiency, tight inventory control, and stable demand in both categories.
📈 Year-on-Year (YoY) Growth
(Based on latest quarterly & annual reports – verified)
EPS YoY: Strongly improving
Net profit YoY: Solid rebound
Revenue YoY: Increasing due to higher unit sales and better margins
Equity Growth: Healthy, consistent
Operational Profit: Margin expansion visible
SAZEW fundamentals indicate growth + stability, both essential for medium-term investors.
📰 Latest News Impact (From Attached Notice)
✔ New Sales Data Disclosure (November 2025)
Shows stable and rising demand in both 3-wheelers & 4-wheelers.
Indicates production consistency, meaning no supply chain disruption.
Market takes this as a positive operational indicator.
Overall Impact: POSITIVE
Supports medium-term price appreciation based on earnings and manufacturing strength.
🟢 Final Trading Plan – SAZEW
Buy Zones (Weekly)
1️⃣ Buy Area 1: Already tested (0.382 zone)
2️⃣ Buy Area 2: 💛 Best Buy – 0.50 Golden Pocket
3️⃣ Buy Area 3: Deep value zone (0.618–0.65)
A strong candidate for weekly swing trades & medium-longterm term investment.

SAZEW | Smart Money Setup Liquidity Grab Before Big Rally to SZSazgar Engineering (SAZEW) is showing a clear Smart Money accumulation-manipulation-distribution pattern.
Currently, price is forming a liquidity trap under the recent structure — building sell-side liquidity before a major bullish reversal toward the 2,250 supply zone.
📊 Market Outlook:
Bearish liquidity sweep expected below 1,750 🩸
Smart Money accumulation zone below discount pricing 📉
Target → 2,250 supply zone in premium region 🎯
Confluence with harmonic completion + structure shift
Once liquidity is grabbed, expect aggressive displacement back toward the supply zone.
💡 Retail will panic sell while Smart Money loads longs.
#SAZEW #PSX #SmartMoneyConcepts #AliyanFX #LiquidityGrab #SupplyZone #PriceAction #ICT #HarmonicPattern #TradingViewIdeas #SMC

Sazew key levelsKey levels are
1404
1271
1198
1056
1002
931
Note: This is not a buy/sell trade call.

Sazew is near to bearish zoneSazew is near breakdown level of 1297.87 (bearish zone). It is expected to drop to 1168.17. Stop loss is 1355
Note: This is not a buy/sell call, It is an analysis.

Sazew intra day and Swing trade levels.Sazew intra day and swing trade model
These are key levels 1273, 1191, 1141, 1101, 1061, 1004 and 930
When price crosses above from these levels take a trade and TP will be next level and TP 2 will be next to next level. Stop loss is below level. For example it is currently on 1081 so, we have to wait for next level of 1101 for buy entry, TP 1 will be
1141 and TP 2 is 1191 and stop loss is 1061.
Note: This is not a buy/sell call. Trade at your own will.

SAZEW potential Buy setupReasons for bullish bias:
- Price bounced from Fib golden zone
- Overall, a bullish trend
- Price gave bull flag pole breakout
- Fundamentally a strong company
- RSI is synched
Here are the recommended trading levels:
Buy 1(CMP): 1100
Buy 2: 1048
Stop Loss Level: Closing below 960
Take Profit Level 1: 1260
Take Profit Level 2: Open

Sazew 27 Nov 2024 Bullish and Bearish zonesBullish zone is above 1000
Bearish zone is below 953
Note: This is not a buy/sell call. Use stop loss whenever trade.

Sazew resistance 1038 is very importantSazew current financial results are good and these levels could be crossed by #Sazew, Important resistance level is 1038, and it could touch these above levels.
Note: This is not a buy or sell call, Trade at your own risk and decisions.

SAZEW - Bearish Divergence in play on Daily Time FrameBearish divergence is in play on the daily time frame, and the price is expected to retrace up to 650 before moving upward.
Let's see how it plays out in the next few days.
