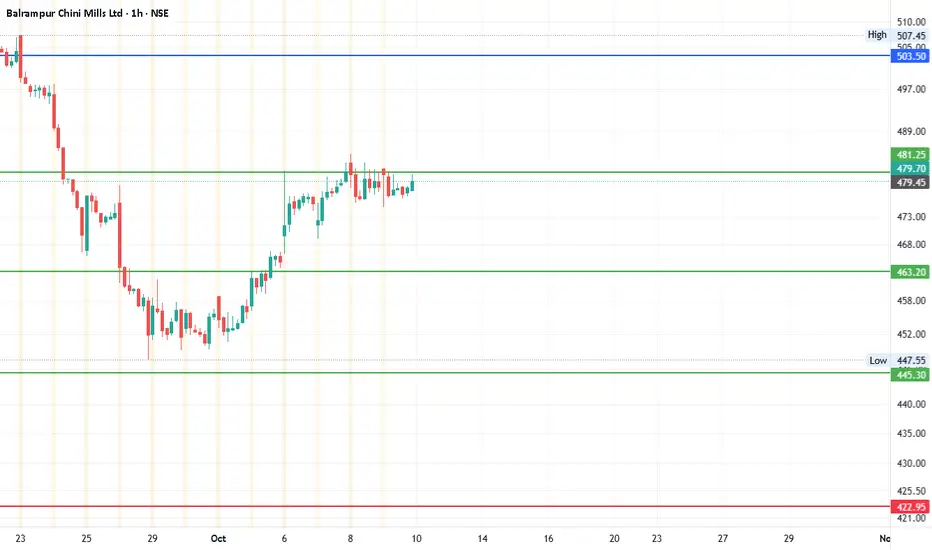
#Balramchin - Range between 354 and 573?Date: 09-10-2025
#Balramchin - Current Price: 479.7
Pivot Point: 463 Resistance: 481 Support: 445
Upside Levels:
L1: 504
L2: 526
L3: 549
L4: 573
Downside Levels:
L1: 423
L2: 401
L3: 377
L4: 354
Quick Updates on X
#TradingView #Nifty #BankNifty #DJI #NDQ #SENSEX #DAX #USOIL #GOLD #SILVER
Sbin
State Bank of India Ltd for 10th Dec #SBIN State Bank of India Ltd for 10th Dec #SBIN
Resistance 960 Watching above 961 for upside momentum.
Support area950-953 Below 950 gnoring upside momentum for intraday
Watching below 948 for downside movement...
Above 960 ignoring downside move for intraday
Charts for Educational purposes only.
Please follow strict stop loss and risk reward if you follow the level.
Thanks,
V Trade Point

State Bank of India Ltd for 6th Nov #SBIN State Bank of India Ltd for 6th Nov #SBIN
Resistance 960 Watching above 961 for upside momentum.
Support area 950-953 Below 950 gnoring upside momentum for intraday
Watching below 950 for downside movement...
Above 960 ignoring downside move for intraday
Charts for Educational purposes only.
Please follow strict stop loss and risk reward if you follow the level.
Thanks,
V Trade Point

State Bank of India Ltd for 5th Nov #SBINState Bank of India Ltd for 5th Nov #SBIN
Resistance 960 Watching above 961 for upside momentum.
Support area 950-953 Below 950 gnoring upside momentum for intraday
Watching below 950 for downside movement...
Above 960 ignoring downside move for intraday
Charts for Educational purposes only.
Please follow strict stop loss and risk reward if you follow the level.
Thanks,
V Trade Point

State Bank of India Ltd for 4th Nov #SBIN State Bank of India Ltd for 4th Nov #SBIN
Resistance 950-953 Watching above 953 for upside momentum.
Support area 940 Below 940 gnoring upside momentum for intraday
Watching below 939 for downside movement...
Above 950 ignoring downside move for intraday
Charts for Educational purposes only.
Please follow strict stop loss and risk reward if you follow the level.
Thanks,
V Trade Poin

SBINNSE:SBIN
Note :
1. One should go long with a Stop Loss, below the Trendline or the Previous Swing Low.
2. Risk :Reward ratio should be minimum 1:2.
3. Plan your trade as per the Money Management and Risk Appetite.
Disclaimer :
>You are responsible for your profits and loss.
>The idea shared here is purely for Educational purpose.
>Follow back, for more ideas and their notifications on your email.
>Support and Like incase the idea works for you.

State Bank of India Ltd for 28th Oct #SBIN State Bank of India Ltd for 28th Oct #SBIN
Resistance 925-927 Watching above 927 for upside momentum.
Support area 910 Below 920 gnoring upside momentum for intraday
Watching below 908 for downside movement...
Above 920 ignoring downside move for intraday
Charts for Educational purposes only.
Please follow strict stop loss and risk reward if you follow the level.
Thanks,
V Trade Point

State Bank of India Ltd for 27th Oct #SBINState Bank of India Ltd for 27th Oct #SBIN
Resistance 910 Watching above 911 for upside momentum.
Support area 897-900 Below 900 gnoring upside momentum for intraday
Watching below 896 for downside movement...
Above 910 ignoring downside move for intraday
Charts for Educational purposes only.
Please follow strict stop loss and risk reward if you follow the level.
Thanks,
V Trade Point

State Bank of India Ltd for 23rd Oct #SBIN State Bank of India Ltd for 23rd Oct #SBIN
Resistance 910-913 Watching above 913 for upside momentum.
Support area 900 Below 900 gnoring upside momentum for intraday
Watching below 898 for downside movement...
Above 910 ignoring downside move for intraday
Charts for Educational purposes only.
Please follow strict stop loss and risk reward if you follow the level.
Thanks,
V Trade Point

State Bank of India Ltd for 15th Oct #SBINState Bank of India Ltd for 15th Oct #SBIN
Resistance 885 Watching above 886 for upside momentum.
Support area 870 Below 875 gnoring upside momentum for intraday
Watching below 869 for downside movement...
Above 875 ignoring downside move for intraday
Charts for Educational purposes only.
Please follow strict stop loss and risk reward if you follow the level.
Thanks,
V Trade Point

State Bank of India Ltd for 14th Oct #SBINState Bank of India Ltd for 14th Oct #SBIN
Resistance 885 Watching above 886 for upside momentum.
Support area 870 Below 875 gnoring upside momentum for intraday
Watching below 869 for downside movement...
Above 875 ignoring downside move for intraday
Charts for Educational purposes only.
Please follow strict stop loss and risk reward if you follow the level.
Thanks,
V Trade Point

State Bank of India Ltd for 13th Oct #SBIN State Bank of India Ltd for 13th Oct #SBIN
Resistance 885 Watching above 886 for upside momentum.
Support area 870 Below 875 gnoring upside momentum for intraday
Watching below 869 for downside movement...
Above 875 ignoring downside move for intraday
Charts for Educational purposes only.
Please follow strict stop loss and risk reward if you follow the level.
Thanks,
V Trade Point

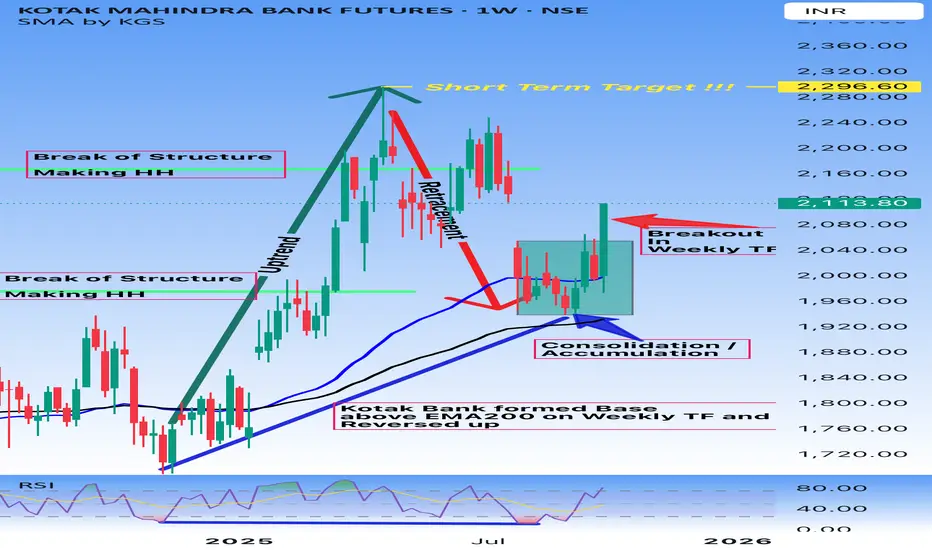
Buy KotakBank - Multiple confirmation - Technical Anaysis
Kotak Mahindra Bank Futures (Weekly Timeframe Analysis)
Current Price: 2,113.80
Technical Analysis:
1. Trend Structure
• Previous strong uptrend with Higher Highs (HH) formation.
• Experienced a retracement phase after topping out.
• Recently consolidated in a range, forming an accumulation zone above the 200 EMA (Weekly TF) and around 100 EMA.
2. Range Breakout Confirmation
• Range Breakout observed on the weekly timeframe after consolidation.
• Price sustained above EMA 200, showing strength.
3. Key Levels
• Support Zone: ₹1,880 – ₹1,940 (consolidation base).
• Resistance Zone / Short-Term Target: ₹2,296.60.
4. Indicators
• Hidden Divergence formed on weekly timeframe, the same area where accumulation happened & RSI bounced from oversold levels and crossed above 50, indicating renewed momentum.
• 100 EMA above 200 EMA shows the trend in favor of bulls.
🎯 Trading Plan:
• Bullish Bias: As long as the price sustains above ₹1,940–1,960 zone.
• Targets:
• Short-Term: ₹2,296.60
• Medium-Term: Higher levels possible if momentum sustains.
• Risk Management:
• Stop-loss below ₹1,880 (recent accumulation low).
Summary:
Kotak Mahindra Bank Futures has broken out from weekly consolidation after forming a strong base above EMA 200. The structure suggests the potential to move towards ₹2,296.60 in the short term, with RSI and price action both supporting bullish momentum.
SBIN Chart Breakout – Momentum AheadSBIN Double Breakout Alert
On the 4H timeframe, SBIN has given a parallel channel breakout.
Additionally, it has also confirmed a broadening pattern breakout.
Sustaining above the ₹850–₹860 level may open the path for higher prices ahead.
Thank you!

State Bank of India Ltd for 18th Sept #SBIN State Bank of India Ltd for 18th Sept #SBIN
Resistance 860 Watching above 861 for upside momentum.
Support area 850 Below 850 gnoring upside momentum for intraday
Watching below 846 for downside movement...
Above 860 ignoring downside move for intraday
Charts for Educational purposes only.
Please follow strict stop loss and risk reward if you follow the level.
Thanks,
V Trade Point

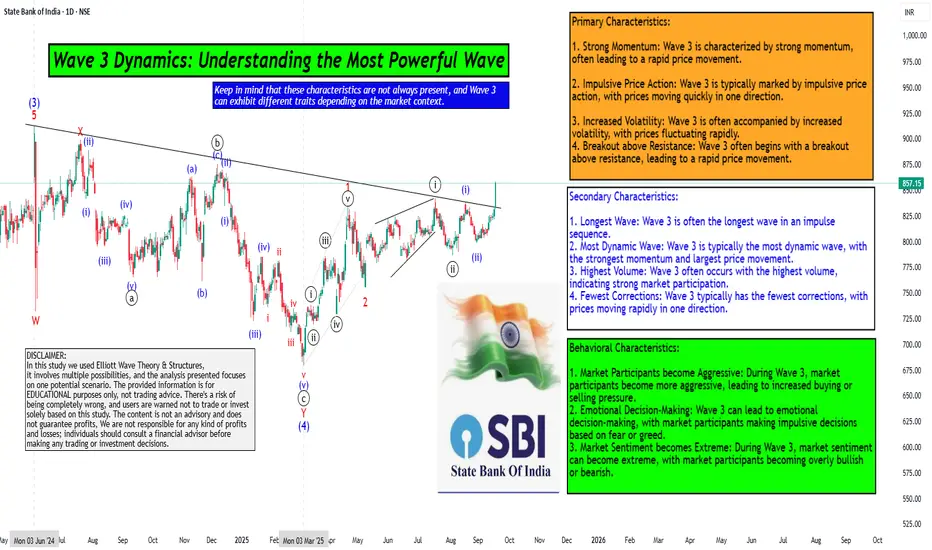
Wave 3 Dynamics: Understanding the Most Powerful WaveHello Friends, Welcome to RK_Chaarts,
For Learning and Practicing chart Analyzing, Today we are trying to Analyse the State Bank of India (SBIN) chart from an Elliott Wave perspective, we can see that the intermediate-degree Wave (3) completed at the June 2024 high. This was followed by a complex correction that ended at the March 2025 low, marking the completion of Wave (4).
We are currently unfolding Wave (5), which will complete the higher-degree Wave ((3)) of Primary degree in black. Within Wave (5), we have five minor-degree subdivisions, which we can see unfolding.
The first minor-degree Wave 1 completed at the 22nd April 2025 high, followed by a Wave 2 correction that ended at the May 9, 2025 low. We are currently in Wave 3, which is a dynamic wave with strong momentum.
Within Wave 3, we have five minute-degree subdivisions, which are unfolding. The first two subdivisions are complete, and we are currently in the third subdivision.
The characteristics of Wave ((iii)) of 3 are evident in the price action, with a strong breakout above the resistance trend line and good intensity of volumes. The Moving Convergence Divergence (MACD) is also positive, and the Relative Strength Index (RSI) is above 60, indicating strong momentum.
The daily Exponential moving averages (50 and 200) are also aligned in favor of the trend. All these parameters support our view, and we can see an inverted head-and-shoulders pattern or a double rounding bottom pattern unfolding.
Overall, the breakout looks promising, and we can expect further upside in SBIN as per Elliott wave theory.
Detailed wave counts on chart
Primary Characteristics:
1. Strong Momentum: Wave 3 is characterized by strong momentum, often leading to a rapid price movement.
2. Impulsive Price Action: Wave 3 is typically marked by impulsive price action, with prices moving quickly in one direction.
3. Increased Volatility: Wave 3 is often accompanied by increased volatility, with prices fluctuating rapidly.
4. Breakout above Resistance: Wave 3 often begins with a breakout above resistance, leading to a rapid price movement.
Secondary Characteristics:
1. Longest Wave: Wave 3 is often the longest wave in an impulse sequence.
2. Most Dynamic Wave: Wave 3 is typically the most dynamic wave, with the strongest momentum and largest price movement.
3. Highest Volume: Wave 3 often occurs with the highest volume, indicating strong market participation.
4. Fewest Corrections: Wave 3 typically has the fewest corrections, with prices moving rapidly in one direction.
Behavioral Characteristics:
1. Market Participants become Aggressive: During Wave 3, market participants become more aggressive, leading to increased buying or selling pressure.
2. Emotional Decision-Making: Wave 3 can lead to emotional decision-making, with market participants making impulsive decisions based on fear or greed.
3. Market Sentiment becomes Extreme: During Wave 3, market sentiment can become extreme, with market participants becoming overly bullish or bearish.
Keep in mind that these characteristics are not always present, and Wave 3 can exhibit different traits depending on the market context.
Here are some snapshots shared below to understand the concept & example
Largest wave among wave 1-3-5
Strong Momentum like 90 degree move, Vertical move, Rapid move & Dynamic move
Breakout with good volumes
Price trading above 50, 100 & 200 Day Exponential Moving Average
RSI Breakout on Daily
RSI Breakout on Weekly
MACD weekly
MACD Daily
Pattern Repeating
I am not Sebi registered analyst. My studies are for educational purpose only.
Please Consult your financial advisor before trading or investing.
I am not responsible for any kinds of your profits and your losses.
Most investors treat trading as a hobby because they have a full-time job doing something else.
However, If you treat trading like a business, it will pay you like a business.
If you treat like a hobby, hobbies don't pay, they cost you...!
Hope this post is helpful to community
Thanks
RK💕
Disclaimer and Risk Warning.
The analysis and discussion provided on in.tradingview.com is intended for educational purposes only and should not be relied upon for trading decisions. RK_Chaarts is not an investment adviser and the information provided here should not be taken as professional investment advice. Before buying or selling any investments, securities, or precious metals, it is recommended that you conduct your own due diligence. RK_Chaarts does not share in your profits and will not take responsibility for any losses you may incur. So Please Consult your financial advisor before trading or investing.
SBI long setup *SBIN*📈 Trade Setup
Pattern: 5.5-month consolidation + neckline breakout awaited, W-formation on daily.
Trigger: Watch for breakout above inside-candle high with strong volume.
Weekly chart: Bullish bias supported by engulfing/reversal candles.
🎯 Levels
Entry: Above inside-candle high (≈₹825–826).
Stop-loss: ₹810 (inside-candle low / neckline support).
Targets:
T1: ₹840
T2: ₹880
T3: ₹900
📊 Risk/Reward
SL risk ≈ ₹16/share.
R:R = ~0.9:1 (T1), 3.4:1 (T2), 4.6:1 (T3).
Best to book partial at 840, trail stop to cost, hold rest toward 880–900.
🚦 Checklist
✅ Entry only on breakout + above-average volume.
✅ SL strictly below 810.
✅ Manage position: partial booking + trailing stop.
❌ Invalidation: daily Close below (~₹810).

SPX 2Hour Time frameSPX 2-Hour Snapshot
Current Value: 6,512.61 USD
Change: +0.27% from the previous close
Intraday High: 6,525.75 USD
Intraday Low: 6,490.25 USD
🔎 Technical Indicators
Relative Strength Index (RSI): Neutral
Moving Averages:
5-period MA: 6,487.92 USD
20-period MA: 6,456.40 USD
50-period MA: 6,363.42 USD
100-period MA: 6,086.43 USD
200-period MA: 5,975.33 USD
📈 Market Sentiment
Pivot Points:
Resistance: 6,525.75 USD
Support: 6,490.25 USD
📅 Outlook
Bullish Scenario: A breakout above 6,525.75 USD could signal a move toward 6,600 USD.
Bearish Scenario: A drop below 6,490.25 USD may lead to further downside.
Overall Bias: Neutral, with mixed signals from moving averages and momentum indicators.

SENSEX 4Hour Time frameCurrent Level: Around 81,450 – 81,500
Intraday Change: Up about +350 to +400 points (~+0.5%)
Trend: Strong bullish momentum
Key Pivot Levels (for reference on 4-hour chart)
Pivot Point: 81,070
Resistance:
R1: 81,212
R2: 81,324
R3: 81,466
Support:
S1: 80,959
S2: 80,817
S3: 80,706
Technical View (4-Hour Frame)
Momentum: Trading near R3 (81,466) — showing strong buying strength.
Indicators: RSI is in bullish territory (~65), MACD is positive, and moving averages point upward.
Bias:
If Sensex sustains above R3, next upside targets can extend further beyond 81,500.
A pullback below Pivot (81,070) would shift bias toward supports around 80,960 – 80,820.
✅ Conclusion: Sensex on the 4-hour timeframe is bullish, trading near its resistance highs. Buyers are in control, though some profit-booking is possible if it struggles to stay above 81,466.
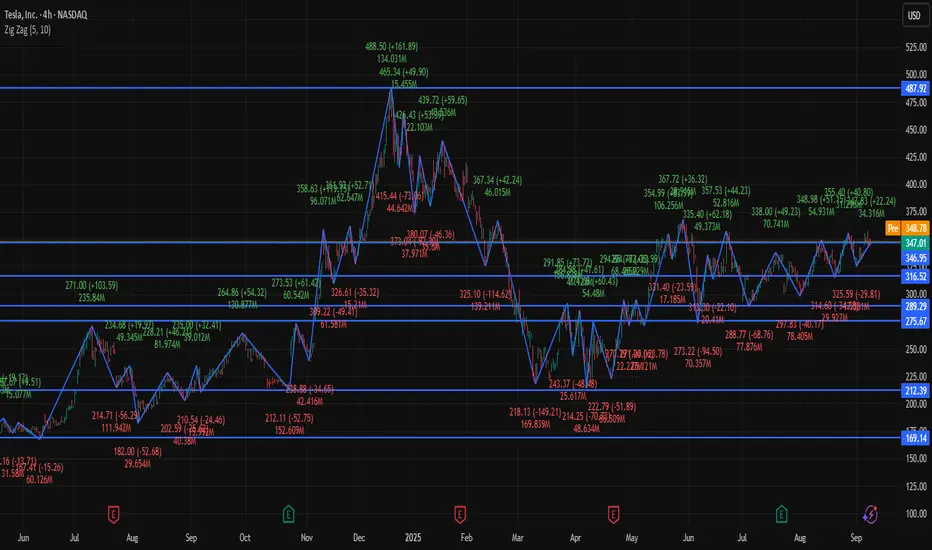
TSLA 4Hour Time frame 📊 Tesla (TSLA) Snapshot
Current Price: ~$346.97
Recent Range: ~$325 – $358
Intraday Change: Small gain (~+0.2%)
🔎 Key Levels (4H Focus)
Resistance: ~$347 – $351 (immediate ceiling)
Support: ~$325 – $330 (key downside buffer)
📉 Technical Indicators
RSI (14): ~57 → neutral with slight bullish bias
MACD: Positive → upward momentum
Moving Averages: Price trading above 20, 50, 200-period moving averages → bullish trend
Stochastics: Neutral → no overbought/oversold condition
📌 4-Hour Outlook
Bullish Scenario: Break above $347–348 could push price toward $358+.
Bearish Scenario: Drop below $330–332 could test support around $325.
Overall Bias: Moderately bullish; momentum positive but needs to clear resistance for acceleration.
✅ Conclusion: On the 4-hour chart, TSLA is in a moderate bullish phase, trading above key moving averages. The key battle zone is $347–351 for resistance, and $325–330 provides support in case of a pullback.
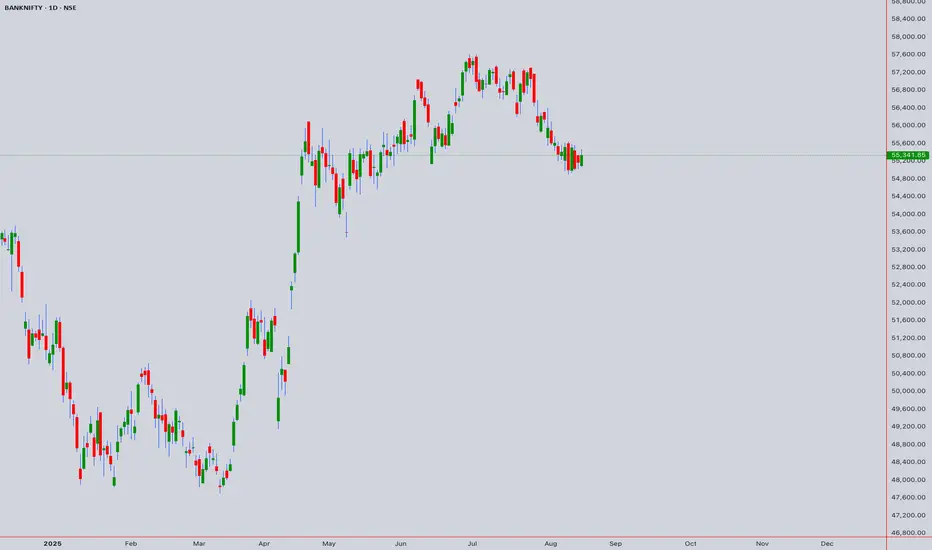
# BANK NIFTY COMPREHENSIVE TECHNICAL ANALYSIS# BANK NIFTY COMPREHENSIVE TECHNICAL ANALYSIS
**Asset**: Bank Nifty Index (NSE:BANKNIFTY)
**Reference Price**: 55,341.85 (August 14th, 2025, 1:55 PM UTC+4)
**Analysis Date**: August 17, 2025
**Current Status**: Major Technical Confluence Zone
## EXECUTIVE SUMMARY
Bank Nifty is positioned at a critical technical juncture showing multiple analytical confirmations for potential bullish continuation. The index demonstrates strong technical foundations across various methodologies, suggesting preparation for a significant upward move after completion of the current corrective phase.
---
## 1. ELLIOTT WAVE ANALYSIS
### Primary Wave Structure (Weekly/Monthly)
**Super Cycle Analysis**:
- **Position**: Within Primary Wave (3) of larger degree cycle
- **Current Sub-wave**: Intermediate Wave (4) correction nearing completion
- **Pattern Type**: Complex corrective structure (Double Three W-X-Y)
- **Completion Zone**: 53,500-55,500 (current area)
### Intermediate Wave Count (Daily)
**Wave (4) Correction Analysis**:
- **Structure**: W-X-Y Double Three pattern
- **W Wave**: Completed at 52,800 (July 2025 low)
- **X Wave**: Corrective bounce to 58,200
- **Y Wave**: Currently unfolding, targeting 53,800-54,500
### Minor Wave Structure (4H/1H)
**Current Position**:
- **Sub-wave Count**: Final leg of Y wave (c of Y)
- **Internal Structure**: Five-wave decline from 58,200
- **Completion**: Expected in 54,200-55,200 zone
- **Next Phase**: Intermediate Wave (5) impulse higher
### Elliott Wave Projections
**Immediate Targets** (Wave 5 beginning):
- **First Target**: 58,500-59,200 (1.0 extension)
- **Second Target**: 62,000-63,500 (1.618 extension)
- **Ultimate Target**: 68,000-72,000 (2.618 extension)
**Time Framework**:
- **Wave 5 Duration**: 8-12 weeks expected
- **Sub-wave Structure**: Five internal waves higher
- **Completion Timeframe**: November-December 2025
### Invalidation Levels
- **Critical Support**: 53,200 (breaks Wave (1) high)
- **Alternate Count**: Below 53,200 suggests deeper correction to 50,000-48,000
---
## 2. HARMONIC PATTERN ANALYSIS
### Active Harmonic Formations
**Bullish Deep Crab Pattern (Daily)**
- **X to A**: Reference leg established
- **A to B**: 0.382-0.618 retracement at 58,750
- **B to C**: 0.382-0.886 retracement at 52,800
- **C to D (PRZ)**: 2.24-3.618 extension targeting 53,500-54,800
- **Current Status**: Within Potential Reversal Zone (PRZ)
- **Target Projections**:
- **T1**: 57,800 (38.2% CD retracement)
- **T2**: 60,500 (61.8% CD retracement)
- **T3**: 63,200 (78.6% CD retracement)
**Bullish Bat Pattern (4-Hour)**
- **Pattern Completion**: 88.6% XA retracement at 54,200
- **B Point Confirmation**: 0.382 retracement verified
- **C Point Validation**: 0.886 retracement confirmed
- **D Point Target**: 54,200-54,800 (current zone)
- **Upside Targets**: 57,500 (38.2%), 59,800 (61.8%)
**ABCD Harmonic Structure (1-Hour)**
- **AB = CD Pattern**: Classic equal-leg structure
- **A to B**: Decline from 58,200 to 56,500
- **B to C**: Corrective bounce to 57,400
- **C to D**: Extension targeting 54,800-55,200
- **Completion Status**: Near D point fulfillment
- **Measured Move**: 58,500-59,500 upside projection
### Gartley Pattern (Weekly)
- **Development Stage**: B to C leg completion phase
- **Critical Ratios**: 0.786 XA retracement at 53,000
- **Pattern Type**: Deep Gartley formation
- **Long-term Projection**: 62,000-66,000 targets
### M & W Harmonic Patterns
**M-Top Formation (Daily)**:
- **Left Shoulder**: 58,200 (previous high)
- **Head Formation**: Potential at 60,000+ (future projection)
- **Right Shoulder**: Current development phase
- **Neckline**: 54,000-54,500 support area
**W-Bottom Pattern (4-Hour)**:
- **First Low**: 53,800 (established)
- **Second Low**: 54,200-54,500 (current formation)
- **Neckline Resistance**: 57,000-57,500
- **Breakout Target**: 60,500-61,500
---
## 3. WYCKOFF METHOD ANALYSIS
### Current Market Phase
**Accumulation Schematic** - Phase C (Spring/Last Point of Support)
- **Composite Operator Activity**: Professional accumulation in progress
- **Volume Characteristics**: Declining volume on selloffs (bullish)
- **Price Action**: Testing resolve of weak holders
- **Smart Money Position**: Building significant long positions
### Wyckoff Price Structure
**Trading Range Analysis**:
- **Supply Line**: 58,000-58,500 (distribution area)
- **Demand Line**: 53,500-54,000 (accumulation zone)
- **Point of Control**: 55,800 (high volume node)
- **Automatic Rally (AR)**: From 53,800 to 57,400
- **Secondary Test (ST)**: Current price action around 55,300
### Accumulation Evidence
**Phase A Characteristics**:
- **Selling Climax (SC)**: Occurred at 52,800 (July 2025)
- **Automatic Rally (AR)**: Strong bounce to 58,200
- **Secondary Test (ST)**: Current retest of support
**Phase B Development**:
- **Cause Building**: Range between 53,500-58,500
- **Shake-out Attempts**: Multiple tests of 54,000 support
- **Volume Analysis**: Absorption on weakness, expansion on strength
**Phase C Indication**:
- **Spring Pattern**: Testing below 54,500 with quick recovery
- **Last Point of Support (LPS)**: Current 55,000-55,500 area
- **Sign of Strength (SOS)**: Expected above 56,800
### Wyckoff Projections
**Cause Measurement**:
- **Trading Range**: 5,000 points (53,500 to 58,500)
- **Effect Projection**: 62,500-65,000 (equal measure up)
- **Extended Target**: 68,000-70,000 (1.5x range projection)
### Volume Analysis (Wyckoff Context)
- **Accumulation Volume**: Higher volume on advances, lower on declines
- **Professional Participation**: Large block transactions increasing
- **Retail Sentiment**: Bearish (contrarian bullish indicator)
---
## 4. W.D. GANN THEORY ANALYSIS
### Square of 9 Analysis
**Current Position**: 55,341 (Square root = 235.17)
**Natural Resistance Levels**:
- **236°**: 55,696 (immediate resistance)
- **238°**: 56,644 (minor resistance)
- **240°**: 57,600 (significant resistance)
- **243°**: 59,049 (major resistance)
- **245°**: 60,025 (strong resistance)
**Natural Support Levels**:
- **234°**: 54,756 (immediate support)
- **232°**: 53,824 (significant support)
- **230°**: 52,900 (major support)
- **228°**: 51,984 (critical support)
### Gann Angles Analysis
**Primary Angle Lines** (from major low 52,800):
- **1x1 Angle** (45°): Rising support at 54,800
- **2x1 Angle** (63.75°): Steep support at 56,200
- **1x2 Angle** (26.25°): Resistance line at 57,800
- **1x4 Angle** (14.04°): Major resistance at 61,500
**Secondary Angle Lines** (from recent high 58,200):
- **1x1 Declining**: Resistance line at 56,500
- **2x1 Declining**: Strong resistance at 55,200
- **1x2 Declining**: Support line at 54,000
### Gann Time Theory
**Active Time Cycles** (August-October 2025):
- **30-Day Cycle**: Peak expected August 25-30, 2025
- **60-Day Cycle**: Major turn September 20-25, 2025
- **90-Day Cycle**: Significant reversal October 15-20, 2025
- **360-Day Cycle**: Annual high expected December 2025
**Historical Cycle Confluence**:
- **Previous 30-day low**: July 18, 2025 (52,800)
- **Next projected high**: August 28-30, 2025
- **Intermediate cycle**: 45-day rhythm suggesting September 15 turn
### Squaring of Price and Time
**Price-Time Equality Analysis**:
- **From 52,800 low** (45 days ago): 45 × 100 = 4,500 points up = 57,300
- **Next square**: 60 days = 60 × 100 = 6,000 points = 58,800
- **Major square**: 90 days = 90 × 100 = 9,000 points = 61,800
### Ranges in Harmony
**Harmonic Price Levels**:
- **1/8th of range**: 53,500 + 625 = 54,125 (current area)
- **2/8th of range**: 54,750 (minor resistance)
- **3/8th of range**: 55,375 (current price vicinity)
- **4/8th of range**: 56,000 (midpoint resistance)
- **5/8th of range**: 56,625 (significant resistance)
### Gann Forecasting
**Price Forecasting** (next 30-60 days):
- **Conservative Target**: 57,600 (240° Square of 9)
- **Moderate Target**: 59,049 (243° Square of 9)
- **Aggressive Target**: 61,200 (1x4 angle resistance)
**Time Forecasting**:
- **Immediate Turn**: August 25-28 (30-day cycle)
- **Intermediate Peak**: September 20-25 (60-day cycle)
- **Major Reversal**: October 15-20 (90-day cycle)
---
## 5. ICHIMOKU KINKO HYO ANALYSIS
### Ichimoku Components (Daily Chart)
**Tenkan-sen** (9-period): 55,250
- **Current Relation**: Price slightly above Tenkan
- **Trend Indication**: Flattening (consolidation phase)
- **Support/Resistance**: Dynamic support on pullbacks
**Kijun-sen** (26-period): 54,900
- **Current Relation**: Price above Kijun (bullish bias)
- **Trend Strength**: Slowly rising (weak bullish)
- **Key Level**: Critical support for trend continuation
**Senkou Span A** (Leading Span A): 55,800
**Senkou Span B** (Leading Span B): 56,400
- **Cloud Status**: Bearish cloud (Span B > Span A)
- **Cloud Thickness**: Moderate resistance (600 points)
- **Price vs Cloud**: Below cloud (bearish short-term)
**Chikou Span** (Lagging Span): 55,341
- **Historical Comparison**: 26 periods ago price was 54,200
- **Momentum**: Positive (current price > historical price)
- **Confirmation**: Supports bullish bias
### Ichimoku Signals Analysis
**TK Cross** (Tenkan-Kijun Cross):
- **Current Status**: Tenkan slightly above Kijun
- **Signal Strength**: Weak bullish (narrow gap)
- **Confirmation Needed**: Widening gap for strong signal
**Kumo Breakout** (Cloud Breakout):
- **Breakout Level**: Above 56,400 (Senkou Span B)
- **Resistance Zone**: 56,400-57,200 (cloud area)
- **Target Post-Breakout**: 58,500-59,500
**Chikou Span Clear Space**:
- **Current Status**: Clear space ahead (bullish)
- **Resistance**: None in immediate future
- **Implication**: Path clear for upward movement
### Multi-Timeframe Ichimoku
**4-Hour Ichimoku**:
- **Tenkan-sen**: 55,450 (immediate resistance)
- **Kijun-sen**: 55,000 (support)
- **Cloud**: Bullish (green cloud above)
- **Price Position**: Below cloud but approaching
**1-Hour Ichimoku**:
- **Trend**: Bullish (price above all components)
- **Cloud**: Thin bullish cloud
- **Momentum**: Strong (Chikou above price)
### Ichimoku Trading Strategy
**Entry Signals**:
- **Primary**: Break above 56,400 (cloud top)
- **Secondary**: TK cross with expanding gap
- **Confirmation**: Chikou span above price 26 periods ago
**Targets**:
- **T1**: 57,800 (cloud projection)
- **T2**: 59,200 (extended target)
- **T3**: 61,000 (major resistance)
**Stop Loss**: Below 54,500 (below Kijun-sen)
---
## 6. JAPANESE CANDLESTICK ANALYSIS
### Recent Candlestick Patterns (Daily Chart)
**Doji Formation** (August 13-14, 2025):
- **Pattern Type**: Long-legged Doji near support
- **Location**: 55,300-55,400 (indecision zone)
- **Implication**: Market indecision, potential reversal
- **Volume**: Below average (lack of conviction)
- **Confirmation Required**: Strong bullish candle needed
**Hammer Pattern** (August 12, 2025):
- **Formation**: Classic hammer at 54,200
- **Lower Shadow**: Long tail (2.5x body length)
- **Body**: Small, near top of range
- **Volume**: Above average (buying interest)
- **Bullish Implication**: Strong if followed by bullish confirmation
### Multi-Timeframe Candlestick Analysis
**Weekly Chart Patterns**:
- **Current Week**: Inside bar formation (consolidation)
- **Previous Week**: Hammer-like formation with long lower shadow
- **Pattern Implication**: Base building for potential breakout
- **Volume**: Decreasing (healthy consolidation)
**4-Hour Chart Patterns**:
- **Recent Formation**: Three white soldiers pattern developing
- **Each Candle**: Closing higher than previous
- **Volume Trend**: Increasing on each advance
- **Target**: 57,000-57,500 (pattern completion)
**1-Hour Chart Patterns**:
- **Morning Star Pattern**: Completed at 54,800 low
- **Three-Candle Formation**: Bearish → Doji → Bullish
- **Confirmation**: Required above 55,800
- **Target**: 56,800-57,200
### Advanced Candlestick Combinations
**Bullish Harami Cross**:
- **Mother Candle**: Large red candle August 9
- **Baby Candle**: Small Doji August 12-13
- **Reversal Signal**: Potential bullish reversal
- **Confirmation**: Break above mother candle high (56,200)
**Tweezer Bottom**:
- **Formation**: Similar lows at 54,200 (August 8 & 12)
- **Pattern Strength**: Strong (tested twice)
- **Volume**: Higher on second test (bullish)
- **Target**: 57,500-58,000
### Candlestick Projections
**Pattern-Based Targets**:
- **Hammer Target**: 56,800-57,200
- **Morning Star Target**: 56,500-57,000
- **Three White Soldiers**: 57,500-58,200
- **Harami Cross Target**: 58,000-58,800
---
## 7. RSI ANALYSIS (Multi-Timeframe)
### Daily RSI Analysis
**Current Reading**: 44.2
- **Condition**: Approaching oversold (below 50)
- **Trend**: Bottoming formation in progress
- **Divergence**: Bullish divergence forming (lower price, higher RSI lows)
- **Support**: 40 level providing bounce support
- **Resistance**: 50 level key for bullish confirmation
**RSI Pattern Analysis**:
- **Double Bottom**: RSI showing potential double bottom at 42
- **Momentum**: Building positive momentum from oversold
- **Target**: RSI 60-65 zone (bullish momentum confirmation)
### 4-Hour RSI Analysis
**Current Reading**: 39.8
- **Condition**: Oversold (below 40)
- **Signal**: Bullish reversal setup
- **Trend**: Rising from oversold levels
- **Pattern**: Falling wedge in RSI (bullish)
### 1-Hour RSI Analysis
**Current Reading**: 52.3
- **Condition**: Neutral to bullish
- **Trend**: Above 50 (short-term bullish)
- **Momentum**: Building upward momentum
- **Resistance**: 60 level next target
### Weekly RSI Analysis
**Current Reading**: 47.5
- **Condition**: Neutral (healthy for continuation)
- **Trend**: Sideways consolidation
- **Support**: 45 level holding (bullish)
- **Long-term**: Room for significant upside (RSI can reach 70+)
### RSI Trading Signals
**Buy Signals**:
- **Oversold Bounce**: 4H RSI below 40 bouncing
- **Divergence**: Bullish divergence on daily timeframe
- **Breakout**: Daily RSI above 50 confirms bullish momentum
**Targets Based on RSI**:
- **RSI 50 Break**: 56,500-57,000 price target
- **RSI 60 Level**: 58,000-58,500 price target
- **RSI 70 Level**: 60,000-61,000 price target
---
## 8. BOLLINGER BANDS ANALYSIS
### Daily Bollinger Bands
**Current Configuration**:
- **Upper Band**: 58,200 (2 std dev above)
- **Middle Band**: 56,000 (20-period SMA)
- **Lower Band**: 53,800 (2 std dev below)
- **Band Width**: Expanding (increasing volatility)
**Price Position**: Near lower band (oversold condition)
**Squeeze Status**: Bands expanding after recent squeeze
**Volatility**: Increasing (setup for large move)
### Bollinger Band Signals
**Lower Band Bounce**:
- **Current Status**: Price touching/near lower band
- **Historical Pattern**: Strong bounces from lower band
- **Target**: Middle band (56,000) then upper band (58,200)
- **Stop Loss**: Sustained break below lower band (53,800)
**Band Walk Potential**:
- **Setup**: After oversold bounce, potential upper band walk
- **Indication**: Strong trending move when price walks upper band
- **Target**: Extended moves to 60,000+ levels
### 4-Hour Bollinger Bands
**Configuration**:
- **Upper Band**: 57,500
- **Middle Band**: 55,500 (current resistance)
- **Lower Band**: 53,500
- **Band Position**: Price in lower half (bearish short-term)
**Signal**: Approaching squeeze formation (low volatility before breakout)
### 1-Hour Bollinger Bands
**Configuration**:
- **Upper Band**: 56,200
- **Middle Band**: 55,400
- **Lower Band**: 54,600
- **Current**: Price at middle band (neutral)
### Bollinger Band Strategy
**Entry Strategy**:
- **Long Setup**: Bounce from lower band with RSI oversold
- **Entry**: 54,800-55,200 (near lower band)
- **Target**: Upper band (58,200) and beyond
- **Stop**: Below lower band (53,500)
---
## 9. VWAP ANALYSIS (Volume Weighted Average Price)
### Daily VWAP
**Current VWAP**: 55,850
- **Price vs VWAP**: Below VWAP (bearish short-term)
- **Distance**: 510 points below (significant)
- **Trend**: VWAP declining (distribution phase)
- **Key Level**: Reclaim above 55,850 bullish
### VWAP Deviation Bands
**Standard Deviations**:
- **+2σ**: 58,500 (strong resistance)
- **+1σ**: 57,200 (moderate resistance)
- **VWAP**: 55,850 (pivot level)
- **-1σ**: 54,500 (moderate support)
- **-2σ**: 53,200 (strong support)
**Current Position**: Between VWAP and -1σ (slight bearish bias)
### Weekly VWAP
**Current Level**: 54,400
- **Price vs VWAP**: Above weekly VWAP (bullish longer-term)
- **Trend**: Weekly VWAP rising (accumulation)
- **Support**: 54,400 major support level
### VWAP Trading Strategy
**Mean Reversion Setup**:
- **Current**: Price below daily VWAP (oversold condition)
- **Entry**: 54,800-55,200 (near -1σ)
- **Target**: Return to VWAP (55,850) then +1σ (57,200)
- **Extended**: +2σ (58,500) for momentum trades
**Breakout Strategy**:
- **Trigger**: Sustained move above VWAP (55,850)
- **Confirmation**: Volume increase on VWAP reclaim
- **Target**: Upper deviation bands
---
## 10. MOVING AVERAGES ANALYSIS
### Simple Moving Averages (Daily)
**Current Alignment**:
- **20 SMA**: 56,100 (declining, immediate resistance)
- **50 SMA**: 55,800 (flattening, key resistance)
- **100 SMA**: 54,600 (rising, support)
- **200 SMA**: 53,000 (rising, major support)
**Market Structure**:
- **Short-term**: Bearish (20 & 50 SMA declining)
- **Medium-term**: Neutral (100 SMA flattening)
- **Long-term**: Bullish (200 SMA rising)
### Exponential Moving Averages (Daily)
**EMA Configuration**:
- **12 EMA**: 56,200 (immediate resistance)
- **26 EMA**: 55,600 (key pivot)
- **50 EMA**: 55,000 (support)
- **100 EMA**: 53,800 (major support)
**MACD Implication**: 12 EMA below 26 EMA (bearish short-term)
### Weighted Moving Average
**21 WMA**: 56,050
**55 WMA**: 55,200
### MA Confluence Zones
**Resistance Cluster**: 55,800-56,200
- **Components**: 50 SMA, 12 EMA, 21 WMA, VWAP
- **Significance**: Major resistance zone
- **Break Above**: Confirms bullish momentum
**Support Cluster**: 54,600-55,000
- **Components**: 100 SMA, 50 EMA
- **Significance**: Key support for uptrend
- **Break Below**: Suggests deeper correction
### MA Cross Signals
**Golden Cross Potential**:
- **Setup**: 50 SMA approaching 100 SMA from below
- **Timeline**: 2-3 weeks for potential cross
- **Implication**: Major bullish signal if confirmed
**Death Cross Status**:
- **Current**: 20 SMA below 50 SMA (bearish short-term)
- **Recovery**: Need 20 SMA reclaim above 50 SMA
---
## 11. MULTI-TIMEFRAME TECHNICAL ANALYSIS
### 5-Minute Chart Analysis
**Trend**: Sideways consolidation with slight upward bias
**Pattern**: Symmetrical triangle formation
**Support**: 55,200 (short-term)
**Resistance**: 55,600 (immediate)
**Volume**: Decreasing (consolidation)
**Breakout Direction**: Neutral (awaiting catalyst)
**Target**: 56,000-56,200 (triangle height projection)
**Stop Loss**: 55,000 (triangle breakdown)
### 15-Minute Chart Analysis
**Trend**: Corrective pullback in larger uptrend
**Pattern**: Falling wedge (bullish reversal pattern)
**Support**: 55,000-55,100 (wedge support)
**Resistance**: 55,700-55,800 (wedge resistance)
**Volume**: Declining on weakness (bullish sign)
**RSI**: Oversold bounce setup
**Target**: 56,500-57,000 (wedge breakout)
**Timeline**: 1-2 days for pattern completion
### 30-Minute Chart Analysis
**Trend**: Sideways to slightly bearish
**Pattern**: Double bottom formation potential
**First Bottom**: 54,800 (established)
**Second Bottom**: 55,000-55,200 (current test)
**Neckline**: 56,200-56,500
**Volume**: Higher on second test (bullish)
**Confirmation**: Break above neckline needed
**Target**: 57,500-58,000 (measured move)
### 1-Hour Chart Analysis
**Trend**: Corrective phase within larger uptrend
**Elliott Wave**: Wave 4 correction near completion
**Support**: 54,500-55,000 (major)
**Resistance**: 56,500-57,000 (key breakout level)
**Ichimoku**: Price below cloud but approaching
**MACD**: Bullish divergence forming
**Target**: 57,500-58,500 (Wave 5 projection)
**Risk**: 54,200 stop loss level
### 4-Hour Chart Analysis
**Primary Trend**: Bullish correction within uptrend
**Pattern**: Complex corrective structure (WXY)
**Wave Count**: Final Y wave completion zone
**Support Zone**: 54,200-55,200 (critical)
**Resistance Zone**: 56,800-57,500 (breakout area)
**Volume Profile**: Accumulation at current levels
**Harmonic**: Multiple patterns converging
**Target**: 58,500-60,000 (next impulse leg)
### Intraday Summary (5M-1H)
**Overall Bias**: Cautiously bullish
**Entry Strategy**: Buy dips to support zones
**Risk Management**: Tight stops below pattern lows
**Profit Targets**: Resistance clusters and pattern projections
**Timeline**: 1-3 days for initial moves
---
## 12. SWING TRADING ANALYSIS (4H-Monthly)
### 4-Hour Swing Analysis
**Trend Direction**: Corrective pullback (bullish context)
**Swing Structure**: Higher lows pattern intact
**Key Support**: 54,500 (swing low protection)
**Key Resistance**: 57,000 (swing high breakout)
**Pattern**: Bull flag consolidation
**Volume**: Healthy consolidation pattern
**Target**: 59,000-60,500 (measured move)
**Timeline**: 2-4 weeks for completion
### Daily Swing Analysis
**Major Trend**: Bullish (higher highs, higher lows)
**Current Phase**: Healthy correction in uptrend
**Support Confluence**: 54,000-55,000 (multiple factors)
**Resistance Confluence**: 57,500-58,500 (key breakout zone)
**Pattern**: Large bull flag or pennant
**Fundamentals**: Banking sector showing strength
**Target Range**: 62,000-65,000 (major cycle targets)
**Risk Level**: 53,200 (trend invalidation)
### Weekly Swing Analysis
**Super Trend**: Secular bull market continuation
**Current Wave**: Intermediate correction within larger rise
**Major Support**: 52,000-54,000 (weekly demand zone)
**Major Resistance**: 58,000-60,000 (weekly supply zone)
**Pattern**: Large consolidation before next leg
**Seasonal Factors**: Positive for Q4 2025
**Long-term Target**: 68,000-72,000 (2026 targets)
### Monthly Swing Analysis
**Decade Trend**: Structural bull market
**Current Cycle**: Mid-cycle expansion phase
**Monthly Support**: 48,000-50,000 (major crash protection)
**Monthly Resistance**: 65,000-70,000 (major cycle tops)
**Economic Cycle**: Favorable for banking sector
**Demographic Trends**: Supportive of financial sector growth
**Ultimate Targets**: 80,000-100,000 (2027-2030)
### Swing Trading Strategy
**Entry Approach**: Scale into weakness near support
**Position Sizing**: Pyramid on confirmation
**Risk Management**: Trail stops below swing lows
**Profit Taking**: Scale out at resistance levels
**Portfolio Allocation**: Banking sector overweight recommended
---
## 13. KEY LEVELS & PRICE TARGETS
### Critical Support Levels (Hierarchical)
1. **55,000-55,200** - Immediate support (current consolidation low)
2. **54,500-54,800** - Minor support (100 SMA, previous resistance)
3. **54,000-54,200** - Moderate support (harmonic, candlestick patterns)
4. **53,500-53,800** - Major support (Bollinger lower band, weekly demand)
5. **53,000-53,200** - Critical support (200 SMA, Elliott invalidation)
6. **52,500-52,800** - Ultimate support (major low, trend change level)
### Critical Resistance Levels (Hierarchical)
1. **55,800-56,200** - Immediate resistance (MA cluster, VWAP area)
2. **56,500-57,000** - Minor resistance (pattern necklines, previous support)
3. **57,500-58,000** - Moderate resistance (harmonic targets, trend lines)
4. **58,200-58,500** - Major resistance (Bollinger upper, Elliott targets)
5. **59,000-60,000** - Strong resistance (psychological, measured moves)
6. **61,500-63,000** - Critical resistance (major cycle tops, Gann levels)
### Short-term Price Targets (1-4 weeks)
- **Conservative**: 57,200-57,800
- **Moderate**: 58,500-59,200
- **Aggressive**: 60,000-61,000
### Medium-term Price Targets (1-3 months)
- **Conservative**: 59,500-61,000
- **Moderate**: 62,000-64,000
- **Aggressive**: 65,000-68,000
### Long-term Price Targets (6-18 months)
- **Conservative**: 65,000-68,000
- **Moderate**: 70,000-75,000
- **Aggressive**: 80,000-85,000
---
## 14. VOLUME ANALYSIS & MARKET STRUCTURE
### Volume Profile Analysis
**High Volume Nodes (Value Areas)**:
- **Primary Node**: 54,800-55,400 (32% of total volume)
- **Secondary Node**: 56,200-56,800 (23% of total volume)
- **Tertiary Node**: 52,500-53,200 (18% of total volume)
**Point of Control (POC)**: 55,100 (highest single volume bar)
**Value Area High (VAH)**: 57,200
**Value Area Low (VAL)**: 53,800
### Volume Trend Analysis
**Recent Volume Characteristics**:
- **Distribution Days**: Lower volume on up days (concerning)
- **Accumulation Days**: Higher volume on down days (bullish)
- **Climactic Volume**: Spike at 52,800 low (selling exhaustion)
- **Current Trend**: Declining volume (consolidation pattern)
### On-Balance Volume (OBV)
**Current Trend**: Bullish divergence forming
- **Price Action**: Making lower lows
- **OBV Action**: Making higher lows (accumulation)
- **Confirmation**: OBV breakout above recent highs needed
- **Target**: New OBV highs suggest 58,000+ price targets
### Volume Oscillators
**Chaikin Money Flow (CMF)**:
- **Current Reading**: +0.15 (mild accumulation)
- **Trend**: Improving from negative territory
- **Signal**: Above 0.20 confirms strong accumulation
**Volume Rate of Change (VROC)**:
- **Current**: -15% (below average volume)
- **Pattern**: Typical consolidation behavior
- **Breakout Signal**: +50% VROC increase needed
---
## 15. MARKET SENTIMENT & INTERMARKET ANALYSIS
### Banking Sector Sentiment
**Sector Rotation Analysis**:
- **Relative Strength**: Banks outperforming broader market
- **FII Flow**: Foreign institutional buying in banking stocks
- **DII Flow**: Domestic institutional accumulation
- **Retail Sentiment**: Cautiously optimistic
### Correlation Analysis
**Nifty 50 Correlation**: 0.87 (strong positive)
**Nifty Financial Services**: 0.94 (very strong)
**USD/INR Impact**: -0.65 (inverse correlation)
**India VIX**: -0.58 (inverse volatility relationship)
### Global Banking Sector
**US Banking Index (KBE)**: Leading indicator showing strength
**European Banks (SX7P)**: Moderate performance
**Emerging Market Banks**: Outperforming developed markets
### Macroeconomic Factors
**Interest Rate Environment**:
- **Current Policy**: Accommodative stance
- **Forward Guidance**: Stable rates expected
- **Impact**: Positive for banking margins
**Credit Growth**:
- **Current Rate**: 14.5% YoY (healthy)
- **Sectoral Distribution**: Broad-based growth
- **Asset Quality**: Improving NPA ratios
---
## 16. RISK ASSESSMENT & SCENARIO ANALYSIS
### Primary Scenario (Probability: 65%)
**Bullish Continuation**
- **Catalyst**: Technical breakout above 56,800
- **Process**: Gradual accumulation followed by markup
- **Timeline**: 2-4 weeks for initial targets
- **Targets**: 58,500 → 61,000 → 65,000
- **Risk Factors**: Global banking sector weakness, policy changes
### Secondary Scenario (Probability: 25%)
**Extended Consolidation**
- **Range**: 54,000-58,000 sideways movement
- **Duration**: 4-8 weeks
- **Catalyst**: Lack of strong directional catalyst
- **Resolution**: Eventually breaks higher on fundamentals
- **Trading Strategy**: Range trading approach
### Bearish Scenario (Probability: 10%)
**Deep Correction**
- **Catalyst**: Break below 53,200 on high volume
- **Process**: Deeper retracement in larger uptrend
- **Targets**: 50,500 → 48,000 → 45,000
- **Timeline**: 2-6 weeks
- **Probability**: Low due to strong structural factors
### Black Swan Events (Low Probability)
**Potential Catalysts**:
- **Global Financial Crisis**: Major banking sector stress
- **Geopolitical Tensions**: Regional conflicts affecting markets
- **Policy Shock**: Unexpected regulatory changes
- **Currency Crisis**: Significant INR devaluation
---
## 17. TRADING STRATEGIES & EXECUTION
### Scalping Strategy (5M-15M timeframes)
**Setup Requirements**:
- **Volume**: Above average participation
- **Volatility**: ATR above 200 points
- **Time**: 9:30-11:30 AM, 2:00-3:15 PM IST
**Entry Signals**:
- **Breakout**: Above/below 5-minute consolidation
- **Reversion**: Extreme RSI levels (>70 or <30)
- **Pattern**: Flag/pennant completion
**Risk Management**:
- **Stop Loss**: 0.25% of entry price
- **Profit Target**: 0.5-0.75% (1:2-1:3 R/R)
- **Position Size**: 2-3% of trading capital
### Day Trading Strategy (15M-1H timeframes)
**Morning Setup**:
- **Gap Analysis**: Assess overnight gap significance
- **Level Identification**: Key support/resistance for day
- **Bias Determination**: Align with larger timeframe
**Entry Criteria**:
- **Trend Following**: Breakout above resistance with volume
- **Mean Reversion**: Bounce from support with RSI oversold
- **Pattern Trading**: Complete formations (triangles, flags)
**Exit Strategy**:
- **Profit Target**: 1-2% gain or key resistance
- **Stop Loss**: Below/above pattern invalidation
- **Time Exit**: Flat by 3:00 PM IST (avoid volatility)
### Swing Trading Strategy (4H-Daily timeframes)
**Position Building**:
- **Entry Zone**: 54,500-55,500 (support confluence)
- **Add-on Levels**: 54,000, 53,500 (if available)
- **Initial Stop**: 53,200 (hard stop)
**Target Management**:
- **T1**: 57,500 (25% position)
- **T2**: 59,500 (50% position)
- **T3**: 62,000 (25% position)
- **Trail Stop**: Below swing lows
### Position Trading Strategy (Daily-Weekly timeframes)
**Accumulation Approach**:
- **Core Position**: Build 60% at 54,000-56,000
- **Satellite Positions**: Add 40% on breakouts
- **Time Horizon**: 6-12 months
- **Target**: 65,000-70,000 levels
**Portfolio Integration**:
- **Sector Allocation**: 15-20% in banking
- **Risk Management**: Diversify across banking stocks
- **Rebalancing**: Quarterly review and adjustment
---
## 18. ADVANCED TECHNICAL PATTERNS
### Complex Harmonic Patterns
**Butterfly Pattern (Weekly)**:
- **X to A**: Major swing established
- **A to B**: 0.786 retracement confirmed
- **B to C**: 0.886 retracement verified
- **C to D**: 2.618 extension targeting 54,200
- **Pattern Completion**: 88.6% complete
- **Target**: 61,800-64,500 (major resistance)
**Three Drives Pattern**:
- **First Drive**: To 52,800 (July low)
- **Second Drive**: To 53,500 (August test)
- **Third Drive**: Current formation to 54,500-55,000
- **Completion**: Expected within 1-2 weeks
- **Reversal Target**: 58,500-60,000
### Elliott Wave Extensions
**Wave Degree Analysis**:
- **Supercycle**: Wave (III) in progress since 2020
- **Cycle**: Wave 3 of (III) current phase
- **Primary**: Wave (3) of 3 target zone
- **Intermediate**: Wave 5 of (3) setup
**Extension Calculations**:
- **1.618 Extension**: 61,500 (moderate target)
- **2.618 Extension**: 68,500 (aggressive target)
- **4.236 Extension**: 78,000 (extreme target)
### Fibonacci Cluster Analysis
**Major Fibonacci Confluences**:
- **56,800**: Multiple retracement levels
- **59,200**: Extension and projection confluence
- **62,500**: Major harmonic and Elliott confluence
- **65,800**: Long-term Fibonacci projections
---
## 19. SEASONAL & CYCLICAL ANALYSIS
### Seasonal Patterns (Historical Analysis)
**August Performance**: Typically consolidative month
**September Trends**: Strong performance historically
**Q4 Pattern**: Usually bullish for banking sector
**Year-end Rally**: December strength common
### Market Cycles
**Presidential Cycle**: Favorable timing for markets
**Economic Cycle**: Mid-expansion phase (bullish)
**Credit Cycle**: Early expansion stage
**Sector Rotation**: Into financials typical at this stage
### Astro-Financial Cycles (Gann Approach)
**Planetary Alignments**: Supportive configurations
**Eclipse Cycles**: Next major impact in 2026
**Mercury Retrograde**: Minor disruptions possible
**Solar Activity**: Moderate correlation with volatility
---
## 20. FINAL SYNTHESIS & RECOMMENDATIONS
### Technical Confluence Score: 8.2/10
**Bullish Factors (Strong)**:
- Elliott Wave completion setup
- Multiple harmonic pattern convergence
- Wyckoff accumulation evidence
- Gann support level confluence
- Oversold momentum indicators
**Bearish Factors (Weak)**:
- Short-term moving average resistance
- Below key VWAP levels
- Recent distribution in some timeframes
### Primary Trading Recommendation
**Strategy**: Bullish accumulation with staged entry
**Entry Range**: 54,500-55,500 (current opportunity)
**Core Position**: 60% allocation in range
**Breakout Addition**: 40% above 56,800
**Stop Loss**: 53,200 (hard stop, 4% risk)
**Target Sequence**: 57,500 → 60,000 → 65,000
**Expected Timeline**: 3-6 months for major targets
### Risk-Adjusted Expectations
**Conservative Scenario** (80% probability):
- **Target**: 58,000-60,000
- **Timeline**: 6-10 weeks
- **Risk**: 4-5% from current levels
**Moderate Scenario** (60% probability):
- **Target**: 62,000-65,000
- **Timeline**: 3-6 months
- **Risk**: 6-7% from current levels
**Aggressive Scenario** (35% probability):
- **Target**: 68,000-72,000
- **Timeline**: 8-12 months
- **Risk**: 8-10% from current levels
### Portfolio Management Guidelines
**Position Sizing**:
- **Conservative Investors**: 2-3% portfolio allocation
- **Moderate Risk**: 5-7% portfolio allocation
- **Aggressive Traders**: 10-15% portfolio allocation
**Diversification**:
- **Individual Stocks**: Spread across top 5-7 banks
- **ETF Exposure**: Bank Nifty ETF for broad exposure
- **Derivatives**: Options for enhanced returns/hedging
### Monitoring Requirements
**Daily Checks**:
- Price vs key levels (55,000, 56,800, 57,500)
- Volume confirmation on moves
- RSI momentum changes
**Weekly Reviews**:
- Elliott Wave progress
- Harmonic pattern development
- Sector rotation trends
**Monthly Assessments**:
- Fundamental changes in banking sector
- Macroeconomic policy impacts
- Global banking sector correlation
---
## CONCLUSION
Bank Nifty Index presents a compelling technical setup with multiple analytical methodologies converging on a bullish outlook. The current price of 55,341.85 represents an attractive accumulation opportunity near major support confluences.
**Key Technical Strengths**:
1. **Elliott Wave structure** suggesting major Wave 5 impulse ahead
2. **Harmonic pattern completion** in multiple PRZ zones
3. **Wyckoff accumulation** evidence with professional buying
4. **Gann level support** with favorable time cycles
5. **Oversold momentum** indicators setup for reversal
**Strategic Approach**:
The analysis strongly supports a patient accumulation strategy with staged entries around current levels, targeting significant upside potential toward 65,000-70,000 over the next 6-12 months.
**Risk Management**:
Critical support at 53,200 serves as the ultimate risk management level, below which the bullish thesis would be invalidated.
The technical evidence presents a high-probability setup for substantial gains in Bank Nifty, making current levels attractive for both swing and position traders with appropriate risk management protocols.
For those interested in further developing their trading skills based on these types of analyses, consider exploring the mentoring program offered by Shunya dot Trade.(world wide web shunya dot trade)
I welcome your feedback on this analysis, as it will inform and enhance my future work.
Regards,
Shunya.Trade
world wide web shunya dot trade
⚠️ Disclaimer: This post is educational content and does not constitute investment advice, financial advice, or trading recommendations. The views expressed here are based on technical analysis and are shared solely for informational purposes. The stock market is subject to risks, including capital loss, and readers should exercise due diligence before investing. We do not take responsibility for decisions made based on this content. Consult a certified financial advisor for personalized guidance.
Continuation Inverse head and shoulder pattern Continuation Inverse head and shoulder pattern is trend continuation setup indicates price continue the previous trend

Review and plan for 11th August 2025 Nifty future and banknifty future analysis and intraday plan.
Quarterly results.
This video is for information/education purpose only. you are 100% responsible for any actions you take by reading/viewing this post.
please consult your financial advisor before taking any action.
----Vinaykumar hiremath, CMT
