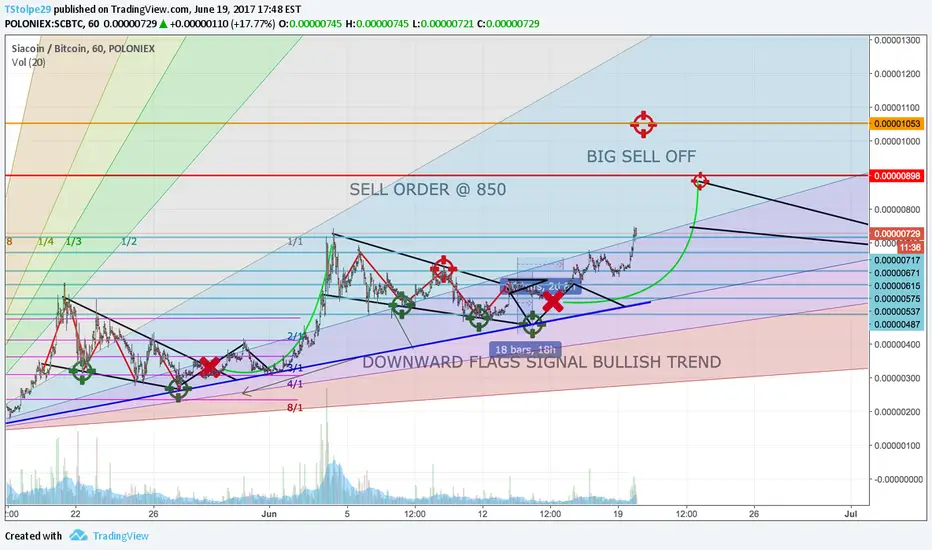
SC: Possible drop incoming, moon afterwards.SC has been getting a lot of positive news recently (ride the trend guys, the news surrounding SC is very positive). It is definitely a long term hold. The project itself is genius - if you haven't invested in SC yet i'd recommend to do so and hold.
As for the chart - I think that history will repeat itself and we will now see a drop until it reaches the bottom (indicated as buy zone) and it will go up again.
SC

News about Obelisk are coming soon.The first ASIC built for Sia mining. Let's see what it holds.
Analysis based on different timeframes (1/5/30min, 1/4h, 1D)

Breakout or no Breakout: That is up to SC!Analysis based on structure 1/5/30min. Shoulder maybe touched and move could be retraced. If it crosses the ellipsis breakout may appear.
Stay green, or stay calmed!


Siacoin (reposted analysis with current candlesReposting my chart analysis because the old one isnt seeming to update anymore

Sia SCBTC - It's Cup & Handles All the Way Down (or...UP)Looks like the handle from my previous idea is its own smaller Cup & Handle. That makes 3 nested C&H's so far lol. This thing wants to go up.

Sia SCBTC - Slightly Shorter Term TargetsThis is related to my other idea:
I zoomed in so we can see the target area for the more immediate future.
Looks like we've got a cup & handle (or inverse head & shoulders, both work in this case).
It might want to extend past the target and hit one or both of the previous peaks (I labelled them on the chart) so I drew a wider target area.
Of course I believe it will ultimately blow past all of these targets and hit at least the next fibonacci level around .00000905, but thought I'd include this if you want a shorter term goal.


SC/BTC Possible breakout in a couple of daysPossible break out by tomorrow, always set stoplosses around 10% (my preference)

Long SC GODMODE 1hrGod mode indicating SC has reached what is probably the last turning point before making a large move higher.
I expect the trend to shift to up again based on god mode analysis but I don't know how high... What I do know is that this is good entry point for anyone who thinks SC will begin it move to the 1200 sat area as the trade should play out rather fast. Time will tell. Good luck.

Buy below 500 satLooking at Siacoin, i believe we are heading for a new wave in the next few days. I recommend buying if the prize drops below 500.

Sia SCBTC - All Aboard The Sia Train. Destination, Next Fib LineLots of things pointing to the .00000900 area as the next target.
We've got a channel, cup & handle , bull flag , and all the targets meet at the next fibonacci line.
I'm as confident in this one as I get. I'm already holding so I'm not looking for any particular breakout point, but I'd say now is as good a time as any if you're looking to get in. There's even a mini cup & handle breaking out right now on shorter timeframes.
Even if it doesn't work out for some reason, Sia is still a great hold - so I don't feel shy about highly recommending a buy right now.
Good luck!

Siacoin: Apollo 13 or 11Siacoin is facing a difficult future. There is a descending triangle which suggests a breakdown. On the other hand, the graph has been making double bottoms which suggest that it wont go under the support level at 470 and instead go up. stay tuned the next couple of days to see if it is a buy or not.

#SC update: Creat a new bottom - $SCNotice that you must be buy SC when he break out (creat a bottom and break out pink colour line). Target 1st: 820 - 840, target 2nd: 1100 - 1200, target 3rd: 1600 - 1800

SC - Siacoin chart that shows it's at an uptrend still.I've had this chart for a while now, shared it with my friends well over a week ago maybe longer. I showed it to another friend today and my buddy Stevus saw it and said I should post it. So here you go, now get out of my pool.
Green areas are were I bought and the top line is where I sold. Tada!

SC ready for a pumpBought in at 330 and waiting for this triangle to break out to take SC to new highs. TP between 900-1200.

SC update (answer your question (followers) - Elliot creatNow SC break out PT, so mean it will creat uptrend. You can buy or sell with elliott waves i was post here. Thanks for follow me. Love you

SC on the move. 658-700-900-1200SC BTC is looking good after the breakout
res:
658-700-900-1200
Thoughts?

