SCRT/USDT 3D — Falling Wedge Signals Potential Trend ReversalOn the 3D timeframe, SCRT/USDT is still moving within a medium-to-long-term downtrend after topping near the 0.82 USDT area. Current price action is trading near historical low levels, which often act as important technical reaction zones.
Volatility is gradually decreasing, indicating a compression phase that usually precedes a significant directional move.
---
Pattern Explanation
Price action is forming a Falling Wedge (Descending Wedge) pattern:
Series of lower highs and lower lows
The upper resistance line declines more steeply than the lower support line
This pattern is commonly recognized as a bullish reversal structure when a valid upside breakout occurs
However, as long as price remains inside the wedge, the prevailing bearish structure is still intact.
---
Key Levels
Resistance Zones:
0.157 – 0.165 USDT → dynamic wedge resistance
0.200 – 0.226 USDT → strong horizontal resistance
0.383 USDT → major resistance / previous distribution area
0.550 – 0.740 USDT → extended targets if a strong trend reversal unfolds
Support Zones:
0.105 – 0.096 USDT → major support & demand zone
A breakdown below 0.096 USDT would open further downside risk
---
Bullish Scenario
The bullish scenario becomes valid if:
1. Price breaks and closes above the upper wedge on the 3D timeframe
2. Breakout is confirmed by increasing volume
3. Price successfully holds above 0.157 – 0.165 USDT
Upside Targets:
Target 1: 0.200 – 0.226 USDT
Target 2: 0.383 USDT
Extended target (strong reversal): 0.55 – 0.74 USDT
This structure supports a medium-term trend reversal if the breakout is confirmed.
---
Bearish Scenario
The bearish scenario remains dominant if:
1. Price fails to break the upper wedge
2. Price breaks down below the 0.096 USDT support
3. A 3D candle closes below the major demand zone
Consequences:
Continuation of the downtrend
Potential move toward lower liquidity zones
Falling wedge fails as a reversal pattern
---
Conclusion
SCRT/USDT is currently at a critical decision zone. The Falling Wedge offers a potential bullish reversal, but confirmation is essential. The safest approach is to wait for a confirmed 3D candle close rather than anticipating the breakout prematurely.
A major move is approaching, and direction will be determined by price reaction at the upper wedge.
#SCRT #SCRTUSDT #CryptoAnalysis
#FallingWedge #Downtrend #PotentialReversal
#AltcoinAnalysis #SupportResistance #PriceAction #MarketStructure
Scrtusdtidea

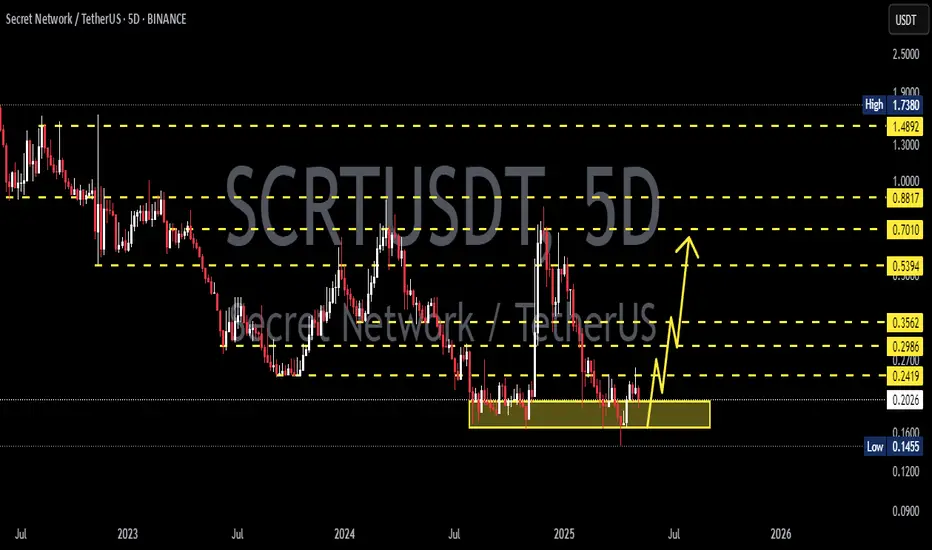
SCRTUSDT 5D Analysis SCRT ~ 5D Analysis
#SCRT Buy back from here with a short term target of at least 20%+. This is the lowest support for now.
SCRTUSDT 5DSCRT ~ 5D Analysis
#SCRT High risk trade. Buy gradually from here with a short -term target of at least 15%+. This is the lowest support for now.

SCRTUSDT 5DSCRT ~ 5D Analysis
#SCRT If you still have a Conviction on this Coin, buy gradually from here with a minimum target of 20%+

SCRT Help MeIn this daily chart projection of Secret (SCRT) USDT, the strongest resistance level is expected above the 1.2250 price mark. Avoid entering with leverage, as the Binance chart shows excessive manipulation compared to other exchanges.
My strategy is to exit this token at that resistance level and re-enter at a lower price since it holds significant potential.
If anyone follows this currency, I would appreciate your opinions. Thank you all for the trust shown in my projections.
Please note: My projections are not intended for individuals under the age of 18.
Efe_Efe.

SCRTUSDT.1DOn the daily SCRT/USDT chart, here's my technical analysis:
Zig Zag Indicator: The zig zag pattern illustrates the asset's volatility with sharp upward and downward movements. The current pattern indicates a bullish movement has occurred after a prolonged downtrend.
Resistance Levels (R1 and R2): The chart indicates two key resistance levels at approximately 0.9279 USDT (R1) and 1.059 USDT (R2). These are levels where the price previously encountered selling pressure.
Support Levels (S1 and S2): Support is noted at 0.6086 USDT (S1) and stronger historical support at 0.4521 USDT (S2). These are the levels where buyers have stepped in previously, offering potential bounce points if the price were to decline.
Moving Average Convergence Divergence (MACD): The MACD line is above the signal line and the histogram bars are positive, suggesting bullish momentum. However, the diminishing height of the histogram bars could imply that the bullish momentum is waning.
Relative Strength Index (RSI): The RSI is around 70.49, hovering at the edge of the overbought territory. This can sometimes predict a forthcoming price pullback or consolidation.
Conclusion:
Given the strong recent upward move and the RSI at overbought levels, I'd be cautious about initiating new long positions at this point due to the potential for a reversal or consolidation. Instead, I might consider taking profits if I were currently in a long position, especially as the price approaches the first resistance level (R1). If I were looking for entry points, I'd watch for a potential retracement toward support level S1, which might provide a more favorable risk-reward ratio.
However, I must keep in mind that overbought conditions can sustain in a strong bull market, so I'd also be prepared for the possibility of the price breaking through R1. In such a case, I'd look for increased volume and a strong MACD as confirmation before considering further long positions, potentially targeting R2. I would also remain vigilant for any bearish signals from the MACD or RSI, which may prompt me to reassess my position. Technical analysis is one tool among many, and it's vital to stay informed about broader market trends and updates that could impact price action.

Can Secret do it?Hello everyone! I wrote about this coin a long time ago, but my forecast didn't come true, and after a prolonged sideways movement, the coin started to decline in price.
What do we have now? The asset is currently at a local low, and yesterday it attempted to break the global downtrend line with an upward impulse movement. However, the coin failed to stabilize above it.
Scenario for growth.
If the coin manages to stabilize above it nevertheless, we can expect an almost 95% increase.
I won't consider further upward movement towards important Fibonacci levels for now.
This is not financial advice, and everything you do is at your own risk.

SCRTUSDT Buy Setup!SCRTUSDT Technical analysis update
Buy zone : Below $0.370
Stop loss : $0.342
Take Profit 1 : $0.395
Take Profit 2 : $0.435
Take Profit 3 : $0.490
spot trade.
Thanks
Hexa

SCRT/USD 4HSecret/USD has broken the rising channel to which it was respecting , also a break of structure has happened , we can short here now for a small trade and aim for 0.632 level before it reverse.

SCRTUSDT Idea SCRTUSDT - SCRTUSD
✅ ✅ Risk warning, disclaimer: the above is a personal market judgment and analysis based on published information and historical chart data on The trading view,
And only some of these analyzes are my actual real trades.
I hope Traders consider I am Not responsible for your trades and investment decision.
