Longs when price wants to break key levels on bookmapOn bookmap, there are certain order concentrations where there are massive orders.
Typically these orders get hit. In fact, in my experience, it is wise to expect such places to get hit. If not further.
Not immediately, but eventually.
To exploit these for trades, my observations lead me to two ideas.
The first is illustrated in this chart and idea.
When price really wants to fill these orders, it typically breaks it. All hopium fails. We eventually get it.
So we can place longs underneath massive such orders on the next such order concentration, as shown in the chart.
Another idea i'm considering is that its a good idea to expect these areas to get hit as targets during a strong trend in one direction. So if we're going down and there are big orders in a certain area, then take it as confluence to TA that we want these levels to get hit.
Search in ideas for "BookMap"

BTCUSD bookmap trade explanationBookmap trade explanation for BTCUSD trade
it was based on SMC and bookmap confirmation

BOOKMAP LIQUIDITY ASK EXPLANATION 4/16/24As jerome powell spoke today there was certain opportunities that were offered due to bookmap liquidity and we took trades based on these bids/asks

Acw GCJ2025 futures bookmap liquidity zones Using bookmap order flow software . We checked the gcj2025 forward contract for buyer and seller side liquidity in real time and transposed it into this chart
This will be a reference to our xauusd cash chart for key levels in the upcoming months

VARAUSD vs MATICUSD With BookMap Order Flow TutorialThis video briefly covers how to use bookmap at a really basic level and I also go over VARA vs MATIC correlation as well as the progress of our 80/20 candle.

Supply Zones With Orderflow on BOOKMAPsunday supply levels are being charted as i use bookmap to show what analysis can be portrayed along with upside levels and levels where u can possibly see a short side drop/ Scalp.

Today Gold Bookmap GOLD BOOKMAP TODAY ❤️🔥
There is a big order up there so waiting game plan 👌
Sell Monitor 2017-2024 Intraday ✅
Reason D1 Setup Divergence + new higher high and fresh Zone Drop base Drop

btc to $42000 ?i hope this break from 3999, because if you look at the bookmap, there are a lot of people queuing to sell on 3999 let se what the next news. get pump or dump

High-Probability Long at Round Number Resistance Post-ATHTrade Setup Overview
Risk-Reward Ratio: 1:2
Entry Zone: Confirmed resistance at the round number 122.00
Price Action: Price is retracing back into the order flow channel, aiming toward the Point of Control (POC)
Context & Confluences:
✅ Trend Direction: Overall trend is up
✅ Channel Breakout Attempt: Price attempted to break out of the channel, failed, and re-entered with aggressive buyers stepping in
✅ FVG (Fair Value Gap): Identified on the 1-minute timeframe, aligning with the area of aggressive buying
✅ Confirmation via Bookmap: Buyer activity confirmed on Bookmap at the identified FVG zone
✅ Key Level: Strong round number (122.00) adds further confluence
✅ Rule-Based Trade: All trade entry rules and confirmations are met
Caution:
The only concern is timing — this setup occurred over the weekend, outside of the active New York session. However, given that the market just reached a new all-time high (ATH), there is a strong likelihood of volatility resuming in the next session.
Conclusion:
This trade meets all criteria and is backed by technical confluence, order flow confirmation, and alignment with market structure. Despite the timing concern, it's a high-probability setup worth considering.

BTCUSDT – Liquidity Clustered, Volume Lying, and a Trap Brewing BTCUSDT – Liquidity Clustered, Volume Lying, and a Trap Brewing (April 21, 2025)
by Pôncio Pacífico – Institutional flow, obscene leverage, zero mercy
📍 Market Context
Bitcoin is trapped in a low-volatility chop range between $84.2K and $85.8K.
Open Interest is rising while price stays flat = someone is building a position… and someone else is about to be slaughtered.
The Asian market is open. So is the manipulation season.
🔎 Key Zones
Visible POC: $85.5K – the battlefield of confused traders.
Key Resistance: $86.3K – liquidation zone for overconfident shorters.
Key Support: $83.8K – emotional refuge of poorly placed longs.
🧠 Institutional Tools (no MACD tourist traps):
Delta: Positive, but not supported by real volume = spoofing or passive absorption.
Open Interest: Rising during consolidation = trap loading.
Bookmap: Hidden sell blocks above = fake breakout incoming.
📉 Trading Plan (2 Scenarios)
Scenario A – Squeeze & Dump (most likely)
→ Quick push to $86.2K–$86.4K to wipe out shorts
→ Hard reversal targeting $84.7K and $83.8K
→ Entry: Short @ $86.200
→ SL: $86.600
→ TP1: $84.700 / TP2: $83.800
Scenario B – Bear Trap with V-Recovery
→ Fake breakdown to $83.800 to liquidate longs
→ Snapback reversal into $85.5K+
→ Entry: Long @ $83.800
→ SL: $83.400
→ TP1: $85.500 / TP2: $86.200
🧾 Conclusion
BTC is about to explode.
Delta and OI scream manipulation.
If you’re trading without heatmaps or order flow, you’re funding a market maker’s new yacht.
This is not a battle between bulls and bears.
It’s between those who read the market... and those who guess it.

Spreads UPDATEStill, with no clear explanation, this is the reason why
I WOULD NOT BE HOLDING ANY FUNDS ON EXCHANGES.
GDAX - Finex spreads have widened dramatically:
Not because of tether, but because of the widening spreads at a time where liquidity has NOT dried up. The spreads widened DURING the 6K sideways trading. Volatility was LOW at the time.
Yes, the spreads were exceptionally wide during the parabolic cycle. This can possibly be due to the enormous influx of users on exchanges rapidly buying up bitcoin during the 2017 psychological mania.
HOWEVER
The widening in spreads in the low volatility environment at 6k was EXTREMELY suspicious to me.
As stated by the Willy Report in 2013/14:
"Combined with Willy still being active, this caused the spread between Gox (Mt. Gox) and other exchanges to get completely out of hand. At the pinnacle of it, on January 26th, Willy (Willybot, a bot insider that manipulated the price of bitcoin and had the capacity to buy bitcoin for $0) suddenly became inactive – and with it, the price retraced back to a more reasonable spread with the other exchanges."
"In total, a staggering ~$112 million was spent to buy close to 270,000 BTC – the bulk of which was bought in November. So if you were wondering how Bitcoin suddenly appreciated in value by a factor of 10 within the span of one month, well, this may be why."
"So how did all of this trading activity affect the price of Bitcoin as a whole? The answer is, unfortunately, enormously."
"The huge volume spike on July 28 15:14 is where the big buying starts. 15,000 coins get bought in the span of 30 minutes. According to the trade data, buying continues until the 31st, 15:55. After a four day pause, there’s some small buying on August 5th, but it really picks up again on the 12th at 21:32. Buying continues on-and-off, with some large spikes especially on the 19th, 27th and the 30th, where ten of thousands of coins are bought. Basically, all the huge green volume spikes in the above chart are the handiwork of Markus, and Markus alone." (Markus is a secondary bot noticed alongside WillyBot)
So, what's up with the GDAX spread?
The spread in my chart (BTCUSD - BTCUSD ) is in fact trading at the lowest point EVER. (At least that's what I see compared to the drawn out daily chart which, by Tradingviews logic will use the daily close to calculate the spread.
Using, bookmap.com 's chart's I maintain that sell volume is exceptionally aggressive and that, evident in this video, www.youtube.com there appears to be one or more aggressive bots placing significant downside pressure on GDAX books. In the video we can see, in the initial frame, the large red squares in the depth chart. These are the positions in question. They seem to have an endless supply of bitcoin, which I have observed since June. The bot's continue to place between 60-85 bitcoin diversified within the 10-20 points NTM (near the money) on the ASK side and appears to be 24/7.
Although hard to see in the realtime GDAX book, the aggregation of the ASK in the Bookmap charts, combined with the visualised depth chart makes these positions very clear.
This is my only explanation for the spreads, and nowhere else have I seen anyone have any better explanation (or any at all).
Although my data is not granular, one thing that can be clearly shown is the extremely suspicious spreads and more importantly, the timeliness of these spreads widening before price action.
In the above chart we can see that exchange spreads (GDAX-FINEX) widened significantly in a very controlled and stable manner until finally falling off AT THE SAME TIME as the enormous "pump candle" of the 15th of October. The spread seemed to tighten once again, as if the market began to re-balance, albeit slowly.
Then once again, the spread began to widen again, directly into the first sell of November.
Even more interestingly, during the pump of the 15th of Oct, at one point, GDAX traded OVER $1007 CHEAPER than Finex.
My fear is that this is only a 1 minute chart, and the Tradingiew spreads are using the candle close as data points. It is possible that, during that one minute candle, the spread was indeed far greater than this 1007 point value.
Although my data is not granular, the Willy Report of Mt. Gox in 2013 illustrates and proves that inter-exchange spreads CAN be influenced and OR caused by malicious bot behaviour. I do not suggest in any way that GDAX is a malicious exchange or that GDAX is acting against their TOS. Further I don't suggest that any other exchange is engaging in suggested or implied behaviour. It's entirely possible that this trading is simply being conducted by a client, retail or third party trader on these exchanges. Additionally, I could be entirely wrong and that the inter-exchange spreads are caused by an entirely different issue. I suggest that you read The Willy Report here: willyreport.wordpress.com and draw your own conclusions.

AUXUSDAlles is vrijdag uitgenomen aan liq boven aan op H1.
Breek van structuur en we hebben een reactie gekregen op een demandzone.
Op 2500 heb je een high die nog niet is uitnomen (wick) en op de bookmap liggen twee mooie strepen aan ordes. daarboven liggen nog nieuwe ordes tot aan 2510.5.
Mooiste is als deze worden uitnomen en dat we daarna verder naar benenden gaan richting de 2473 omdaar de ordes uit te nemen plus de liq die er ligt van de laastet wick op 2470.8
Woensdag belangrijke dag voor de cijfers die uitkomen. Die bepalen het sentiment voor de komende maanden voor beleggers.
--------
Everything was taken out on Friday at the top of H1.
Break structure and we got a response to a demand zone.
At 2500 you have a high that has not yet been taken (wick) and on the bookmap there are two nice lines of orders. above that there are new orders up to 2510.5.
The best thing is if these are taken out and then we continue down towards 2473 to take out the orders plus the liq that is there from the last wick at 2470.8
Wednesday is an important day for the figures that come out. These determine the sentiment for investors in the coming months.

VARAUSD - MY PIVOT POINT LEVELSThis is a digram showing the results of after I have recorded order walls from bookmap. As you can see I can now easily tell where the price action is more likely to pull back should a pump occur. Order walls need to be maintained and recorded accurately to the penny as often as possible to ensure precise targets as possible

BTC ORDERFLOW HEATMAP 12/31/23 - SHORT TO 41200It's been a real tough month to forecast bitcoin.
I've been delving into orderflow a lot more because you can only get an accurate picture of what price does and WHY it does so, is based on the real life orders that are in the market.
For this example of market behavior, here is the link to what I'm seeing with orders. I've annotate it so you guys can see market behavior.
LINK: imgur.com
PLEASE NOTE: THIS IS NOT A TRADINGVIEW PRODUCT, IT'S CALLED BOOKMAP. YOU CAN SEE EXISTING AND HISTORICAL ORDERFLOW WITH IT.
I believe that our retracement into the trailing stop orders prompted price to take out the last high, where we will be setting up for an ICT entry short since the market seems to want to sell this small rally as evidenced by the fact the the momentum failed to steer clear of large institutional sell orders.
We can also understand that since the Asian Killzone last night took out the NY killzone liquidity, that doomed the bullishness of this move.
I believe that price is currently setting up a long trap here. Volume Profile seems to show a lack of activity in this current range. I believe that a short position is a good call here. I'd like to see us take out the 41200 bottom. Take profit along the way.
Here is the orderflow image regarding the entry from near london high this morning:
imgur.com
I am very interested in that 42800 price area. Stop loss on anything above the high.

Bitcoin Liquidity HuntSince markets tend to gravitate towards liquidity this trade idea is based on large Limit order shown on the Coinbase order book using Bookmap. This is the first decent amount of Bitcoin buy-side liquidity on the Coinbase order book in months. ~2000 $BTC in limit orders levels down to $30k. Hyblock liquidation levels showing $17bn+ of short liquidations, we might have a chance to spike liquidity and squeeze up to the $55k sell orders. This doesn't make sense in the Macro context, but the data and charts seem to support it as a possibility.

Watching for c point long near $3I just scalped a small bit long on the AB leg on this and bailed when I saw a very large seller flashing size in Bookmap. I don't really like trading whaley coins like this where it's clear that even a medium size whale can knock price around by spoofing the bid ask ladder.
However at the moment it's the main mover on binance futures so it's on my watch list.
I would not short the BC leg because overall I think cryptos are at a point where they can snap back pretty fast due to short covering rallies. A safer and more interesting setup will be to look for accumulation shapes near a tag of the prior 3 point at $3 or so.
Even as I write this I am watching it sail higher up past the area where the seller had flashed size so it's the kind of thing where getting too eager to trade is probably going to result in whipsaws. I'm putting this one on the back burner until it's at an elliot wave count that has better RRR.

ES (SPX, SPY) Analysis, Key Levels, Setups for Mon, (Jan 12)MACRO/FUNDAMENTAL OVERVIEW
Primary Driver: Fed Independence Crisis Signals Major Risk-Off Environment
The predominant headline today revolves around a significant development concerning Federal Reserve independence. Fed Chair Jerome Powell revealed that the Justice Department issued a subpoena to the central bank, intimating the possibility of a criminal indictment. Powell described this as part of the administration's ongoing pressure to influence rate decisions, emphasizing, "The threat of criminal charges arises when the Federal Reserve prioritizes its best assessments for public service over the President's preferences."
Market Implications:
Analysts at Evercore ISI anticipate a "sell-America" narrative reminiscent of last April's peak tariff shock, predicting declines for the dollar, bonds, and equities in Monday's trading. Following the news, the markets showed muted initial responses; the U.S. dollar slipped 0.2% against a basket of currencies, while S&P 500 futures decreased by 0.5% and Nasdaq 100 futures fell 0.8%.
Political Risk Calendar:
In a noteworthy legal development, the Supreme Court is scheduled to hear arguments regarding Fed Governor Lisa Cook's potential removal on January 21. Additionally, former President Trump is reportedly interviewing BlackRock's Rick Rieder for a Fed chair position this week. Sen. Thom Tillis (R-NC) has indicated he will oppose any Trump nominee for the Fed "until this legal matter is fully resolved."
Safe Haven Flows:
Gold witnessed a notable rise of over 1%, surpassing $4,590 per ounce, reaching record highs as concerns over Federal Reserve independence and geopolitical tensions stoked demand for safe-haven assets. Silver also experienced a significant uptick, climbing 4.4% in spot trading to $83.50 an ounce after briefly reaching $83.96. The Swiss Franc emerged as the strongest performer among G10 currencies.
Secondary Drivers:
Ongoing unrest in Iran has intensified, with reports of protests resulting in hundreds of fatalities and Trump hinting at military strikes, propelling oil prices to a one-month high (Brent above $63, WTI above $58). The banking and financial sectors experienced weakness amid Trump's intentions to freeze credit card interest rates. Meanwhile, 30-year Treasury yields climbed 4 basis points to 4.86%, driven by inflation concerns. Lastly, December's weak non-farm payroll figures (averaging just 29,000 jobs per month in Q4 compared to 57,000 in Q2-Q3) complicate the Fed's path, although inflation risks remain a significant factor.
Market Analysis: SMC Structure Overview (4H/1H)
Daily Overview: The market has recently seen a rejection from the premium zone, exceeding 7,000, leading to a sequence of lower highs following a recent higher high at approximately 7,020. A break of structure (BOS) was confirmed at these recent highs, with the market now retracing.
4-Hour Perspective: The higher-low (HL) structure remains intact, with key support located in the 6,950-6,960 range. The pivotal weekly low (PWL) at 6,900 is a crucial level that must be maintained for bullish continuation. The premium zone is clearly delineated above 7,000.
1-Hour Insights: A change of character (CHoCH) is apparent, with an HL being constructed around 6,956. However, the recent sequence of lower highs/lower lows suggests prevailing short-term bearish pressure, with an equilibrium around 6,940.
The oscillator matrix indicates a bearish momentum divergence across multiple timeframes, particularly with the RSI remaining compressed within the 50-70 range.
Primary Sentiment: Bearish to Neutral
The prevailing risk-off sentiment is underscored by the technical structure reflecting distribution from the premium zone.
Scenario 1: Fade Rally into Y-POC/Prior Close (High Probability)
The overnight gap down sets the stage for the potential to fade any rally toward the 6,995-7,005 area, which encompasses the Y-Point of Control (POC) and the prior close, contingent on confirming order flow rejection.
- Entry Zone: 6,995-7,005
- Confirmation: Look for cumulative volume delta (CVD) divergence, iceberg selling on Bookmap, and any failed breakouts at the Y-Volume Area High (VAH).
- Targets: 1) 6,968 (overnight low), 2) 6,950-6,955 (prior day low/London low), 3) 6,900 (PWL).
- Stop Loss: Above 7,020 (previous day high, PDH).
Scenario 2: Long from Discount Zone (Countertrend Play)
Should price sweep past the prior day low (PDL) and reach the 6,950 HL zone or delve deeper to the 6,900 PWL, traders should monitor for absorption signals and CVD reversal to consider a countertrend long position.
- Entry Zone: 6,945-6,955 (initial attempt) or 6,890-6,910 (PWL area).
- Confirmation: Look for robust bid absorption, CVD divergence, and visible iceberg buying.
- Targets: 1) 6,970-6,975 (mid-range), 2) 6,995 (Y-POC).
- Stop Loss: Below 6,880 for PWL entries.
Headline Risk: The market remains sensitive to headlines related to further Federal Reserve/Department of Justice developments, comments from former President Trump regarding Powell, or any rulings from the Supreme Court. Traders are advised to adjust positions in light of potential volatility.
CPI Preview: As markets position ahead of the CPI release on Wednesday, a hotter print could instigate a hawkish posture, supportive of the dollar but bearish for equities.
Good Luck

Gold update 🚨 Gold Traders: Don’t Get Trapped in the Holiday “Thin Tape”! 🚨
We’re heading into the final full week of 2025, and the Order Flow is telling a fascinating story. While retail is dreaming of a "Santa Rally," the Heatmaps are showing where the real battle is being fought. 🔍
Here is the Breakdown for Next Week:
✅ The Resistance: Gold is hitting a wall at $4,385 - $4,395. We’re seeing heavy sell-side absorption here. Unless we get a high-volume breakout, expect a "fake-out" at these highs. 🛑
✅ The Value Zone: I’m watching the $4,297 - $4,310 area closely. This is where the institutional "Buy" orders are stacked. A dip into this zone could be the perfect entry for the next leg up to $4,400. 📈
✅ The Risk: It’s Christmas week! 🎄 Liquidity will be low. Remember: Low volume = High Volatility. Don't let a "Stop Run" knock you out of a good position. Keep your stops wide or your position sizes small.
My Plan: I’m a buyer on the dips near $4,300, targeting a year-end retest of the All-Time Highs. 🚀
What are you trading this week? Tech rotation or Gold safe-haven? Let me know in the comments! 👇
#Trading2025 #GoldFutures #OrderFlow #PriceAction #NinjaTrader #Bookmap #InvestSmart

BTCUSD — Coiled Energy vs Dollar | Volume Flow Meets Patience🧭 Context
Bitcoin started the week on the front foot, pressing toward the Flat TPO Top at 116 077.
Meanwhile, the U.S. Dollar Index (DXY) notched its fourth consecutive inside week, boxed between 97.56 and 99.19 — a quiet coil ahead of the Fed.
Crypto stretches while fiat meditates — a calm standoff where market psychology meets structure geometry.
📐 Technical Map
BTCUSD trades inside a bearish weekly range, yet buyers defend every dip.
Volume confirms accumulation from imbalance lows.
Key zones: 112.845 low → 116 077 high — measured-move corridor + prior TPO distribution shelf. A wick through 116 077 completes this week’s 10 % rotation
🌐 Fundamental Pulse
DXY strength = tightening risk appetite.
Fed decision mid-week sets November’s flow regime.
Until then, Bitcoin trades inversely: Dollar up → Crypto breathes out.
📊 Volume & Order Flow Map
Professional suite: Bookmap
Tracking bid/ask delta pressure around 112 845 and 116 077.
Liquidity depth shows absorption below range highs.
Volume clusters reveal short-covering rotations — not new conviction (yet).
Institutional footprint signals patience, not chase.
🎯 Plan
Full bias shift only if BTC closes above 116 077 with confirmed volume expansion.
If not, we reassess lower — control risk, collect flow, and stay structured.
“The Market Therapist”
Every trader thinks the market is emotional.
It’s not. You are.
The market doesn’t care about your caffeine, your new monitor, or your conviction.
It only respects structure, flow, and timing — and it punishes anyone who confuses belief with evidence.
So if Bitcoin grinds higher while the Dollar sleeps in a coil — breathe.
Nothing’s changed yet.
Pros wait. Amateurs anticipate. Only one gets paid.

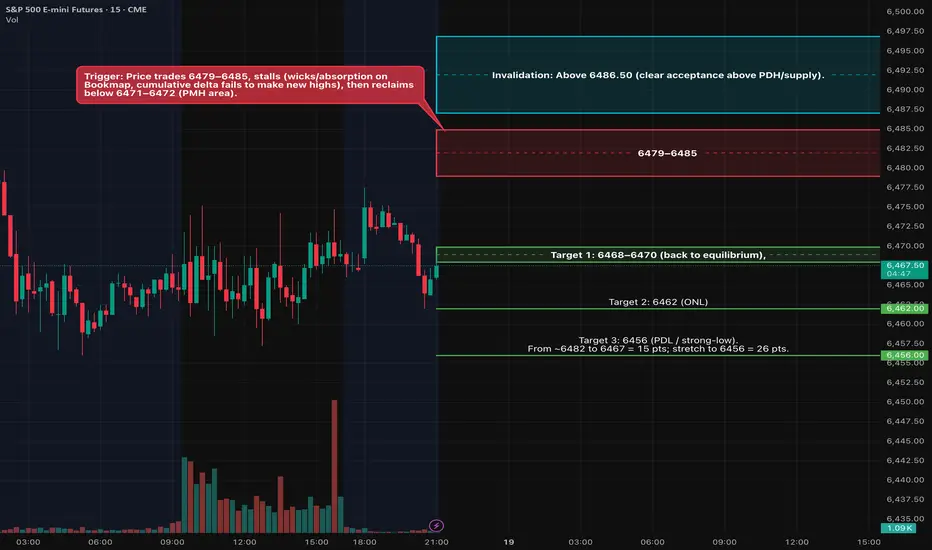
ES Analyses 08/19 Rejection short from 6479–6485 (OB + PDH)Fundamentals (what can move ES)
• 08:30 ET – U.S. New Residential Construction (Housing Starts/Permits). First move risk right at the print; can nudge yields and risk appetite. We’ll let the initial spike settle and then act on the HTF levels below. 
⸻
Key levels from your charts
Numbers rounded to the quarter where needed.
• PDH: 6484.25
• PDL: 6456.00
• ONH: 6475.25
• ONL: 6462.00
• RTH VWAP (today): 6466.50
• PMH / Asia H cluster: 6470.5–6471.75
• 30-min supply / OB: 6479–6485 (overlaps PDH)
• Liquidity/defense zone (“strong low”/Mon swing): 6452–6456
Think of 6468–6472 as the intraday “equilibrium” band we’ve been ping-ponging around; acceptance away from this band is what should start the 15+ pt drive.
Context: We press into the 30-min supply shelf that capped NYPM today.
Trigger: Price trades 6479–6485, stalls (wicks/absorption on Bookmap, cumulative delta fails to make new highs), then reclaims below 6471–6472 (PMH area).
Entry style: Stop-market on the reclaim or limit into a micro pullback after the failed pop.
Invalidation: Above 6486.50 (clear acceptance above PDH/supply).
Targets:
6468–6470 (back to equilibrium),
6462 (ONL),
6456 (PDL / strong-low).
From ~6482 to 6467 = 15 pts; stretch to 6456 = 26 pts.
Order-flow tells: Offers replenish 6480–6485; iceberg/absorption on up-ticks; delta divergence into the level.
Timing
08:30 ET data: stand aside for the first 2–5 minutes; let the impulse show its hand, then look for our triggers.
Federal Reserve Bank of New York
NY AM window: 09:45–11:30 ET.
NY PM window: 13:30–15:30 ET (if morning doesn’t give clean structure).
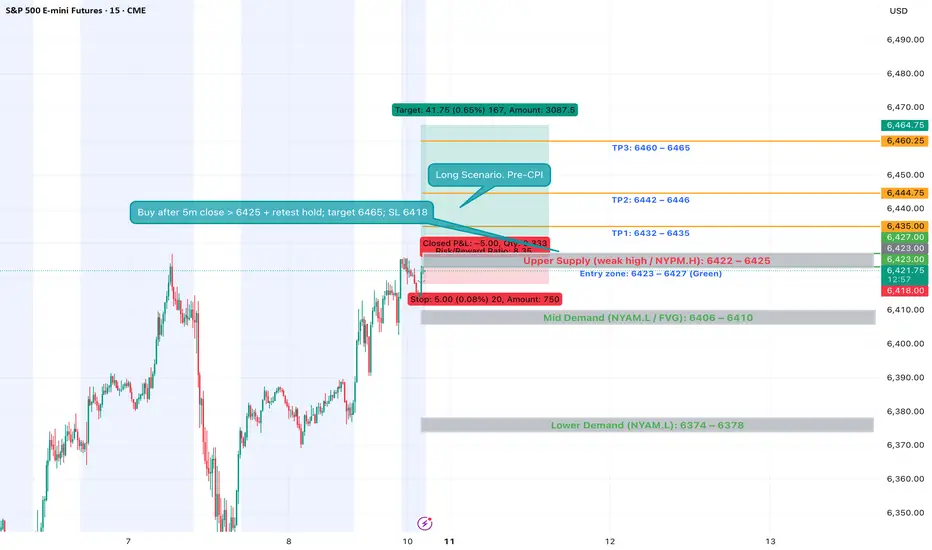
ES Futures — Week Ahead Playbook (Aug 11–15)Macro Drivers to Watch
Tue Aug 12 @ 8:30 AM ET — CPI (July)
Key inflation print; expect sharp vol expansion in NY AM.
Wed Aug 13 @ 2:00 PM ET — FOMC Minutes
Insight into Fed’s July 29–30 meeting tone.
Fri Aug 15 @ 8:30 AM ET — PPI (July) + Retail Sales (July)
Two high-impact releases within minutes.
Geopolitics:
US–China tensions over AI chip export controls & Russian oil tariffs
Possible Alaska summit with Trump, Putin, Zelenskyy Friday.
Bias & Structure
Trend (30m / 15m / 5m): Still bullish but pressing into 6415–6425 supply / weak-high zone.
Demand below: ~6410, ~6397, ~6386, ~6374.
Supply above: ~6425, ~6442–6446, ~6460–6465.
Setup 1 — Post-CPI Continuation Long
Trigger: First 5m close above 6422–6425 after CPI, then retest holds.
Entry: 6423–6427 (retest).
Invalidation: 5m close < 6418.
Targets:
TP1: 6432–6435
TP2: 6442–6446
TP3: 6460–6465
Notes: Needs bullish displacement, BOS hold, and Bookmap absorption on retest.
Setup 2 — Post-CPI Reversal Short
Trigger: Hot CPI or failed breakout → 5m close < 6406–6410, then retest from below.
Entry: 6406–6410.
Invalidation: 5m close > 6413–6415.
Targets:
TP1: 6388–6392
TP2: 6376–6378
TP3: 6358–6362
Notes: Needs trend flip on 30m/15m (CHoCH/BOS down) & heavy offer-side aggression.
Gold Took the Bait Then Got Body BaggedThis afternoon I stepped outside my usual mechanical system and ran a classic: the Opening Range Breakout (ORB) on MGC just to see if gold still respects the old-school plays.
Marked the range of the first 15-minute candle, waited for the break and confirmation close, then entered on the short side.
Asset: Micro Gold Futures (MGC1!)
Timeframe: 15-Minute
Strategy: Opening Range Breakout
Session: NY
Bias: Short
Trigger: Bearish 15-min close below the ORB low
Notes
ATR Expansion: Signalled volatility coming off the open (range >20 ticks)
Liquidity Trap: Gold swept ORB highs before dumping a classic trap-and-flush
Volume Confirmation: Delta turned aggressively negative at the break
Risk-Reward: Tight stop above range, clean 1:3 move into session lows
ORB: Dumb-Simple, Still Deadly
ORB is one of the simplest tools in a trader's playbook and that’s what makes it dangerous (in both directions). When it works, it works. You define the opening range, wait for price to break out and confirm, and ride the move.
But here’s the nuance:
Gold LOVES to fake one side before exploding the other. It’ll sweep liquidity, bait breakout traders, then detonate in the opposite direction. Today was a textbook clean sweep of ORB highs, then a brutal reversal and breakdown.
I usually lean on mechanical, model-based strategies, structured entries, rule-based exits, logic-driven setups. But I’m not blind to price. Having a few flexible strategies like ORB in the toolkit gives you options on days where market intent is obvious. So… does ORB actually work? Here's what the research says:
- Al Brooks (Price Action Trading)
ORB-type plays win 55–60% of the time when confirmed with price action and managed properly.
- Linda Raschke (Street Smarts)
ORB entries rated highly during volatility expansions especially in futures.
- Quantified Strategies (S&P 500 ORB backtest)/b]
57% win rate with basic 1:1 R:R and no filters.
Internal Bookmap/Tradovate tracking on MGC .
Fake outs occur in 30–40% of ORB plays, especially during thin liquidity or low-news days. But let’s be real that 55–60% win rate is open to interpretation. It depends on the confluences. Are you using delta confirmation?
Are you filtering by session or volatility? Are you waiting for a close outside the range or just guessing? ORB works if you work it. The strategy isn’t magic. The execution is.
The twist with today wasn't a "trend continuation" move. It was a rejection. Gold baited breakout longs, then pulled the rug. This is where mechanical structure meets tape intuition.
Retail chased. Price snapped. Quant stayed calm and shorted the flush.
What Do You Think?
Do you still trust ORB? Or is it a trap most days? Do your stats back it up or have you evolved beyond it? Let’s open it up. Drop your ORB rules, tweaks, or horror stories below. I’ll reply to every serious one.
