Three White Soldiers on the dogeThree white soldiers is a bullish candlestick pattern that is used to predict the reversal of the current downtrend in a pricing chart
sorry guys hehe
Search in ideas for "CANDLESTICK"

OPCOM form a falling wedge, bullish divergence and hammer1. Chart pattern falling wedge formed
2. Based from RSI, there's a bullish divergence
3. Stochastic is at oversold
4. Reversal candlestick hammer observed.


ZECUSD Inside Candle (High at 323.99)Inside Bar Candlestick High is 323.99. Mother Bar High is 324.09.

Elon Musk Caused This Today Bitcoin had suffered a Bearish D1 candlestick right after the Announcement Tesla will not accepting Bitcoin to purchase their Vehicles anymore.
This will have a Bearish effect on the whole Crypto market
I Believe this is only Short Term, you can see on the Daily chart Elon Musk caused a long Shadow.
The market may take more time to Consolidate before going back into the 60000s.
Currently a great moment to Buy the Dip

BTCUSD bearish hammer price action aftermathThis is a small reminder to traders that do not pay great attention to candlestick patterns. While they might be too many to memorize, they are very useful and could guide you to a better trading experience. As we can see the bearish hammer was followed by a $1000 crash in BTCUSD price in less than an hour. for extra information, these kinds of crashes within the hour are expected not to last and recover intraday.
Intraday: within the 24 hour time interval of the day.
would you like to see more blog style posts?
let me know in the comments!

Hanging Man at the Top of the Channel? The S&P 500 just finished its third straight winning month. Now there could be signs of weakening as May begins.
First, let’s revisit the price channel running along the index all year. SPX has been stuck at the top of that ascending range since the middle of April. Will prices retreat from the upper line?
Second, last Thursday saw a new all-time high and a lower low versus Wednesday. That created an outside day and hanging man candlestick pattern on the chart – potential reversal patterns.
Finally, MACD has turned negative.
This fatigued price action occurred after several big events: the Fed, Big Tech earnings and GDP.
Investors could now face the risk of all the good news being priced in – especially with a new month beginning.
TradeStation is a pioneer in the trading industry, providing access to stocks, options, futures and cryptocurrencies. See our Overview for more.


BTCUSDT/Double Doji Strategy/Candlestick analysisSimple analysis, but it can be useful, please pay attention to chart and read texts on it ,Simplified Entry/Exit based Double Doji Strategy for Daily Chart. We should now be able to open Long with two targets as explained within the Chart.
Please follow your strategy , this is just my idea , and I will be glad to see your ideas on this post.
Please do not forget 'like' button :), thanks and Trade safe.
Good luck.

BITCOIN BREAKOUT PREDICTEDUsing a combination of squeeze momentum and tweezer bottom candlestick chart to predict the explosive breakout that blew the bitcoin price all the way to $58,000.
This is only for educational purposes!
like for more.
Thierry

Monday could be good or .....NASDAQ:NNDM
The left and middle charts show the candlestick patterns in a daily timeframe, and the right side is in 10 minutes timeframe.
Looking at the right side, it is clear that the price action remained within $10.51 resistance and $9.65 support on Friday.
Looking at the Daily charts, Friday's price action resulted in a possible Morning Star pattern, depending on Monday. If Monday is green, then it confirms the bullish trend.
Some indications make me uncertain, which is why I have included the chart in the center. By looking at the daily timeframe from 17 Dec 2020, it looks as if a bearish head and shoulder pattern is forming, which may be wrong, but I still find it necessary and important to mention.
Of course, I personally look forward to a bullish trend very soon. Since the news about the RF IC being sent to the international space station, it looks as if the Volatility is declining, while RSI and MACD are giving a mild bullish signal (chart on the right side), suggesting an accumulation period which is a good sign.
Let's see how It will be on Monday. If the bulls get stronger, then by the end of the month, we could get to $12.80.
Let me know what you think. I appreciate your comments.


BTC/USD Swing Trade Analysis - Double Bottom, I'm BullishHello and welcome to another BITFINEX:BTCUSD analysis!
Like most people, I thought we were heading for a dip with a head and shoulders pattern this weekend (in purple). However, that has been invalidated as the price broke above the right shoulder last night. Does this mean we now have a double bottom (in orange)? The confirmation for that would come at the resistance of the left side of the W at ~$51,650 (it might even get there before I post this analysis :D ).
The volume is fairly low, but it is the weekend, so I'm not sure if we can take that into account (this is my first analysis on the weekend).
Interestingly, we can see that when the H&S pattern was invalidated was also when the MACD lines crossed into the positive territory. This is a confirmation of the uptrend. However, there isn't a massive separation between the lines, which means that price will stay more or less stable. On the other hand, if you look at the last big bull rally (18-19 Feb) where we had 5 green candles in sequence, we can see that the lines weren't that separate either. But, we are already at 5 green candles in sequence, and we haven't had a sequence of more than 5 positive candles since January. Why look into the sequence of red and green candles? Because BTC is very volatile, so it's rare that it will go only up or only down for a long time. So, in conclusion, the MACD has 2 signs of going positive, but the candlestick have a sign of going negative.
The RSI is at 60%, which means that there is a bit of resistance for the price to go much higher. Put it in another way, it hasn't reached 70% (which is when the market thinks it's overpriced). This means that the market thinks it's a little above its value, but not that much - not enough to signal that it is overpriced (usually a great time to sell because it will likely fall). So, from and RSI perspective, it looks like the price is finding its new value between ~48k and ~52k, with some room for reaching the previous ATH of ~57k.
Conclusion/TLDR:
Let's put everything together now:
* We have 4 indications that the price will go up
* We have 1 indicators that the price will go down
Therefore, my position is bullish. I think it will go up to at least ~52k in the next ~12 hours.
Disclaimer: this is not financial or investment advice. Cryptocurrency is very risky. Please only invest what you can afford to lose.

Netflix: Weekly/Daily Analysis - Exit Long PositionsNFLX Weekly/Daily:
Weekly:
The Weekly chart's ADX numbers are falling such that I'm considering this may break below the PB&J Sweet Spot and potentially dead cross, changing the asset into short mode. It is however within the PB&J buy zone so a bullish reversal candlestick is certainly possible here as well. Bearish MACD divergence and a declining +DI seem to support that this is the end of the bullish wave.
Daily:
As far as Nison's SMA 10/20/200 strategy, shorting this is out of the question until both SMA 10/20 are below SMA 200, and they Dead Cross following. SMA 200 is a 4% drop from here and prior similar price action in this area precipitated an additional -15% drop before reversing bullish after 2 Weeks trading under SMA 200. Given the Weekly and Daily perspective I would close any open positions and only consider reentry on a solid bullish reversal from the SMA 200 zone, and only following a pullback into the SMA 10 / EMA "Sweet Spot" zone after a Golden Cross.
Also, Netflix should pay their damn taxes.

EUR/USD (1H Chart):Can I convince you to sell???Three good reasons to sell!!!
Hello fellow traders, I'm fairly bearish on EURUSD today because:
I see a bearish engulfing reversal candlestick formation on the 1hour timeframe, that happens to be located on a very strong resistance level. Since price has failed to cross above this resistance level, I'm still convinced that the bears are still in power. Please watch the video in order to receive a full breakdown of the trade and additional reasons on why I'm selling.
Risk: 24 pips
Reward: 112 pips
Risk/Reward Ratio: 4.54
Please like if you agree with the idea and follow for more quality ideas.
Feel free to comment and share your views!!!

PLTR reversal to upside on huge volume & morning star pattern PLTR on 4 HR: showing signs of reversal to upside
RECENT NEWS
Cathie Wood's Ark Invest ETFs acquired over 6.8 million shares of PLTR last week.
TECHNICAL OBSERVATIONS
PLTR was trading in an upward channel but broke below the channel early last week (2/16).
Toward end of the week, PLTR recently bounced with huge volume with more institution buying.
NYSE:PLTR On the daily chart, the morning star candlestick pattern was created on Friday (2/19) which indicates a bullish reversal to upside.
SUPPORT & RESISTANCE
Resistance: $31.30 | $36.60 | $38.20 | $40
Support: $24.80 | $23.35


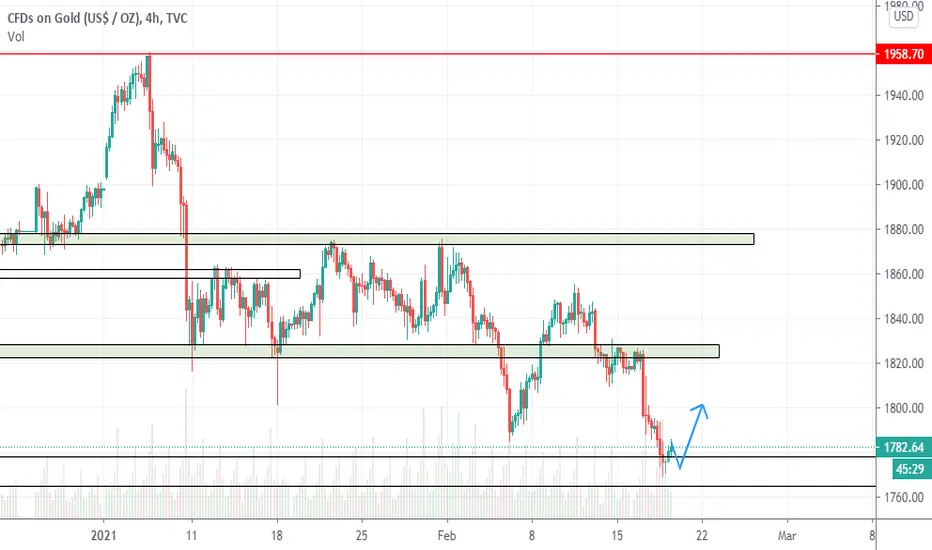
candlestick patternlooking at the H4 time frame there's a dragonfly doji and with that candlestick the price had retested a low set in November and failed to break it. price might retest in and around that area and if the support holds we look to go long
Are you ready for 0.0027$ DENTDent is making a big falling wedge and seeing a lot shaved bars(big buys ) on 4 hour(bleu candle colors.
So we have 2 signs this is very bullish
1. shaved candlestick bars
2. big falling wedge
In long term i am seeing the last bigger falling wedge to go LONG. (3 points lines and you go long)
Are you buying ?
I am in!
Good luck and Like and Share.
Thanks


Potential buys on EU!We've got confirmation that we're in an uptrend. Ascending channel with 3 touches, bullish engulfing candlestick which might give us buying opportunities.
If you've got any thoughts, leave a comment below!

