HPCLHPCL is about to break resistance of 280.
If it breaks & Sustain for 3 mins then buy with said sloss & tgts.
Search in ideas for "HPCL"

Weekly Inverted Head and Shoulders pattern breakout in HPCLHPCL forming a Inverted Head and Shoulders on Weekly, looks good to go long with SL of 200 for target of 325.
All ideas are expressed for Educational Purposes Only.

#HPCL #BANKNIFTY #NIFTY #NSE #BSE #TRADING #COVID19 #HINDPETROHINDPETRO
HPCL
HINDUSTAN PETROLEUM CORPORATION LTD.
CMP: 220.90
Target 1: 246
Target 2: 259
SL: 215


HPCL:Likely Flag Pattern Break OutHPCL:Has formed a flag pattern in daily chart and also has given Golden DEMA Cross over -20 DEMA against 50/100/200DEMA in daily chart.
Combination of the above suggests a possible15 point move -equivalent to the length of the Pole (Pole & Flag pattern break out) towards 460+(For educational purpose only)
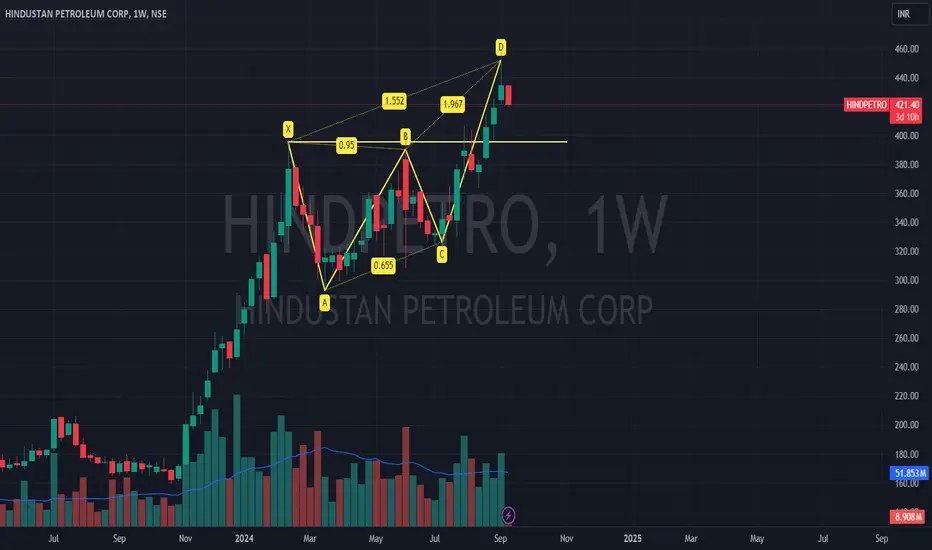
HPCL 1WHPCL's Weekly Chart: A Technical Perspective
If HPCL's price action aligns with the classic bearish butterfly pattern, it could suggest that the stock's upward momentum is weakening. This might lead to a price decline of approximately 100 rupees from the current level of 421. However, it's important to note that technical analysis is not foolproof, and other factors, such as fundamental analysis and market sentiment, can influence the stock's price.
I Am Not SEBI Registered Analyst. All Post and Levels Posting is only for educational and knowledge purpose. I Am not responsible for your any kind of loss or profit.
No Claim, All Rights Reserved.‼️
HPCL down side target 360HPCL will see further decline, the stock is facing a big resistance on the weekly chart, in the coming time the stock can go to the level of 360 or even below.


HPCL INVERSE HEAD AND SHOULDER ON DAILYHPCL making inverse head and shoulder on daily looking for a first target of 290 and if sustains above 290 we can see 300/310. there is a gap also between 290 to 300 that will also fill. lets see how this trade goes....


HPCL - 4 hours - 485 on the way HPCL will come down to 485 from current 510 in 2 weeks time !!
Dissimilarity method is followed here


HPCL- Bang On..for the fall below 1190 to 1160.(Started Puking)HPCL--Pukes....Hurry Man..Below 1190....1160..Running.....Vow.
Regards, Abhishek H.Singh, CMT

HPCLrend Overview
Overall Trend: Strong uptrend across all timeframes (Yearly → Daily → ITF).
Key Support Zone: 431–444
MTF Average Price: 441
Trade Plan Highlights
Entry Price: 444
Stop Loss: 431
Targets:
First: 523 (70% profit booking)
Positional: 563 (remaining 30%)
Quantity: 10,000 shares
Risk-Reward Ratio: 6:1
Upside Potential: 573
Net Profit if Targets Hit: 908,236
Net Loss if SL Hit: 151,764
ROI: 64% if target achieved in 4 months
Conclusion:
HPCL shows a consistent upward momentum with a high-risk-reward trade setup, strong support around 431–444, and attractive profit potential.
HPCL 1. Long Buildup for Jan month /
2. Current price is less than the intrinsic value
-------------------------
3 year CAGR growth
Revenue 2.2%
NetProfit 13.9%
OperatingProfit 14.3%
---------------------------
4 8.58% away from 52 week high
5. FII/FPI have increased holdings from 18.29% to 20.19% in Dec 2021 qtr.
6.Bullish Momentum - Above Short, Medium and Long Term Moving Averages

Hindustan Petroleum Corporation Ltd (HPCL) Demand Zone Reversal
HPCL has shown a strong price reaction from a well-defined demand zone, indicating active accumulation at lower levels. The stock has respected this support area multiple times, suggesting downside exhaustion.
From a macro perspective, easing concerns around the global crude oil supply—supported by improving diplomatic dialogue with Iran—have reduced pressure on oil prices. This acts as a sentiment tailwind for OMCs, including HPCL.
Technically, price action indicates:
Potential downtrend reversal with higher buying interest near support
Improving structure after prolonged corrective phase
Early momentum shift favoring bulls if price sustains above the demand zone
If follow-through buying continues, HPCL may attempt a pullback rally towards nearby resistance levels. However, failure to hold the demand zone could invalidate the reversal and resume the broader downtrend.
Trade Outlook:
Bias: Cautiously Bullish
Key Zone to Watch: Demand support area
Confirmation: Sustained price action above short-term resistance with volume
Note: Trade with proper risk management and confirmation, as broader market sentiment remains a key variable.

HPCL -- Every chart is saying somethingWeekly trendline Broken
Price volume breakout
Inverse head and shoulder breakout
Harmonics in place
Full of confirmations.

HPCL- Bullish swing- Towards creating new ATH ?!
24.09.2024
Buy- Above 419
NSE:HINDPETRO Target-448.5
Stop Loss-391
Risk Reward- 1:1
1.Breakout- Inside bar breakout
2.Upward trend with continues HH & HL formation
3.Price reversed from Resistance converted to support level(Very strong level)
4.Good volumes increase
5. Price rejection from 50 EMA and 21 EMA
6. Very good rejection from Fair value gap
7. Price reacted from 0.382 Fibonacci

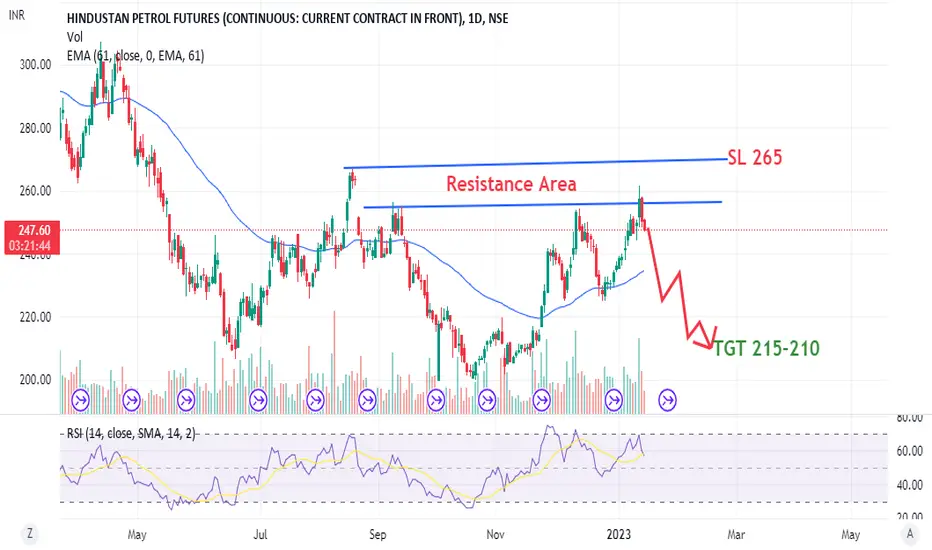
Future Trade: Bearish pattern seen in HPCLHPCL is reversing from almost triple top and RSI showing continuous negative divergence and is expected to turn bearish as seen on the daily time frame charts. A bearish engulfing candle pattern formation, having the open and high almost the same can be seen. Futures data also show a short buildup. A short trade can be taken in futures ( prices here given are as per spot) if the price sustains below 247 (preferred an equal lot hedge of 450 call option (25th January expiry) premium approximate 5-6(buy as hedge) along with short trade). It is giving an indication of the price falling at least up to 225 and below that, it can further fall to 215 - 210. Stop-loss is above 265 on a daily close basis. Close the shorts and hedge together. The holding duration is 3-4 trading sessions. This call becomes invalid if it opens below the 265 spot price.
PLEASE LIKE AND FOLLOW FOR FUTURE UPDATE.