KC shortKC broke tested for the fourth time the support at current level and broke, if there's follow through, it's a good short. Historically, July should be the seasonal low. COT report- commercial is not hedging at this point.
Search in ideas for "KCS"


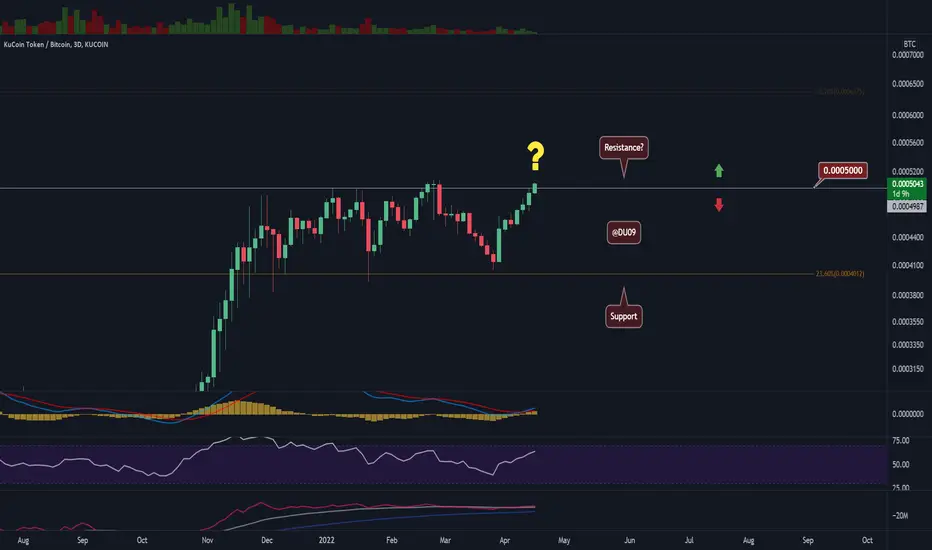
KCSKCS is having a clear battle. Just my op on the situation. Easy longs on the uprise and let it trickle back down.

KCS/USD - Breakdown under $21 on bearish market sentiment!😪KCS had an attempt to break above the $23 resistance, but the buy pressure was not sufficient to make it happen. This quickly turned into a fakeout as price fell under the ascending triangle (in blue).
Key support: $20, $16
Key resistance: $23, $28 ( ATH )
The market turned bearish on Tuesday when both ETH and BTC took a downturn that continues today. KCS was unable hold off this sell pressure and was pushed back down towards its support at $20. Today, KCS also broke below the ascending triangle (in blue) that was discussed in my last KCS idea. This makes a test of the $20 support very likely.
Technical Indicators:
Volume: Volume increase yesterday during the sell-off. This is a bearish sign and today's price continued lower. Unlikely for this to change until KCS reaches the key support.
RSI: The daily RSI has been falling in line with price and it is unlikely to curve back up until price holds above support.
MACD: The daily MACD just did a bearish cross today. This is likely to be confirmed when the day closes if buyers do not show up soon.
Bias
The bias for KCS is bearish. Hopefully buyers will return at the $20 support, otherwise, price can fall to $16.
Short-Term Price Prediction for KCS
The current price action as well as the MACD have turned bearish for KCS. It is unlikely that KCS can rally on its own considering current market conditions. The most likely scenario is for the current correction to continue. KCS has good support on the $20 and $16 levels which can provide a good base to stop this downtrend.
Like and follow if you liked my idea!

KCS/USD - Downtrend stopped! Rally next? 😍 KCS found good support on the $20 level and is now consolidating in a flat trend. This is a positive sign as it puts a stop to the downtrend and may prepare the stage for an eventual rally in price.
Key support: $20, $16
Key resistance: $23, $28 (ATH)
The market turned back up on Tuesday when both ETH and BTC broke above key resistance levels. KCS also bounced, but this was not so significant and price entered into a range stuck between the key resistance at $23 and support at $20. KCS also appears to have formed a small ascending triangle. Breaking this will likely bring more momentum.
Technical Indicators:
Volume: Volume continued to decrease this week and likely we can expect some new volatility as soon as price leaves the ascending triangle.
RSI: The daily RSI made a higher high, but the current price action lacks conviction. Therefore, to have more confidence in the price action, volume has to increase.
MACD: Good news on the daily MACD as it did a bullish crossover! This is significant and may signal that KCS is preparing to rally soon. Breaking above the ascending triangle will be a good sign that this can take place.
Bias
The bias for KCS is neutral right now. A break above $23 would put KCS back on the bullish side.
Short-Term Price Prediction for KCS
The current price action as well as the MACD seem to suggest that KCS is preparing for a possible breakout from this ascending triangle and an eventual test of the $23 resistance level. If successful, KCS can resume its rally.
Like and follow if you liked my idea!

KCS Coils Within A Wedge Awaiting a Bullish Breakout-KCS has formed a wedge on major support
-Kucoin rose nearly 200% since the start of April
-Indicators reset for another bullish impulse
KCS has had a wild bull run reaching nearly 6000% gains since its low in January 2019. Kucoin nearly reached its previous ATH of $21.40 the last 2 weeks as the token skyrocketed 200%. The bulls aren’t giving up yet as KCS has held its major support level of $15.75 for the last week.
While looking at the chart, we can see the price of KCS has been coiling within a wedge for a week as investors await its next breakout. The end of wedge has arrived and KCS will make its move within the next day. If KCS manages to break upwards, which is the likely scenario, price should rocket 18% to its major resistance level of $18.80.
If the bears take control and KCS fails to hold its $15.90 support, expect a fall to minor support range of $13.53. In the case the token is left with little buyer, a further dip to major support of $11.40 may occur. This support level is also met with the 4HR 200MA.
While looking at the Stochastic RSI (blue & orange), its fair to expect consolidation of KCS may be coming to an end as the strength has been settled in the oversold territory. The coiled look to the indicators shows its priming for an upward move. Confirming this bullish view, the regular RSI has been curving around the last 4 days and has broke above its trend line. This sets the stage for Kucoin to attempt another bullish move.
KCS intraday levels
Spot rate: $15.91
Trend: Sideways
Volatility: Low
Support: $15.75
Resistance: $18.80

KCS/USD - Breakout attempt in progress! Can it make it? 🚨KCS has rallied HARD. But the resistance at $21 continues to put up a good fight. For a second there KCS appeared to have broken the resistance and run, but bears quickly came over to push price below it.
The volume on this last attempt looks solid and shows bulls are really eager. The new whitepaper from KCS as well as KCS turning into a major ecosystem are all bullish signals!
The indicators support this bias and as you can see on this chart, the MACD is bullish and barely just crossed to the positive. This means there is a lot of room left to go HIGEHR.
But before we can celebrate, that resistance at $21 has to fall, without that happening, it is too early to call it.
Should the market turn bearish around here, than KCS has great support around $17 which is quite some distance away.
My bias remains bullish on KCS right now and another attempt to break the key resistance seems inevitable.
Like and follow if you liked this idea!

KCS/BTC - Major Breakout vs BTC not seen since 2018! 🚀KCS is about to break above a key resistance vs BTC and set a new high not seen since 2018! 😲
If successful, KCS may enter a rally against BTC... which would be impressive.
On the USD chart (see below my idea), KCS also appears ready to rally, but it is too early to call it on that side. However, on this BTC chart, KCS looks strong.
Monday can be decisive. If KCS breaks away and pumps, it's done.
Expect some exciting price action!
Bias is bullish on this chart and so are the indicators, including volume!
Like and follow if you liked my idea!
KCS/USD - KCS Attempts Breakout! Will the market allow it? 🤔 KCS is slowly moving towards $21 which has acted as major resistance in the past and never really let the price rally above it.
Now, KCS is again trying to do the same. Will this time be successful after 5 failed attempts?
The indicators are slowly turning bullish, particularly OBV and MACD. RSI is still flat and the volume does not look that sexy, but it is a weekend.
Let's see if Monday KCS can build some momentum behind this most recent move. For now, the support at $19 has done a good job.
Bias may turn bullish on this price action, but I want to see KCS move above $21 and hold above that level first.
Like and follow if you liked my idea!

KCS/USD - The battle for $21 dominance continues! 😱KCS price has not managed so far to move away from $21 and turn it into support. Bulls and bears continue to battle at this key level.
It's been over a week since KCS has hit $21 and there is no winner yet.
Moreover, the indicators on MACD and RSI are starting to curve down. Can bulls save this?
Volume is also declining after the last pump.
This could go either way in my opinion. Bias is neutral over here. I really want to see KCS make $21 support and rally after.
Otherwise bears may push KCS lower before another attempt.
Stay vigilant and do not ape in (see APE idea below) at this price level.
Like and follow if you liked my idea!

KCS/BTC - Resistance hit, time for some cooldown. 🤔KCS on the Bitcoin pair has hit the key resistance at 5.8k satoshi.
Now, the price is reversing and if we are to look at the USD pair (see idea below) it seems the bullish momentum may have to take a pause.
For this reason, a retest of the 5k satoshi support line may be in order before KCS can hope to break the key resistance here.
The indicators on the daily timeframe are also curving back down and may signal a local top.
Bias is short on this price action, best to be on guard here and keep a close eye on the support.
Like and follow if you like my idea!

KCS/USD - Price at CRITICAL support! 🚨KCS's price is found right on the $17 support level. If broken, then price will likely quickly take a nosedive.
Volume is low and the indicators are all bearish. If the market sentiment does not change soon (which appears unlikely), then KCS's consolidation between $21 and $17 will end with a breakdown.
The next key level of support is found at $15 should that be the case.
With both the stock market and BTC taking a beating it is very hard to be bullish. Therefore, my bias is bearish at this time and prepare for the worse while hoping for the best.
Ideally KCS will be able to have a nice bounce after reaching $15.
Time will tell. Until then, stay safe!
Like and follow if you liked my idea.

KCS will reach new high ~ 75k stsKCS has KCC chain, KCS price has new power to up!
KCS will reach 47.5k sts => 75k sts and has chance to reach 130k sts at the end of bullrun.
130k sts is high, but 75k sts is entry price for KCS.

KCS/BTC 320% profit from our entry so congrats guys#KCS/BTC Profit Update:-
#KCS currently trading at 0.0003220 BTC
Finally boosted and hope you are in Huge profit.
Now 320% up from our entry.
Entry:- 0.0000800 BTC ✅
TP1:- 0.0001748 BTC ✅
TP2:- 0.0003143 BTC ✅
I booked profit yesterday from #KCS and holding only 10% of profit.
Hope you enjoying ride.
Now you can book profit here.
Please click LIKE button and Appreciate my hard work.
Must follow me for latest crypto real time updates.
Thank you.

KCS/BTC Kucoin share 500% potential from here..?#KCS/BTC TA Update:-
#KCS currently trading at 8700 Satoshi.
According to TA looking good for fresh entry.
Because currently trading at support level.
Support 1 is very strong support so I can expect big move from here.
Entry:- 0.0000800-0.0000870 BTC
Targets:- 1748/3143/4615 Satoshi
I can expect #KCS also will hit new all time high soon.
Because this is also exchange token.
If support 1 break down then New entry will be 200-300 Satoshi so keep an eye on this level.
Red Support line is very important line.
Please click LIKE button and Appreciate my hard work.
Must follow me for latest crypto real time updates.
Thank you.

KCS ready for another leg up. Accumualte as much as you canKCS is ready for another leg up. Try to get some KCS below $4 and hold. The good accumulation zone is $3.5 - $4. KCS will go like BNB in 2021 and has a lot of new updates and developments coming. Don't miss this one out. Place your orders and wait for it to fly.
Buy Zone: $3.5 - $4 (Buy more in dips)
Target: $4.5 - $5.4 - $6.1 - $7.4 - $8.5 - $9.6 - $11 - $14 - $17 - $20

KCS ready for epic run, Will go Like BNBKCS is the native token of the Kucoin exchange. Kucoin has a good reputation among the crypto community and has a good trading volume. KCS has recently updated its smart contracts and now users can enjoy the benefits of DeFi, DEx, lending, etc. KCS will follow BNB and will soon start a new bull cycle. Don't miss out on KCS.
Buy Zone: Below $2.5 (add more in dips till $1.75)
Target: $2.85 - $3.2 - $3.7 - $4.1 - $4.5 - $5.4 - $6.1 - $7.4 - $8.5 - $9.6 - $11 - $14 - $17 - $20

KCS/USD - Kucoin Token Holds above $18. Where Next?KCS appears to be in a long consolidation with price within a large range from $21 acting as resistance to $18 acting as support.
This flat trend is not very excited and a break of the key levels is needed for KCS to move passed these levels. The indicators are also rather flat in line with the price action.
The recommended course of action in such cases is to be patient and wait for the price to break away, otherwise taking a large position here can be quite risky.
Both the MACD and RSI are hovering around mid-levels and a trend is yet to emerge.
Volume remains low, but the OBV indicates a bullish bias with a crossover above the moving averages.
Best to be patient at this time.
Bias is neutral and will change only when one of the key levels is broken.
Like and follow if you liked my idea!

KCS - Trend-Following Setup!KCS is overall bullish trading inside the orange megaphone pattern.
Since it is sitting around the lower bound / trendline and green minor support, we will be looking for Trend-Following Buy setups.
However, KCS broke below the green zone, and it is currently retesting it, so the bears might still kick in for another bearish impulse till the lower blue support.
In this case, we will be looking for new buy setups as the price approaches the blue support.
That's why we want to wait for extra confirmation before buying , by waiting for a break above the gray area. In this case, the bulls would prove control again by breaking above the green zone.
Always follow your trading plan regarding entry, risk management, and trade management.
Good luck!
All Strategies Are Good; If Managed Properly!
~Rich

KCS - My Trading Plan in a picture!KCS is overall bullish trading inside the orange megaphone pattern.
Since it is sitting around the lower bound / trendline and green minor support, we will be looking for Trend-Following Buy setups.
on H1: price formed a valid trendline in blue and broke its last swing upward.
However, KCS broke below the green zone, and it is currently retesting it, so the bears might still kick in for another bearish impulse till the lower blue support.
In this case, we will be looking for new buy setups as the price approaches the blue support.
That's why we want to wait for extra confirmation before buying , by waiting for a break above the gray area. In this case, the bulls would prove control again by breaking above the green zone.
Always follow your trading plan regarding entry, risk management, and trade management.
Good luck!
All Strategies Are Good; If Managed Properly!
~Rich

KCS - Outlook ✅KCS - KuCoin
KCS is heading to retest the ATH ($27.888).
The market is showing Buy Volumes for this coin right now, and also, the value just got support from the lower Bollinger Band.
Since we don't see enough Buy Volumes to breakout and pass ATH, we might move sideways to consolidate for a while and build a better, solid value.
There are two support areas on the chart.
The first one is the local support zone which can hold the price and push it back up in case of any sudden market crashes.
The lower support zone is our Solid Support area which is our most substantial demand zone.
Use this chart as your trade setup for now; I'll keep it updated.
Current Market Price: $24.203
Let me know your ideas.
Good luck.

KCS bullish scenarioKCS will boom if this tough resistance got broken!
KCS is one of the best exchange tokens which can be compared with BNB in many aspects. by KCC establishment and considering its use case we can expect good price surge for $kcs in months ahead. remember that $kcs MC is too low compared with other exchange tokens!

