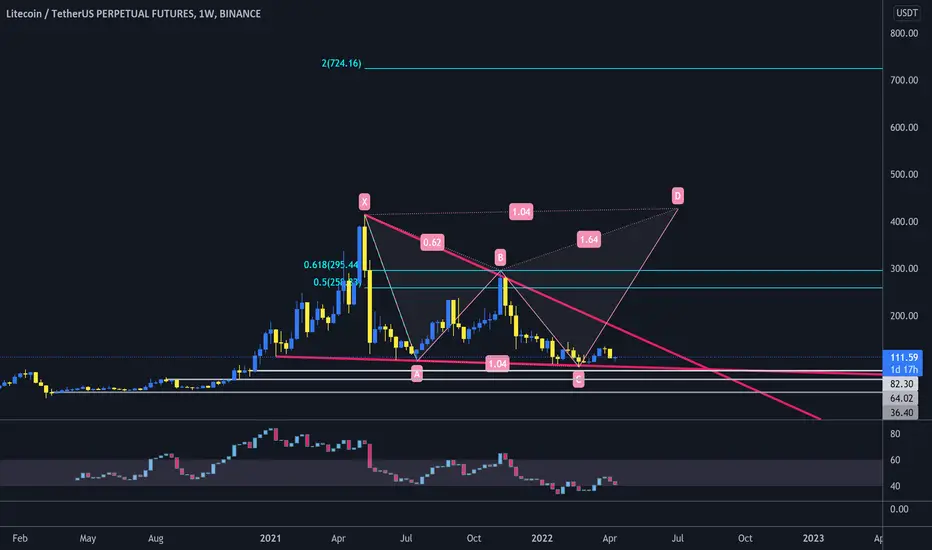
LTC/USDT AnalysisLTC Analysis
This is my idea. I have tried my best to bring the best possible outcome to this chart, Do not consider it FINANCIAL ADVICE.
So let's see how the market reacts in the coming days.
This chart is likely to help you in making better trade decisions
I am not a market maker I could be wrong.
Everything is on the chart.
Everything Depends On BTC Movement
Thank you
Search in ideas for "LTC@"


LTC @range support@97; a double bottom@92 or more pain?LTC bounced a little from 97,the 3x bottom of my green consolidation box since Jan. It may fall a little bit more to retest previous low & make a double bottom.
If this is the bottom, then a new EW cycle shall begin.
Worst case scenario is for it to drop a lot more to the max pain zone at the 85 to 78 pink box.
Not trading advice

LTC ShortLTC confirmed its downtrend, next level is $100. Nothing magical just trend following strategy...

LTC triangle and double bottom#LTC/USDT
$LTC weekly chart shows price is at bottom and above lower line of triangle.
🐮 holding the lower line of triangle as support can increase price toward upper line around $150.
break out from upper line of triangle will confirm double bottom pattern and will head up price toward $400 and $700.
🐻 break down from lower line will drop price to supports shown in chart.
LTC trend lines#LTC/USDT
$LTC broke down descending support line.
🐻 if bears success to hold the price below descending support it will drop to support zone around $80.
🐮 but if bulls success to close the daily candle above descending trend line it can be a fake break down and price can head up to resistance zone around $120.

LTC may go down to $118 before it starts to climb to $140LTC may go down to $118 before it starts to climb to $140. Do you all agree?


LTC LITECOIN ready for 157-200 LTCUSDC LTCUSDT LTCBTCLTC LITECOIN ready for 157-200 LTCUSDC LTCUSDT LTCBTC

LTC Update LTC super strong as we expected and just pretty smooth uptrend reversal as predicted after breaking out of the falling wedge. Trades are all going very nicely that we have been sharing on the channel, will keep updating as they playout as always.

LTC 12 HrLTC rounded bottom with a bullish cross on the Stochastic. Money flow curving hard to the positive on a larger time frame. Buy the breakout of the neckline, or the retest. Profit targets are marked. Also, testing the 200ma on the 12 hr.

ltc looking good to accumalateltc is looking great to accumulate down here,
could potentially be close to breaking the down trend
hope u got in when i posted a week earlier


LTC chart setup - Not Financial AdviceLTC chart setup - Not Financial Advice
Do Your Own Research
DYOR

LTC trend lines#LTC/USD
$LTC hold above long term support zone.
🐮 price can head up to touch $139 that is the same with descending trend line.
🐮🐮 break out from this trend line will increase price to resistance zone between $200 and $225
🐻 rejection from descending trend line ad $140 will drop price to descending support line around $98 and maybe drop more to support zone around $70.

#LTC tried to break #LTC tried to break through the price of 112 3 times without success, maybe this 4th time will work

LTC - local side channelLTC is moving in the local side channel, the channel output can set the price direction. If the price starts to fall, we have two support points and two resistances in the opposite direction.

LTC stopped declines.LTC is struggling to keep the price after quite significant drops of 64%. He has very strong support ahead at $ 84.5 and has to overcome resistance at $ 110 and $ 118 before any bigger gains.


LTC TRADELTC falling wedge on the daily, broke closed above then retested and bounced, perfect indication for our entry.
