LTC EUR small drop before a higher rise (Sunday-Monday)I think there is going to be another drop in short-term of BTC. Many new investors coming in BTC and after seeing a 400€ drop in a few minutes, are waiting for the bounce to get out. Also many analysist are talking that the bubble could pop anytime soon, and it is normal after the recent rises over 10% a day people will try to sell. LTC and most of altcoins drop when BTC falls.
However, after this, I think LTC will grow a lot as it was trying to reach 35€ again before the yesterday fall, probably until 40€ or 45€, very close to XMR.
Just my opinion :)
Search in ideas for "LTC@"

LTC/BTC cool downWave 4:
LTC/USD weakness:
.014 high probability, also 200 MA and .236 fib are both at .013, so that's possible as well.

LTC - hidden bear divergenceHidden bear divergence on 4H and 1D charts.
Possible retrace to about ~0.0170, then down.
Segwit was already priced in. There are no more good news for LTC which people could be waiting for.
Congratulations to a new generation of LTC bagholders :D

LTC good chance to beat higher high from 5th of AprilIt is quick review of recent LTC price movement. It seems to me that LTC created very nice not perfect but still upside-down head and shoulders formation on 4H chart. What is important here this formation is combined with significant round number which is 10$. I marked with orange tick big bullish candle which is good signal for further gains. When big bullish candle like this appear on the chart its lower part of body is treated as support which is here somewhere around 9.90$. Price could go below it for short period of time but there is good chance that 200 ema will push it back on track and price will reach new highest high. If the price will go lower I would wait for hammer with long shadow.

LTC longI've taken a long position on LTC at 3.851.
Unfortunately it seems like the days of LTC pumping along side BTC are long gone, but based on the chart I think we are poised for another run up to $4+. Whether it remains at the price though is another story.

LTC/BTC double bottom?We shall see, to me it mostly depends on how fast LTC/CNY can break 55.5 CNY...there is huge upside above that level. If that doesnt happen by this weekend/early next week then it might have to wait for ltc/btc to test .00585 before clearing this level (55cny). Stay tuned, even if the ratio falls lower in the near term that does not rule out the double bottom, see the wick on the candle that started the 13' run, could get something similar as a shake out before the big rise.

LTC: into the second wave or we are into the correction (3-3-5)?If LTC is into 2nd wave then BTC would have to go up, but if LTC breaks down this strong resistance (day chart) BTC would probably continue down.

LTC is Trading inside a Pennant PatternLTC is Trading inside a Pennant Pattern! Wait for Breakout or Breakdown with proper retest to open LONG or SHORT

LTC is going to FLY really soonLTC is forming bullish structure on weekly with multiple confluences as shown in chart.
This is for sure going to fly so don't miss out when it does.
Not a Financial advice. Do your research before getting into the trade.

#LTC/USDT analysis.Give me some energy !!!#LTC
The price is moving within a descending channel on the 1-hour frame, adhering well to it, and is heading for a strong breakout and retest.
We have a bearish trend on the RSI indicator that is about to be broken and retested, supporting the upside.
There is a major support area (marked in green) at 107.50, which represents a strong basis for the upside.
For inquiries, please leave a comment.
We are in a consolidation trend above the 100 moving average.
Entry price: 111.15
First target: 112.80
Second target: 114.70
Third target: 117
Don't forget a simple matter: capital management.
When you reach the first target, save some money and then change your stop-loss order to an entry order.
For inquiries, please leave a comment.
Thank you.

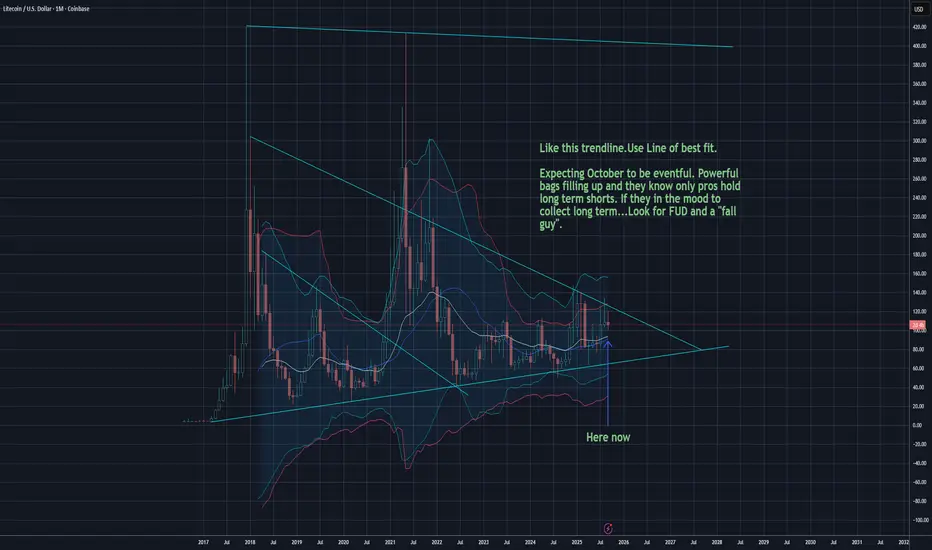
LTC - Litecoin closing monthly flat...what next?LTC spent September trading between $108 - $121. A tight range while everyone awaits the SEC ruling. Usage for payments is up and the network remains strong yet it trades in AMEX:USD and is now being bought up by the same greedy bankers that led Satoshi to create Bitcoin. These people play by different rules.
Expecting a RED October for markets. Possible some heavy market FUD with a "fall guy" to blame. I am not short and will view as a buying opportunity if happens. Long term bullish but next month.....BRACE
Not financial advice and never take advice from the internet. Happy Sunday
LTC long settupLTC is retracing to a rising support around 110. I will be entering long at 110 with a 1/5 RR settup targeting the top rising resitance line. The stop loss will be set at the 101.19.
RR:1/5
TP: 137.08
SL: 101.19
Potential Percentage Gain: %24.5
Potential Percentage Loss: %7.9
Not financial advice. Do your own DD. Thanks for viewing the idea.

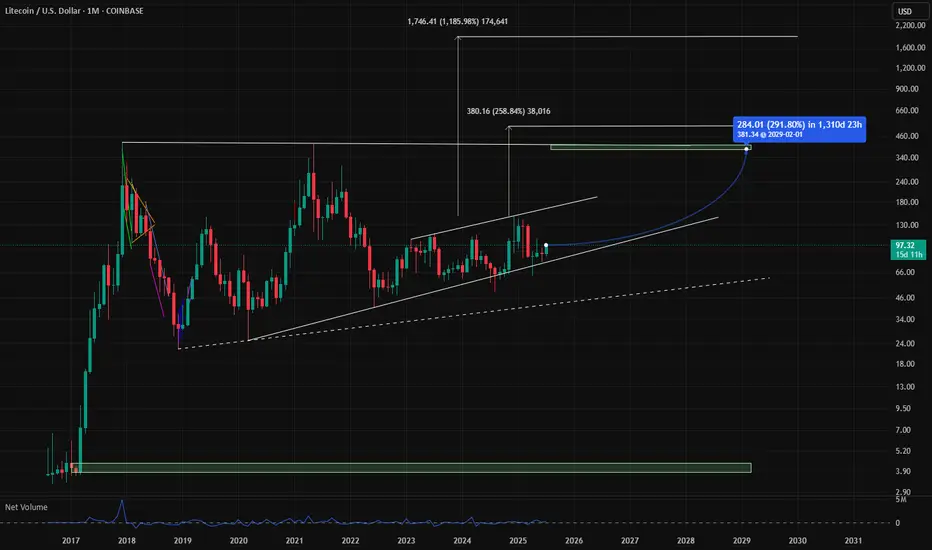
LTC Targets 400$ + 1900$ Litcoin LTC Targets for the next run are atm +290% is a realistic szenario. The addvanced targets at 1900$ are very impressiv but remember there are only 21 Mio. Coins too, like BTC because it is the fork and think about an alternative payment methode like btc, would be a reason for 1900$ pro LTC. So in Crypto is nothing unreal if you could imagine, but first of all approx. 400$ are a good direction. GM

#LTC/USDT#LTC
The price is moving within a descending channel on the 1-hour frame, adhering well to it, and is heading for a strong breakout and retest.
We are seeing a bounce from the lower boundary of the descending channel, which is support at 92.48.
We have a downtrend on the RSI indicator that is about to be broken and retested, supporting the upward trend.
We are looking for stability above the 100 moving average.
Entry price: 97.44
First target: 100.24
Second target: 102.45
Third target: 105.26

LTC is near to bearish zone(95.71)Ltc breakdown level is 95.71 and if it drops below this level,
it could drop to 87.27, 81.56 and 75.36, SL 102

LTC is going downLTC is now below bullish zone and entered into bearish zone. Short sell is possible.
TP is 85 and 67. SL is 110

LTC: The 8 Years Long Triangle#LTC has been forming a corrective triangle since 2017. Price action from 2022 to now indicates the triangle is nearing completion, which indicates a nearing bullish breakout.
Even a dip below $50 wouldn’t invalidate the setup, as long as the triangle holds.
#Litecoin

LTC/USDT 1H: Bearish Breakdown – Short Setup Targeting $115.50?LTC/USDT 1H: Bearish Breakdown – Short Setup Targeting $115.50?
🚀 Follow me on TradingView if you respect our charts! 📈 Daily updates!
Current Market Analysis:
Price at $119.85 showing strong bearish momentum.
Market makers appear to be in a distribution phase with clear lower highs.
Hidden bearish divergence on RSI confirms the downtrend.
Risk Score: 8/10 – High risk environment.
Market Maker Activity:
Distribution pattern is evident with lower highs.
Declining volume on bounces suggests persistent selling pressure.
Expect continued downside until testing support around $115.50.
Trade Setup (Confidence 8/10):
Recommendation: Short position with high confidence.
Entry: At current price ($119.85).
Targets:
T1: $118.00
T2: $115.50
Stop Loss: Set at $122.40 (above recent swing high).
Key Resistance Zones: $124.00, $128.50, $136.00
Recommendation:
Wait for confirmation of entry with a rejection around $122. This setup aligns perfectly with SMC principles, indicating strong institutional selling pressure.
🚀 Follow me on TradingView if you respect our charts! 📈 Daily updates!
LTC has completed the accumulation phase! LTC completes its accumulation phase of more than 896 days and is preparing for a breakout! I would expect a hike to the 0.786 Fibonacci level, as this is a project with huge capitalization, but with poor usability. With spillovers from Bitcoin, Ethereum and Solana it could show huge growth!
Horban Brothers.

LTC/USDT 1H: Bears Target $112 After $132 Rejection!LTC/USDT 1H Chart Analysis
🚀 Follow me on TradingView if you respect our charts 📈Daily new charts!
Current Market Structure:
Bearish trend confirmed after rejection from premium zone at $132.
RSI: Bearish divergence at recent high, with overbought conditions.
Market Structure: Lower highs forming, signaling continuation to the downside.
Smart Money Activity:
Accumulation Phase: Likely occurring at discount zone $110-$112.
Distribution Phase: Visible at the premium zone ($132).
Market Makers: Targeting liquidity below $110.
Key Levels:
Entry Zone: Short at $126-$128 (resistance zone).
Targets:
T1: $120 (Equilibrium Zone).
T2: $112 (Discount Zone).
Stop Loss: Above $133 (recent swing high).
Risk Score:
7/10 (Favorable R:R ratio with clear invalidation).
Market Maker Intent:
Stop Hunt Expected: Watch for potential liquidity grab above $132 before further downside.
Volume Analysis: Declining on recent push up, indicating weakening bullish pressure.
Recommendation:
Short positions favorable within the $126-$128 range.
Maintain tight stops above $133 to manage risk.
Wait for bearish order block confirmation before entering.
Confidence Level: 8/10 for bearish continuation.
🚀 Follow me on TradingView if you respect our charts 📈Daily new charts!


LTC Trade Zones: Short or Long?LTC has been making some moves recently, with a solid rise getting close to a key high. But the current price action hints at an ABC corrective structure, so a pullback could be on the way.
Short Setup:
Entry: Between the 0.618 and 0.786 Fibonacci retracement of the current wave
Stop Loss: $141.4 (the previous high)
Target: $130.7
R:R: About 2:1
Long Setup:
Entry: Around $130, with confirmation
Stop Loss: $126.45
Targets:
First at $134
Second at $147 (the key high)
R:R: A nice 5:1 potential
Why These Levels?
The $130 support zone lines up with the 1:1 Trend-Based Fibonacci Extension ($130.29)
It’s also near a previous swing high, adding more weight to it as a strong level
Plan:
If price moves into the retracement zone, a short trade targeting $130 makes sense
If it hits the $130 support and shows strength, a long setup targeting $134 and $147 could be a great play
