LTC/USDT Short Positionltc is in a Descending Triangle.if breakout its gonna touch 70.
s;:76.63
tp:70
Search in ideas for "LTC@"

LTC/USDT Short PositionLTC is confirming a rising wedge.
sl:73.61
tp1:69.15
tp2:67.72
tp3:65.97
tp4:64.53
tp5:61.07
tp6:56

LTC quick short trade LTC is looking quite weak right now, i believe there is good opportunity to short from here, until the target hits.

LTC Bearish Butterfly BAMM Targeting $60LTC has tried to hold this zone up here but it looks like the macro will drag it back down for now. I think it will have a shot at going back up at $65-$60

LTC BOTTOM – RSI StudyLTC is in very similar bottom fractal in price action as well as in RSI. If the fractal is to be repeated, we are expecting one more down wave and consolidation with higher lows after that, before the next bull market.

LTC USDT | SHORT TERM TRADE SETUP#LTC/USDT
🟢Entry price: 75.77 - 70.80
🎯Targets:
|> 81(Sell 40%)
|> 84 (Sell 20%)
|> 89 (Sell 25%)
|> 92 (Sell 15%)
🔴Stop-loss: 68.9 (4h candle Close under it)
➡️Recommended risk: 0.25%
➡️Recommended Position Size : 2.75%
stay safe and trade safe
thank you!

LTC halving PUMPLTC is having a huge pump, this might be one of his last prices in this bear market.

ltc litecoin 1 week longltc litecoin 1 week long
usdt tether dollar
long here go to the moon
bitcoin crypto

LTC up closeLTC is going to cool off into the fibs for a few short candles. then...
looking at 93.03 for next resistance.
stoch rsi has room to drop, with a quick incline following.

LTC recorded good price growth during the last week!LTC recorded good price growth during the last week. The price of this currency, which was placed on an important support in the range of 55.6 to 57.4 dollars, continued to move up to the level of 65 dollars due to the strong return and renewed support of buyers. A reaction has been observed in this area. As you can see, in the daily time frame, the price trend is still in the range.
One of the rules of the range area is not to place the ceiling and floor of the price in a specific range. Therefore, according to the reaction that has been observed, there is a possibility that the price will decrease again towards the previous support. If we don't see selling pressure and close the 4-hour candle below the price of 61.6-61.2 dollars in the 4-hour period, there is a possibility of breaking the resistance and continuing the price growth to higher resistance levels in the range of 70 dollars. But if this support is broken, after the pullback to the range of $65, we expect the price to correct again and return to the price channel of $50.
The interesting thing about Litecoin is that if the daily candle closes above the $64.4-$66.2 range, we can expect the price direction to exit the range from above in the future, and the downward reversals are only pullbacks. It will be a long-term bullish wave. But if this does not happen, and on the other hand, the selling pressure in the market increases, the drop in the price of this currency can continue even up to the range of the price channel of 40-38 dollars, and fake break the previous bottom in the weekly time.

LTC/BTC Ready for Another -70% Fall ..?#LTC/BTC Technical Analysis:-
#Litecoin Is currently trading around 0.0036 BTC level.
As Per chart Big Resistance Level is 0.0044 BTC
If Break 0.0044 BTC level then I am expecting Big Move upward side but IMO not break and It will test again New Low’s.
So Be ready for Both Scenario and Never open any trade Blindly.
I am Fully Prepared for Next Bull Market and Working hard for you also.
I want Next Bull run you all wealth 10x-50x
Now Coming to The chart…
If Rejected from 0.0044 BT.LC Level resistance then I am expecting it will test 0.0025 BTC ( Which is approx -38% from Rejection level.
And Also Expecting more down fall if break 0.0025 Level then It will test 0.0012 Level in Few Months. ( -70% from Current Level )
So Guys Trade with Mind not FOMO
Support:- 0.0025/0.0012 BTC
Resistance:- 0.0044 BTC
Please Like and Appreciate ❤️❤️❤️

LTC 300% Profit Potentialltc moving as we predicted few days ago
20% profit so far hold it still long way to go

LTC Bearish PennantLtc appears to be forming a bearish pennant on the 4 hour chart.
It looks like it will fall and form a double bottom on strong weekly support between 45 to 41.
Short to 45 or lower.

Ltc forming a patternLtc forming a continous pattern after getting rejected from 55 lvl acting as resistance for kow
One this triangle pattern is broken we can trade for 51 lvl
Will update with another post for trading details

LTC CONFIRMS LOW - HIDDEN BULLISH DIVERGENCELTC BREAKS inflection point and following through the hidden bullish divergence locally. 2 tight confirmation lows is a give me all day. 60$ comin

LTC/USDT Technical Analysis 03/SEP/2022LTC is now moving in a channel and it is showing correction to last bullish trend.
overall analysis shows 70% chance of long position.

LTC inverse head and shoulders#LTC/USDT
$LTC broke out from neckline of inverted head and shoulders pattern.
🐮 so price will continue its rally as high as head height.

LTC strong, LTCUSD go to the moon.LTC goes to 100usd, What do you think.?
The transactions on Litecoin network are faster and sheaper than BTC network.

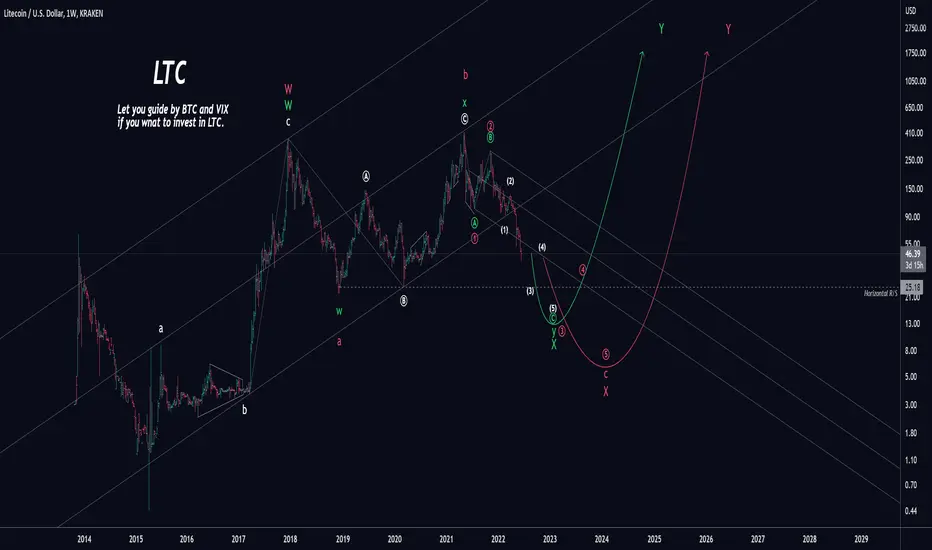
LTC (2W) / Elliott Wave & Algo Technical AnalysisLTC broke down from the macro upward channel (= bearish).
The complex correction could send us to $25 (triple bottom after a double top) or $13 (green path).
The expanded flat could send us to $6 (red path).
In all cases, an extended 5th could be cooking at the submicro degree.
A double top can be disastrous for prices.
Please like and share if you appreciate this market update.
We are algorithmic traders and certified Elliotticians. We publish Elliott Wave and algo technical analysis on a daily basis for indices, stocks, cryptos, commodities, VIX, DXY, in weekly, daily and 4-hour timeframes. Our counts are not drawn subjectively but backed by solid algo trading evidence. We also answer all your questions regarding the Elliott Wave Principle!
Cryptos are updated every day of the week and on Saturday, if necessary.
Traditional assets are updated every day of the week.
Elliott wave & Fibonacci labelling:
Common path in white, bullish count in green, bearish count in red.

LTC USDT Breaking the resistance trendline targeting 59.LTC USDT Breaking the resistance trendline targeting 59.

LTC LITECOIN USD : :LITECOIN FRONT RUNNING BITCOIN BULLRUNLTC LITECOIN USD PLEASE LIKE COMMENT AND FOLLOW IF YOU APPRECIATE THIS CONTENT. THANK YOU
Litecoin looks like its ready for its rally. The BTC dominance is going down which means many ALT are going to see a nice rally here soon. Litecoin I believe has hit its bottom and is now ready for its next major macro leg up. Litecoin in this run will blow past its previous all time high easily. I also think Litecoin will outperform most cryptos on this run including Bitcoin, in its percentage gain. As you can see the Golden Ratio Multiplier has called the bottoms on Litecoin correctly the last two times since 2017. This indicator also called the bottom on Bitcoin the last three times and is flashing a bottom signal on BTC now as well, go check it out. I have also included snaps of the StochRSI that has bottomed out and curling up as well as the RSI and MACD. Litecoin wont get any cheaper from here folks and we probably wont see these prices for Litecoin ever again. This is not trading or financial advice this is just my opinion. Thank you and good luck
STOCH RSI
RSI
MACD

LTC last impulseLTC looks to have formed a nice ABC correction with previous PA forming 3 waves.
Currently looks to be in the middle of an impulse move and looking for a nice scalp

LTC (Weekly) / Elliott Wave Analysis / Flat Correction?LTC breaking down from the macro upward channel (= bearish).
Complex correction sending us to $13 (green path).
Expanded flat sending us to $6 (red path).
A double top can be disastrous for prices.
The market will attempt a triple bottom at $25.
Please like and share if you appreciate this market update.
We are algorithmic traders and certified Elliotticians. We publish Elliott Wave and algo technical analysis on a daily basis for indices, stocks, cryptos, commodities, VIX, DXY, in weekly, daily and 4-hour timeframes. Our counts are not drawn subjectively but backed by solid algo trading evidence. We also answer all your questions regarding the Elliott Wave Principle!
Cryptos are updated every day of the week and on Saturday, if necessary.
Traditional assets are updated every day of the week.
Elliott wave & Fibonacci labelling:
Common path in white, bullish count in green, bearish count in red.