Microsoft - This might be the ultimate breakout!Microsoft - NASDAQ:MSFT - will break the all time high:
(click chart above to see the in depth analysis👆🏻)
If you wonder why Microsoft has been rallying +15% this month, market structure will give you an answer. In fact, the recent bullish break and retest was totally expected, and if we take into account the recent quite strong bullish behaviour, an all time high breakout will follow soon.
Levels to watch: $450
Keep your long term vision!
Philip (BasicTrading)
Search in ideas for "MICROSOFT"

Microsoft - This Will Lead To Trouble!Microsoft ( NASDAQ:MSFT ) shows some clear weakness:
Click chart above to see the detailed analysis👆🏻
Back in mid 2024 Microsoft created another new all time high and in doing so also retested the major upper resistance trendline of the longer term rising channel formation. Following this bearish retest, a correction is very expected before we then see the bullish trend continuation.
Levels to watch: $350
Keep your long term vision,
Philip (BasicTrading)

Microsoft - Short Term Top Formation!Microsoft ( NASDAQ:MSFT ) could create a short term correction:
Click chart above to see the detailed analysis👆🏻
Almost for the entire year of 2024, Microsoft has been moving sideways and respecting the upper channel resistance trendline. It is quite likely that we will see a correction, considering that buyers are still weak, before we then see the overall trend continuation.
Levels to watch: $350
Keep your long term vision,
Philip (BasicTrading)

Microsoft (MSFT): Can Earnings Sustain the Trend Channel?With Microsoft set to report earnings, investors are keenly watching updates on AI-related spending, especially growth within Azure and Copilot, as well as broader financials. A significant focus will be on capital expenditures (Capex) for generative AI initiatives, expected to rise from $9.92 billion a year ago to an estimated $14.74 billion in this recent quarter. Beyond revenue and earnings, the market is waiting to see how these hefty investments are shaping the company’s growth trajectory.
Technically, NASDAQ:MSFT continues to test the lower bound of its trend channel—a level that may weaken with repeated retests. The stock’s reaction to earnings will reveal if this support can hold. The formation suggests a potential head and shoulders pattern, particularly if NASDAQ:MSFT dips below the neckline support at $388 with declining volume.
For now, we’re maintaining our cautious outlook. If Microsoft fails to hold its key support levels, it may confirm the bearish trend we’ve been observing. As always, we’ll provide updates if any significant developments occur after the earnings report.

Microsoft-Backed Rubrik Eyes $713 Mln IPOIn a move signaling robust confidence in the cybersecurity sector, Rubrik, a Palo Alto-based firm backed by Microsoft ( NASDAQ:MSFT ), is set to embark on an initial public offering (IPO), aiming to raise up to $713 million, according to sources familiar with the matter.
The cybersecurity software company is planning to offer 23 million shares priced between $28 and $31 each, potentially valuing Rubrik at approximately $5.4 billion at the upper end of the range. This IPO initiative underscores Rubrik's strategic positioning amidst a burgeoning demand for cloud-based ransomware protection and data-backup solutions.
Rubrik's planned IPO arrives against the backdrop of a revitalized U.S. IPO market, signaling a resurgence in investor appetite following a period of subdued activity. Notable successful listings, including those of Reddit and Astera Labs, have set the stage for a wave of upcoming public offerings, with companies like Cato Networks and Synechron poised to join the fray.
Founded in 2014 by venture capitalist Bipul Sinha, Rubrik has established itself as a leader in the cybersecurity space, serving over 5,000 business clients, including industry giants like Nvidia Corp and Home Depot. The company's robust growth trajectory is evidenced by a 47% increase in subscription annual recurring revenue compared to the previous year.
However, amid its IPO preparations, Rubrik finds itself entangled in a U.S. fraud investigation related to a former employee. The U.S. Department of Justice is probing allegations that the ex-employee diverted funds from 110 contracts with Rubrik into a personal operating entity, a development that adds a layer of complexity to Rubrik's IPO journey.
Despite the regulatory scrutiny, Rubrik's IPO aspirations underscore the market's bullish outlook on cybersecurity solutions. With the backing of industry stalwarts like Microsoft and a track record of delivering cutting-edge cloud-based security services, Rubrik's public debut promises to be a significant event in the cybersecurity landscape.
As Rubrik charts its course toward the public markets, investors will be keenly watching how the company navigates the IPO process amidst regulatory challenges and capitalizes on the growing demand for cybersecurity solutions in an increasingly digitized world.

Microsoft Bullish Cup and Handle Microsoft - NASDAQ:MSFT
A bullish monthly and weekly chart:
✅Monthly MACD Cross
✅ Long Term parallel channel intact
✅ Above 200 day & week MA
✅ Cup and Handle (with a high handle - Preferred)
✅ Good Risk: Reward Ratio at 7.6 (51%+ vs -7% loss)
⚠️ Stop loss levels on chart 🫡
A great set up. Those that are patient could wait for a potential pull back (arrow on chart) as we are reaching into overbought levels on the RSI on the weekly. It would not be unusual for Microsoft to pull back 5-8%. The R:R would be significantly improved if you waited and if it led to an entry from approx. $350 (after a 5-8% pull back), this would line up with the 200 DSMA also. However there are no guarantees of a pull back.
Those half as cautious could enter half a position here and see what happens and place another entry at $350.
All in all the $330 - 335 red box area on the chart is an absolute stop loss level. If this level is lost I would be out of the trade fast.
So you have options with this set up:
1) Entry here with a tight 7% stop.
2) Half a position here and half at approx. $350 with a stop at $335.
3) You wait for $350 and you place your stop at $330.
These all result in a similar loss of 5 - 7% in the event the trade fails. The upside potential is always 50%+. You can always cut early also at target one and take something at the 26% profit level.
It important you take full responsibility for your trade, position accordingly and be ok with the small 5-7% loss as it will likely happen, we are only leaning on the probability that maybe 60-70% of the time these trade set up provide us the return we want.
I have not really ventured into the earnings or dividends however they are both positive contributors to this trade as earnings have been excellent and dividends whilst minimal, are dividends at the end of the day. We are here for the trade and play a set up off the chart. The fundamental's are just nice framing for the stock in our minds eye.
PUKA

Microsoft Chart Update: Key Levels to Watch Now!⚠️Examining Microsoft 's NASDAQ:MSFT 2-hour chart , we see the end of Wave ((v)) at $415, coinciding with a challenging earning call. Currently, we expect short-term support at the Wave ((iv)) level, around $364, and aim to stay above the 61.8% mark of $349.
📉 As we're potentially starting a long-term Wave II, we anticipate finding initial support without a significant breakdown. The 2-day chart suggests we might be nearing the cycle's end, with Wave 5's potential range between $388 and $430. If a pivot at 38 to 50% happens it could lead to new highs, indicating the current cycle isn't over yet and we have to see wave 5. If not, a deeper correction to at least $214, the previous Wave (4) level from November 2022, is plausible.
😷 The pandemic level at $136 also remains within the realm of possibility for Wave II. This reflects the market's need for corrections after strong upward momentum in recent years. Please keep in mind that there is no chart on this world that is growing without corrections and if you zoom out on all big bad events, they are about non existing and so will it be if Microsoft or other will have a larger pullback!

Microsoft Stock To Keep In Portfolio!Hello ladies and gentlemen, according to my graphical analysis of Microsoft , I recommend for the moment to keep Microsoft Stock in your portfolio because there is a great probability of reaching 315$ in the next few weeks .

Microsoft - Long PositionThere's A Lot To Like About Microsoft's Upcoming US$0.62 Dividend. The company's next dividend payment will be US$0.62 per share, and in the last 12 months, the company paid a total of US$2.48 per share. Last year's total dividend payments show that Microsoft has a trailing yield of 0.9% on the current share price of $261.12. Dividends are an important source of income to many shareholders, but the health of the business is crucial to maintaining those dividends. That's why we should always check whether the dividend payments appear sustainable, and if the company is growing.

Microsoft share going to cross their limitsBuy Microsoft shares because it going to over 500 USD in the coming months. Microsoft purchased many game studios for its metaverse.
Advise by Anshu Sharma (follow me: @anshusharmavats

Microsoft weekly analysis (MSFT)Hello everyone , as we all know the market action discounts everything :)
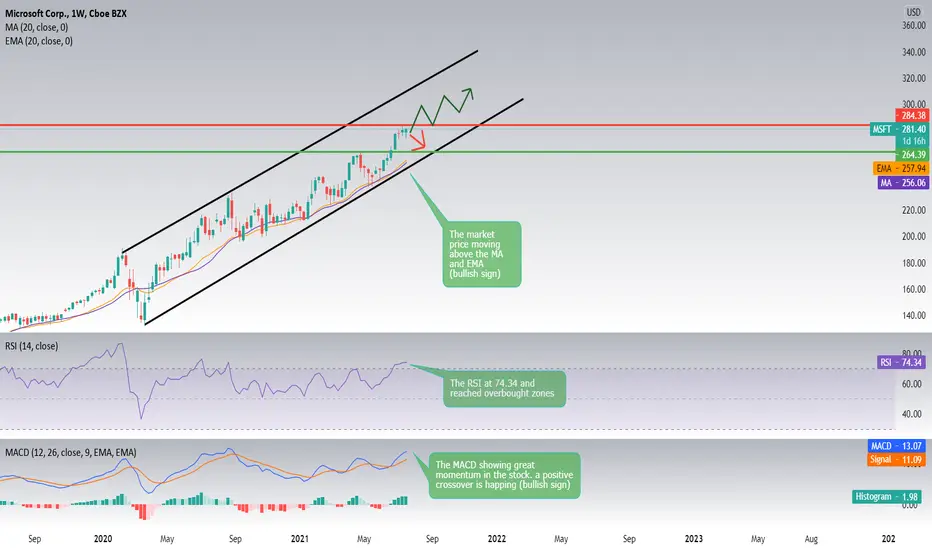
The MSFT seems to continue its bullish movement and the stock price seems to be trading in an upward channel as we are getting higher highs and higher lows, MSFT is currently trading near its 52 week high, which is a good sign. The S&P500 Index is also trading near new highs, which makes the performance in line with the market.
The average volume is 23872600. This is a good sign as it is always nice to have a liquid stock.
The long and short term trends are both positive. This is looking good! We could be seeing the price reaching a new high soon and even maybe hitting the ranges if 290.
using different indicators to understand the trend where :
1_The stock price at 281.40 trending above the MA and the EMA. MA at 256.06 and EMA at 257.94 (bullish sign)
2_The RSI is at 74.34 and reached overbought zones showing great strength in the market with no divergences between the market and the indicator. (bullish sign)
3_The MACD showing great momentum in the stock. a positive crossover is happing (bullish sign)
Support & Resistance points :
support Resistance
1_ 276.86 1_284.38
2_ 272.96 2_288.00
3_ 269.34 3_291.90
Fundamental point of view :
MSFT's return on assets of 18.13% is amongst the best returns of the industry. MSFT outperforms 95% of its industry peers. The industry average return on assets is -4.03%.
The stock has a profit margin of 35.02%. This is amongst the best returns in the industry. The industry average is -8.63%. MSFT outperforms 95% of its industry peers.
Microsoft said Wednesday it’s acquiring CloudKnox, a start-up whose software helps companies reduce the amount of access they provide to their cloud resources. Terms of the deal weren’t disclosed.
The move represents another step Microsoft is taking to expand its security business, in addition to working to keep Windows and its other products secure.
Over the past 5 years, MSFT shows a quite strong growth in Earnings Per Share. The EPS has been growing by 18.13% on average per year. And the stock has a Current Ratio of 2.29. This indicates that MSFT is financially healthy and has no problem in meeting its short term obligations.
_____________________________________________Make sure to Follow and Like for more content_____________________________________________
This is my personal opinion done with technical analysis of the market price and research online from fundamental analysts for The Fundamental point of view , not financial advice.
If you have any questions please ask and have a great day !!
Thank you for reading.
NASDAQ:MSFT Microsoft stock price forecast, Buy, Target 835Microsoft (NASDAQ: MSFT)
Trade : Buy
Entry : 214
Target : 835 (621, +290.19%)
Stop : 198 (-16, -7.48%)
Posted on Monday, December 7, 2020 (Blog)
Note : How high will Microsoft stock rise? If my view is right, its price may go over 800. Probably, people would say "crazy". The peak of the price would be a level unimaginable. Resistances could be 310, 485 and 835. Supports could be 198.5 and 162. When the price drop, it would be better to find opportunities to buy. The world is awash with paper money that will fire stock prices into the sky. At this moment, their dollar printing machines are working at the maximum speed, and they will continue without any pause.

MICROSOFT BREAKOUT LONG|TRADING PLAN|OPTION CHAIN|
The child of Bill Gates has no limits and has been a rocket lately, leaving the pre-covid all time high far behind.
At a closer look, the stock is moving in an upward diagonal channel, and has formed a bullish flag/triangle.
It seems like the Microsoft train is still full of steam, and therefore, our target trade is a long.
TRADING PLAN:
1- one might be going long inside the trading session in the hope of the speedy breakout(not overnight, as the stock might gap down and wipe out your entire deposit as the stop loss orders won't work till the opening of the trading session)
2-one might wait for the confirmed breakout, and then go long after pullback(safe option)
3-one might wanna play this with call options.
The option chain now looks like this:
August 28 expiration:( 3 trading sessions) |September 4 expiration(7 trading sessions+weekend gap) |September 11(12 trading sessions+2 weekend gaps)
strike 1= 220.00=1.03 usd =2.64usd =3,7usd
strike 2=222.5=0,5 usd =1.9usd =2,94usd
The 0,5 usd 3 seession gamble actually looks pretty good.
7 session 2.64 seems like a reliable option, if you believe in the breakout, but the risk reward is lower. One might wanna wait if the price drops a bit, within the triangle and then buy the calls, but you risk missing the breakout.
Thats about it, on Microsoft for today, thank you for reading, like and subscribe and have a nice day!

Microsoft Vs other major asset classesThe chart depicts the percentage rise in value of Microsoft Shares vs. other major assets like Gold, Silver, Platinum, Palladium, Barrack Gold that are generally considered to be safe heavens. There is a reason why investors do not go all out into these safe heaven. The questions is this: Is it time to put your money into Microsoft and Tesla or should we wait now. Have we missed out the train? Has the era of Technology about to end like the dot com bubble?

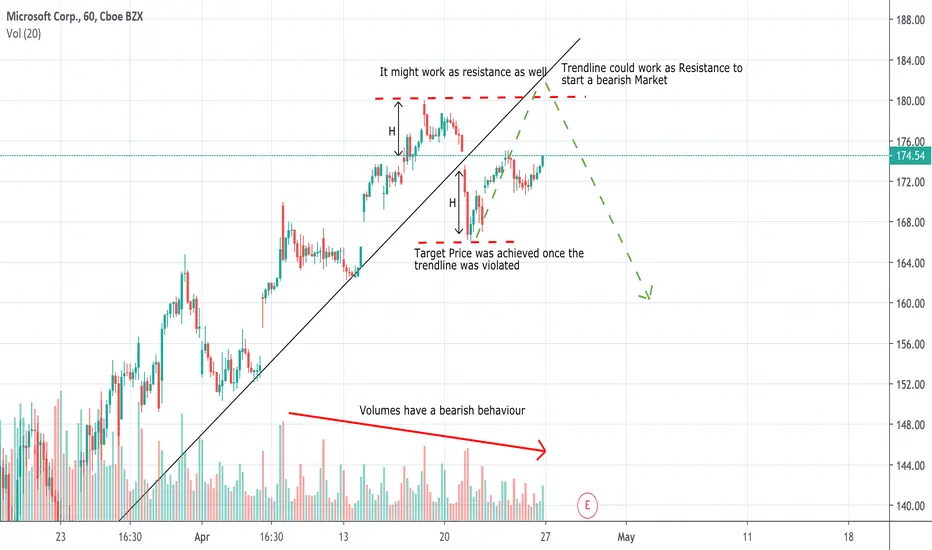
Microsoft Stock - Technical analysis ConsiderationThe market is Bullish, but the Violation of the trend line (it is not a very strong trendline) and the volume in the bearish direction should give us a warning.
Can it be a reversal signal? we need to wait a couple of days and perhaps we should wait for the Financial Q3 Report.
Microsoft will report fiscal Q3 2020 earnings after the market close on Wednesday and the outcome seems to be positive.
The fundamental says that the Financial results should be positive, so ideally we should go long, but technical analysis gives us a warning for now. I might be wrong, but really I doubt that Microsoft will not be impacted by the CoronaVirus and do not forget that generally Market do not follow the most logical economic path.
Microsoft Push Tech Stocks Higher Amid Trade WorriesPreviously, the mounting of U.S. tech stocks was recorded. The gains in Apple, Microsoft, and Merck & Co occurred when investors set aside doubts regarding the U.S.-China trade dispute.
Shares of Apple Inc grew 2.4%. The increase was after sales of the company’s newest iPhones were off to a robust start. The information was according to Chief Executive Officer Tim Cook that he then stated in a German news report.
Meanwhile, JP Morgan elevated its forecast for shipment volumes.
In fact, Apple is battling to shift its shrinking iPhone sales amid dull global demand for smartphones.
The rise of 0.9% in Microsoft Corp., together with the S&P 500 technology index also buoyed stocks.
However, sentiment on Wall Street got an additional improvement after White House trade adviser Peter Navarro discharged reports.
The report was in regard to the Trump administration considering of delisting Chinese companies from U.S. stock exchanges as “fake news.”
On Friday, fears related to those rumors had sent the S&P 500 and Nasdaq to a more than three-week low.
The Different Impacts of The Trade Dispute
Chief executive officer of Ladenburg Thalmann Asset Management in New York, Phil Blancato, said, “This idea of using different types of levers that impact trade negotiations is something that we will get accustomed to.”
On the other side, U.S.-listed shares of Chinese companies Alibaba Group Holding Ltd and Baidu Inc increased 0.8% and 1.5%, respectively.
In October, the schedule of the next round of high-stakes trade talks between the world’s two largest economies will take place.
So far this year, Wall Street’s main indexes are on course to end September with the weakest quarterly performance. They were rattling due to a multitude of factors, including an increase in U.S.-China trade strains.
The Dow Jones Industrial Average grew 0.36% to end at 26,916.83 points.
Meanwhile, the S&P 500 also added 0.50% to 2,976.73 with the Nasdaq Composite that has improved 0.75% to 7,999.34.
For the month, the S&P 500 gained 1.7%, the Dow gained 2.1%, and the Nasdaq rose 0.5%.
For the third quarter, the S&P 500 and Dow inched up 1.2%, while the Nasdaq curved in 0.1%.

Microsoft Corp (MSFT) $130.00 >>> $126.10 (Profit:Risk=2:1)NASDAQ:MSFT
Microsoft Corp
Information:
Our figure is a divergent moving triangle less common.
In coming days, I expect a correction on the shares of Microsoft Corp. S&P 500 also looks at correction.
About stop loss:
Stop loss 1.50%
------
Sell Limit = $130.00
Take Profit = $126.10
Stop Loss = $131.92
------
Profit:Risk = 2 : 1
Profit:Risk = +3.00% : -1.50%

Microsoft Bullish Flag Breakout We see that Microsoft had formed a bullish flag due to profit taking resulting in lower prices as traders sell the stock. However prices broke out of the bullish flag as prices bounced off the long term downtrend line from the beginning of Oct 18. Therefore we expect Microsoft to continue it's uptrend so we remain long the stock and await the earnings announcement on the 24th of April.

Microsoft long-term mega bullAre you still crazy about cryptocurrencies? How about traditional markets, for example Microsoft (MSFT) stock?
Cool guys from Redmond are actively developing a lot of new IT sectors, and in the following years their activity should bring great profits to their shareholders.
MSFT has entered a new global cycle of growth, which is going to be as exciting as it was in 80s/90s.
The rise of the machines and human enslavement will run under good patronage of Microsoft corporation. So, why not become a co-owner of the enslavers, while it's not too late? :)

Microsoft can still go up, but not muchOn daily:
CCI was up when earnings were reported, now it fell just below the 0 line.
RSI and MACD are down, not really following stock's price direction, so it should get bearish, but I feel it will make a jump then make all daily indicators go up from the middle of the indicator's chart parameters.
ADX says bull trend is over and DMI has crossed a bearish point.
The trend lines forming a triangle would indicate price will stay likely in that triangle and not go anywhere else.
MSFT is above 50 day EMA and 200 day EMA.
50 day EMA is currently at 46 and in the days to come it will rise a bit.
200 day EMA is at 44.50 and is likely to stay there
If price manages to keep the last day's downtrend, sustained by gravestone doji on daily chart on thursday, it is likely to touch the 50 day EMA, and if it goes lower, it will touch both the trend line and the 200 day EMA.
My theory is that MSFT will likely stay in the triangle, either by bouncing off at 50 day EMA or 200 day EMA+ trendline.
After that, it can go up. If it goes lower into the triangle and goes below 200 day EMA at 45, next target will be 40.
Since is summer, there's a chance stocks will fall.
As for 1h timeframe, any price break below 46.50 means short. For now, microsoft short. Long term, microsoft long
You should consider the S&P bubble that is about to burst due to high volatility in the markets


Microsoft - Breaking TradeThere was a great breakout trade opportunity on Microsoft's stock, enhanced by a refined entry strategy. The red zone highlights a key resistance level where the price struggled to break through. A breakout occurred with a strong bullish candlestick, confirming buyers' strength.
Thank you for reading! If you found this content helpful, don’t forget to like, comment, and share the idea. Follow me on TradingView!

Microsoft Corp.Hello,
Daily chart of Microsoft stock, with regression line and volumes.
The price has just broken out of the channel.
Make your opinion, before placing an order.
► Thank you for boosting, commenting, subscribing!
