Microsoft Corp Hello,
A quick look with the Adaptive Trend Finder indicator on the Microsoft stock, with a daily chart.
I have set the medium-term and short-term settings.
We can see that the price is working at the bottom of the channel, so watch it.
The medium-term trend is bullish.
Make your own opinion before placing an order.
► Thank you for boosting, commenting, subscribing!
Search in ideas for "MICROSOFT"

Microsoft risks shown in chartThe biggest stocks in the market, from the technology sector, tops on July 2024. Now they are showing some concerning data. The weak RSI and Fibonacci retracement levels perfectly match previous support and resistance levels. There are also other concerning factors.
Microsoft is showing a weak RSI in the latest move-ups. Maybe it needs to find liquidity in the 0.382 FIB level around 370$.

Go Long, Go Wealth (Microsoft)Microsoft made a significant move today. Based on my analysis, the price is expected to retrace to either the $438 or $429 level.
I anticipate that the price will stabilize at one of these levels before a potential reversal occurs.
Although I am not directly trading MSFT, I have invested in SPUS, which is following a similar trajectory.

Microsoft MSFT - Almost back at All-Time HighsOne confirmation that the market is in recovery: Major stocks, such as Microsoft, are approaching All-time High levels again. MSFT has been trending upward above the 50 and 200 Day EMAa for several weeks. While others are talking doom and gloom for the markets, you have evidence that they missed the bottom and are only hoping for a second chance. Of course fundamentals always trump technicals. Anything can happen. Fed rate hikes with the debt ceiling looming could result in the perfect storm. Setting all of that aside, the technicals say we are going to the moon. So, put on your space suit rocket man.

Bitcoin Vs Microsoft - Similarities - You be the judge :)Is bitcoin following Microsoft to the TOP? CRYPTOCAP:BTC NASDAQ:MSFT

Microsoft (MSFT): Climbing to New Heights or Ready for Reversal?For Microsoft, we've recently observed an uptick and, for visualisation, activated the 100% level on the two-day chart as a maximum target. A closer look on the two-hour chart suggests that we might be in the final wave, Wave 5. Since developing Waves ((iii)) and ((iv)), we've formed four more waves and are now approaching a new all-time high. We consider a maximum of $450 to be realistic, though further increases are possible. After such a substantial rise, we expect the target range to be between 38.6% and 54%, around $450. This area could be intriguing to monitor for a potential trend reversal. If such a reversal occurs around $450, we would look out for possible short positions. However, should we significantly surpass this level, which we currently don't anticipate, we would seek long positions. Depending on these developments, we'll adjust our strategy accordingly.

Microsoft EW Analysis in 4hr time frameHello friends. We see the chart of Microsoft stock and this analysis by EW so be assumed start the 4th wave by abc moving I hope the price touch the 372 $ zone.

buy microsoftmicrosoft is doing good with gamepass and chat gpt also.
This bad boy is about to blow to 315 soon>
I see some exciting pattern from the chart.
Looks like earning will be nice also.

Microsoft’s Metaverse hype
The acquisition of Activision Blizzard could mark a new phase in Microsoft's metaverse development.

Microsoft Long Alltime High hit Earnings New 52-week highs this week, powered by the Dow which, on Friday, extended its streak of positive days to ten — something the blue chip index has not done in almost six years. The Dow has been powered by, among other things, a slew of corporate financial results, particularly from the banks, which showed not only improved profitability, but also strong guidance for the next quarter and full year.
I have explained 2 bullish scenarios,1 bearish(worse case).
Bullish:
higher highs higher lows
poc uprising
volume increasing
capital flow rising
In case the Take profits hit, and we have increased volume, I will ride the trend.
I will only take profit 10% of the microsoft portfolio and let the profit run.
Exit :Stop loss or trend change signal
The mid and long term horizon is bullish. If any Profit taking level reaches, and trend continuation is signalizing that the uptrend will be continued, I will increase agressively my positions and take only 10% profits of each position.I will let the prfoits run.
This trade setup is only for trend followers and on daily TF.

MICROSOFT - KeyLevels for next weekIf you wanna take a trade on Microsoft, maybe before that, you need to conisder this KeyLevels of support and resistance areas.
Careful with longs until the 4h uptrend was broken.

Microsoft H4 As 280 Supports Target 308 NextIn this update we review the recent price action in #Microsoft and identify the next high probability trading opportunity and price objectives to target

Microsoft H1 Trading The Bullish Triangle BreakIn this update we review the recent price action in #Microsoft and identify the next high probability trading opportunity and price objectives to target

Microsoft - Extreme Bearish SentimentI see a gruesome bloodbath in the American stock market. Stocks are showing heavy bearish sentiment. Microsoft rose to as high as $349. A drop started at that price point and will continue right down to 141. A BREAK OF STRUCTURE at 141 will then send the price falling to around $14 (My Point Of Interest).
Things are really getting interesting!!!
-------------------------------------------------------------------------------------------------------------
Smart Money Concepts are king in the market. Move with the big sharks or get ravaged!!!

Microsoft to test the upper band on crossing bands I see microsoft on the short term as swing trade possibility
we just hit the mid of the channel with little more power we can go upper channel
also there is forming of HS which we still miss the right shoulder

Microsoft Trading A Complex Corrective CycleIn this update we review the recent price action in Microsoft and identify the next high probability trading opportunity and price objectives to target

Microsoft bottomed out?Microsoft - Medium Term - We look to Buy at 252.55 (stop at 236.92)
Price action looks to be forming a bottom. A bullish reverse Head and Shoulders has formed. Neckline comes in at 256.15. We have a Gap open at 252.54 from 12/12/2022 to 13/12/2023. Further upside is expected although we prefer to set longs at our bespoke support levels at 252.55, resulting in improved risk/reward.
Our profit targets will be 298.90 and 310
Resistance: 263.92 / 266.65 / 267.45
Support: 252.55 / 242.21 / 238.21
Please be advised that the information presented on TradingView is provided to Vantage (‘Vantage Global Limited’, ‘we’) by a third-party provider (‘Signal Centre’). Please be reminded that you are solely responsible for the trading decisions on your account. There is a very high degree of risk involved in trading. Any information and/or content is intended entirely for research, educational and informational purposes only and does not constitute investment or consultation advice or investment strategy. The information is not tailored to the investment needs of any specific person and therefore does not involve a consideration of any of the investment objectives, financial situation or needs of any viewer that may receive it. Kindly also note that past performance is not a reliable indicator of future results. Actual results may differ materially from those anticipated in forward-looking or past performance statements. We assume no liability as to the accuracy or completeness of any of the information and/or content provided herein and the Company cannot be held responsible for any omission, mistake nor for any loss or damage including without limitation to any loss of profit which may arise from reliance on any information supplied by Signal Centre.

Microsoft Potential Pitchfork PlayIn this update we review the recent price action in Microsoft and identify the next high probability trading opportunity and price objectives to target

Microsoft bounce off supportHello my friends. MSFT is bouncing off it’s old support line. The support line is about a year old and seems to be pretty strong. I believe the Microsoft share price to reach its top resistance line before the next earnings report.

MSFT Microsoft Issued a Warning to InvestorsMicrosoft lowered its fiscal fourth-quarter earnings per share guidance:
$2.24 to $2.32 per share VS $2.28 to $2.35 per share prior VS $2.33 per share consensus expectations
Revenue guidance:
$51.94 - $52.74 billion VS $52.4 billion - $53.2 billion prior VS $52.87 billion consensus expectations
The price targets that i am watching for buying puts are $245 and $232.
Looking forward to read your opinion about it.

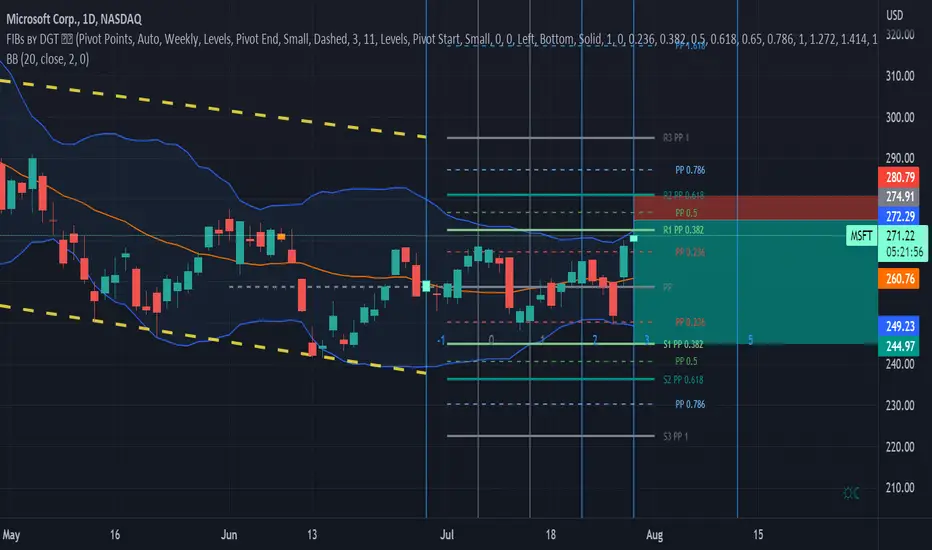
Microsoft Short PositionCurrently trading around $270, Microsoft is priced close to this month’s R1, PP1 pivot resistance level. Currently priced bellow this weaker resistance level the stock is trading above its central PP level. Furthermore, using a 20-day ranged Bollinger investors can see that the price currently lies just below its upper bound. In fact, the upper bound is equal to the R1, PP1 resistance level supporting a bareish sentiment.
Based on these signals, it would be reasonable to assume a bareish correction towards its support. However, it would also be reasonable to assume more bullish movement towards it’s PP1 resistance pivot before any bareish corrections were to occur. Based on buy trends represented by the green candles, it would seem as though there will be modest bullish movements before the stronger bareish corrections were to occur. This trend is represented by swing high and low patterns since the start of the year.
Therefore, we have set our purchase price in between the PP 0.5 and R1 resistance levels. We anticipate based on chart trends that the green candles will reach the price of at least $275 before any bearish corrections occur. The team have set a target price in line with the Fibonacci’s S1, PP 0.382 support pivot. The buyer should sell around $244.
Moreover, negative earnings are expected to be announced today. Therefore, expect bareish corrections in line with this report.
Microsoft (MSFT) Gaining Some StrengthHi Traders,
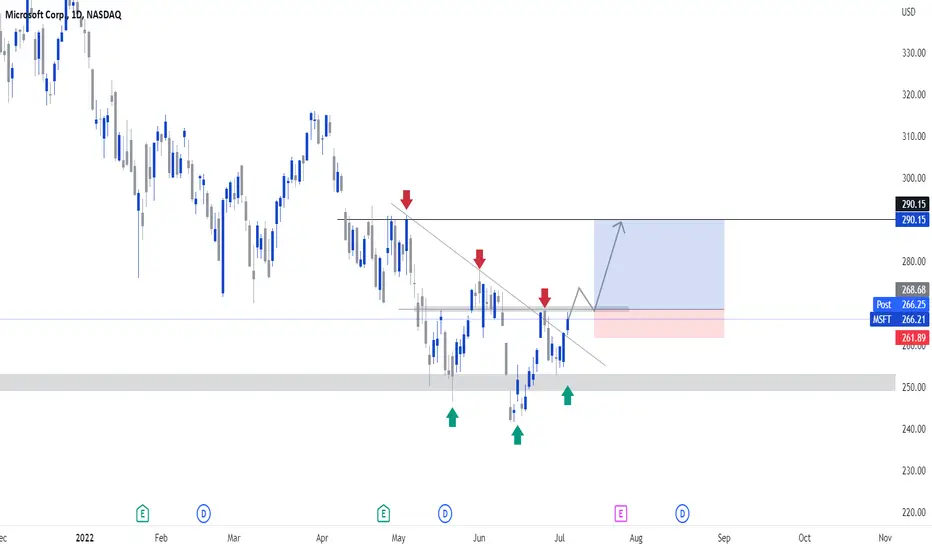
Microsoft seems to be gaining some strength. Could this be the start of a bullish move? Only time will tell. Price started creating an Inverse head and shoulders pattern which could be the first sign of a reversal. On the monthly, I have mapped out a level of 250.0 which is an order block that was never tested.
Price then proceeds to create the reversal pattern. We also see that we have now started breaking my descending trend line but it meets a previous resistance level. A break and close above this level is what captures my interest as this could give an easy move to upside upon a retest.
Keep in mind that we are still in a bear market and this could just be a pullback for the bearish continuation so I will be extremely aggressive in managing my position should I take one.
The key reason why I am optimistic is because the Pattern has created a lower high which could fuel the bulls to break the resistance of 168.95. this would also then create a new higher high. Very simple structural movement but yet very powerful in most markets. The next key play would be the pullback after the break which needs to form some sort of support and give signs of exhaustion to fuel another bullish leg.
The next point of interest in my radar will be 290.15 where I will look to take profit. As previously mentioned this is still a counter-trend move and that needs to remain at the back of the mind.
I hope this breakdown has been helpful and feel free to comment your thoughts on this analysis.
Best wishes,
Renaldo Philander.
Microsoft Targeting An Equality TestIn this update we review the recent price action in Microsoft and identify the next high probability trading opportunities and price objectives
