MICROSOFT $450 Target hit. Potential consolidation ahead.Microsoft (MSFT) easily hit our $450.00 medium-term Target that we called on our last signal (May 01, see chart below):
That call came on the most optimal buy entry, with the price right at the bottom of the 18-month Channel Up. The symmetry between the pattern's Legs is very high and based on the previous Bullish Leg (dotted Channel Up), we should now get a medium-term consolidation to test the 1D MA50 (blue trend-line) and then resume the uptrend.
The Higher High was priced just above the 1.382 Fibonacci extension level. As a result, our next Target is $480.
-------------------------------------------------------------------------------
** Please LIKE 👍, FOLLOW ✅, SHARE 🙌 and COMMENT ✍ if you enjoy this idea! Also share your ideas and charts in the comments section below! This is best way to keep it relevant, support us, keep the content here free and allow the idea to reach as many people as possible. **
-------------------------------------------------------------------------------
💸💸💸💸💸💸
👇 👇 👇 👇 👇 👇
Search in ideas for "MICROSOFT"

MICROSOFT How to trade as the Earnings approach?Microsoft (MSFT) is set to report the Earnings on Tuesday and last time we gave gave a pull-back buy signal (December 01 2023, see chart below) we caught the exact bottom:
Our original long-term Target was $460.00 but we have to downgrade it to $440.00. On the short-term it may be wise to take most or at least some of the profit if the 1D MA20 (red trend-line) as this has been a medium-term sell signal on July 26 2023. It's not just potentially lower than expected Earnings that may turn the trend bearish on the medium-term but also the Fed, which announce the Rate Decision on Wednesday.
As a result, if the price breaks below the 1D MA20, we will short and target the 1D MA100 (green trend-line) at $370.00 where we will add another long-term buy position. Notice that the 1D CCI indicator and the correlation with the 2023 price action, shows that both scenarios are equally likely at the moment.
-------------------------------------------------------------------------------
** Please LIKE 👍, FOLLOW ✅, SHARE 🙌 and COMMENT ✍ if you enjoy this idea! Also share your ideas and charts in the comments section below! This is best way to keep it relevant, support us, keep the content here free and allow the idea to reach as many people as possible. **
-------------------------------------------------------------------------------
💸💸💸💸💸💸
👇 👇 👇 👇 👇 👇

MICROSOFT LONG Trading PlanMicrosoft's software and services are closely tied to enterprise environments, and computing capabilities have never been more in demand. The shift to working from home has been a major boon for two key components of Microsoft's business.
Key Trading Plan:
i) LONG when it reaches the pull back 1 at 186.75 or pull back 2 at 178.85 with the target Take Profit point at 200.
Author:
S.I.D. Aizu

MICROSOFT Correction ahead of 1st 1D Golden Cross in 2 years?Microsoft (MSFT) is just below the $470 All Time High (ATH) and last technical Resistance, following the remarkable rally on the April 07 2025 bottom.
By the first week of June, it should technically form a 1D Golden Cross, which will be its first in more than 2 years (since March 17 2025). That Golden Cross was formed just after the price pulled-back on the 0.382 - 0.5 Fibonacci retracement Zone, finding support on its 1D MA50 (blue trend-line) and rebounding.
As a result, it is quite possible to see a short-term correction to at least $420 before the 1D Golden Cross restores the bullish sentiment. That previous structure eventually hit the -1.0 Fibonacci extension, before the next 1D MA50 test. We therefore expect to see $630 in 2025 before a 1D MA50 correction again.
-------------------------------------------------------------------------------
** Please LIKE 👍, FOLLOW ✅, SHARE 🙌 and COMMENT ✍ if you enjoy this idea! Also share your ideas and charts in the comments section below! This is best way to keep it relevant, support us, keep the content here free and allow the idea to reach as many people as possible. **
-------------------------------------------------------------------------------
💸💸💸💸💸💸
👇 👇 👇 👇 👇 👇

MICROSOFT On 4th largest correction in 15 years. Buy or trap?Microsoft (MSFT) has corrected by -26.50% from its All Time High (ATH), representing the 4th biggest correction since June 2010, which was the first pull-ack after the historic 2008 Housing Crisis.
At the same time the 1W RSI hit the 30.00 oversold limit for the first time since that low of June 2010! Not even the Housing bottom didn't exhibit such low 1W RSI.
All while the current Tariff War correction stopped a little before testing the 1W MA200 (orange trend-line), which has been the long-term Support since 2011 and was last hit (for the 2nd time during that time span) in December 2022 during the previous Inflation Crisis.
As a result, this is a unique long-term buy opportunity for such a tech giant. The 2010 rebound hit the 0.786 Fibonacci level before pulling back while the rally that was initiated after the 2022 Inflation Crisis bottom reached +117.45%.
Based on the above, we have a medium-term Target on MSFT at $440 (Fib 0.786) and a long-term at $700 (+100%).
-------------------------------------------------------------------------------
** Please LIKE 👍, FOLLOW ✅, SHARE 🙌 and COMMENT ✍ if you enjoy this idea! Also share your ideas and charts in the comments section below! This is best way to keep it relevant, support us, keep the content here free and allow the idea to reach as many people as possible. **
-------------------------------------------------------------------------------
💸💸💸💸💸💸
👇 👇 👇 👇 👇 👇

MICROSOFT Channel Down bottom formation targets $440.Microsoft (MSFT) has been trading within a Channel Down since the July 05 2024 High. The stock is on its latest Bearish Leg in the past 3 months and almost completed a -17.62% decline, similar with the Bearish Leg that led to the August 05 2024 Low.
As the 1D RSI has Double Bottomed, which is what it did on the April 30 2024 Low that kick started a rally of +20.63%, we expect the stock to initiate its new Bullish Leg of the Channel. The previous one was +18.16%, so we expect a similar range and target $440.
-------------------------------------------------------------------------------
** Please LIKE 👍, FOLLOW ✅, SHARE 🙌 and COMMENT ✍ if you enjoy this idea! Also share your ideas and charts in the comments section below! This is best way to keep it relevant, support us, keep the content here free and allow the idea to reach as many people as possible. **
-------------------------------------------------------------------------------
💸💸💸💸💸💸
👇 👇 👇 👇 👇 👇

Microsoft Update: Key Levels to WatchMicrosoft ( NASDAQ:MSFT ) is at an important point right now, and here’s what to look out for:
If we close above $442: There’s a good chance we’ll see targets at $453 or even $478 as buyers take control.
If the price breaks down out of the current range: A correction to $422 or $415 becomes a strong possibility.
Stay focused on these levels and let the market show you the way forward. No need to force it—patience pays.
Kris/Mindbloome Exchange
Trade What You See

MICROSOFT has bottomed. Dont miss this once/year buy opportunityMicrosoft (MSFT) has been trading within a Fibonacci Channel Up since the October 2022 market bottom following the Inflation Crisis. Since the August 05 2024 Low on the 1W MA50 (blue trend-line), the stock has struggled to get detached from it and stage a sustainable rally.
This prolonged volatility can be seen however on both previous Lows of the Channel Up, while the price was attempting to price a bottom. Technically it is around the same levels as February - March 2023 (again below the 1W MA50).
As you can see, this kind of buy opportunity emerges roughly once a year on MSFT and posts a rise or roughly +50% from the bottom, with the last Higher High priced on the 1.5 Fibonacci extension.
As a result, our long-term Target is now set at $550.
-------------------------------------------------------------------------------
** Please LIKE 👍, FOLLOW ✅, SHARE 🙌 and COMMENT ✍ if you enjoy this idea! Also share your ideas and charts in the comments section below! This is best way to keep it relevant, support us, keep the content here free and allow the idea to reach as many people as possible. **
-------------------------------------------------------------------------------
💸💸💸💸💸💸
👇 👇 👇 👇 👇 👇

MICROSOFT Targeting $500 before the end of the year.Microsoft (MSFT) has made a new long-term bottom and recovered almost all of August's losses. That bottom is technically the Higher Low of the 20-month Channel Up that started in January 2023.
The price is currently consolidating below the 1D MA100 (green trend-line) and if broken, it will confirm the new Bullish Leg. In the previous (2) Bullish Legs of this Channel Up, the price tends to re-test the 1D MA50/100 cluster to confirm it as the new long-term Support after the break-out, so expect that to take place at some point.
Having though formed a new 1D MACD Bullish Cross, we can assume that this is already a safe level to buy for the long-term, as every Bullish Cross below 0.0 has technically been a confirmed buy level. Our Target for the end of the year is $500, which is still technically a 'modest' one as it is considerably below the 2.0 Fibonacci extension, which priced the March Higher High.
-------------------------------------------------------------------------------
** Please LIKE 👍, FOLLOW ✅, SHARE 🙌 and COMMENT ✍ if you enjoy this idea! Also share your ideas and charts in the comments section below! This is best way to keep it relevant, support us, keep the content here free and allow the idea to reach as many people as possible. **
-------------------------------------------------------------------------------
💸💸💸💸💸💸
👇 👇 👇 👇 👇 👇

MICROSOFT on an excellent long-term buy level.Microsoft (MSFT) has been trading within a Channel Up since the January 06 2023 low and yesterday came to the closest 1D candle closing to the bottom (Higher Lows trend-line) of the Channel Up since September 27 2023.
That was also the last Higher Low of the Channel Up, achieved exactly on the 0.382 Fibonacci retracement level from the previous Low. With the price now below the 1D MA100 (green trend-line) but still above the 1D MA200 (orange trend-line), it appears that we are on symmetrical levels with that Higher Low.
The 1D CCI patterns between the two fractals are also similar and long-term investors can start considering buying MSFT again. Our medium-term Target is $450.00.
-------------------------------------------------------------------------------
** Please LIKE 👍, FOLLOW ✅, SHARE 🙌 and COMMENT ✍ if you enjoy this idea! Also share your ideas and charts in the comments section below! This is best way to keep it relevant, support us, keep the content here free and allow the idea to reach as many people as possible. **
-------------------------------------------------------------------------------
💸💸💸💸💸💸
👇 👇 👇 👇 👇 👇

MICROSOFT The 1D MA50 will be the buy opportunity for Xmas.Microsoft (MSFT) is trading inside a Double Channel Up pattern, with the longer term one (blue) starting on the January 06 bottom while the shorter term one (dotted) starting on the September 14 High. The latter Channel Up can be seen with the same structure earlier within the long-term Channel Up as well. It started after the stock pulled back and hit the 1D MA50 (blue trend-line), which provided a strong rebound.
The same kind of 1D MA50 test took place on October 26, which initiated the current bullish leg (November). As the 1D RSI is posting a Bearish Divergence (Channel Down) simiarl to March 17 - April 12 and the 1D MACD completing a Bearish Cross, we expect one final pull-back towards the 1D MA50. That can be the ideal buy entry for the end-of-the-year rally. Our long-term target is always $460, representing a +43.50% rise from the 1D MA50 bounce (similar to March 13).
-------------------------------------------------------------------------------
** Please LIKE 👍, FOLLOW ✅, SHARE 🙌 and COMMENT ✍ if you enjoy this idea! Also share your ideas and charts in the comments section below! This is best way to keep it relevant, support us, keep the content here free and allow the idea to reach as many people as possible. **
-------------------------------------------------------------------------------
💸💸💸💸💸💸
👇 👇 👇 👇 👇 👇

MICROSOFT Final chance to buy for $380.Microsoft (MSFT) has been trading within a Channel Up on the 1D logarithmic time-frame since December. At the moment, it is on the 1D MA50 (blue trend-line) which was previously the short-term Resistance. We are also near the 0.5 Fibonacci retracement level, an important benchmark for this recovery attempt. Practically this is the new bullish leg following the bottom on the Higher Lows trend-line of the Channel Up on August 18.
The 1D RSI got rejected on the Symmetrical Resistance of the January 27 High and even since the Support Zone, the pattern seems to be on a perfect symmetry. It appears that we are on the respective 1D MA50 pull-back as on January 30. That bullish wave targeted the 1.236 Fibonacci extension before the next 1D MA50 pull-back.
As a result we are bullish, targeting the new 1.236 Fibonacci level at $380.00.
-------------------------------------------------------------------------------
** Please LIKE 👍, FOLLOW ✅, SHARE 🙌 and COMMENT ✍ if you enjoy this idea! Also share your ideas and charts in the comments section below! **
-------------------------------------------------------------------------------
💸💸💸💸💸💸
👇 👇 👇 👇 👇 👇

MICROSOFT Huge MACD Bearish Cross ahead of earnings. Still buy?Microsoft (MSFT) has been trading within a Channel Up pattern since the March 13 Low, with the 1D MA50 (blue trend-line) supporting all the way, having made no contact with the price at all. You can see that on the chart on the right (1D time-frame).
On the bigger picture, the 1W time-frame (chart on the left), the stock closed last week's 1W candle on a very discouraging Bearish Pin Bar, which is a candle formed on technical trend reversals from bullish to bearish. In addition the 1W RSI remains overbought above 70.00, despite dropping from the even higher levels of May 30.
Perhaps the strongest alarming indicator at the moment showing that the market may have hit a temporary top is the emerging Bearish Cross on the 1W MACD. Since 2020, we have seen that formation another 7 times, with 6 of them delivering a Lower Low. As a result when the 1W MACD Bearish Cross is completed, it will be more probable to see a correction, not necessarily an earth shuttering one.
But back to the 1D time-frame (chart on the right) if that happens, we will wait for a candle close below the 1D MA50 and sell, targeting the 1D MA200 (orange trend-line) on a projected contact at $300. Until this happens though, the Channel Up is on full effect and we are targeting the Internal Higher Highs trend-line at $380.
In the meantime, observe the 1D RSI, which is trading inside a Rectangle for the past 6 months and has offered accurate buy signals at its bottom and sell signals at its top.
-------------------------------------------------------------------------------
** Please LIKE 👍, FOLLOW ✅, SHARE 🙌 and COMMENT ✍ if you enjoy this idea! Also share your ideas and charts in the comments section below! **
-------------------------------------------------------------------------------
💸💸💸💸💸💸
👇 👇 👇 👇 👇 👇

MICROSOFT Remains a buy as long as the 1day MA50 holds.Microsoft / MSFT turned sideways inside the 4 month Channel Up after it hit the 350 Resistance (and All Time High) and got rejected.
The price is now approaching the bottom of the Channel Up and the 1day MA50.
The 1day MA50 has been supporting since January 26th.
As long as it holds, buy and target 360.
If the price closes a 1day candle under it, sell and target 315.
A closing under the 1day MA100, can initiate a bearish reversal.
Notice: the 1day RSI is holding its Rising Support, keeping the momentum bullish.
Follow us, like the idea and leave a comment below!!

MICROSOFT Cup and Handle targeting $320.Microsoft (MSFT) has been trading within a Channel Up pattern since the November 04 Bottom. Supported by an Inner Higher Lows trend-line, we can even see a Rising Wedge forming. Now however, it will face the most important Resistance of this uptrend, the 294.50 of the August 15 High (just below the 0.618 Fibonacci).
If rejected, we may see a Cup and Handle (C&H) pattern materializing, which can pull the price back down to the 1D MA50 (blue trend-line), even the 1D MA200 (orange trend-line). We remain bullish on MSFT but based on our long-term strategy for stocks, we will welcome such pull-back and buy it. Our next target is on the 0.786 Fibonacci at $320.
-------------------------------------------------------------------------------
** Please LIKE 👍, FOLLOW ✅, SHARE 🙌 and COMMENT ✍ if you enjoy this idea! Also share your ideas and charts in the comments section below! **
-------------------------------------------------------------------------------
💸💸💸💸💸💸
👇 👇 👇 👇 👇 👇

MICROSOFT Targeting $285 short-termMicrosoft (MSFT) is about to hit the 1D MA50 (blue trend-line) for the 3rd time since June 27. A new break should be a confirmation of that being the new Lower High rebound. The previous targeted the 0.618 Fibonacci retracement level, this is now over the Channel Down a little above 285.00.
We believe this might be the start to an even bigger and more sustainable rise as certain long-term indicators have been aligned on Support levels:
* First, the RSI on the 1W time-frame is on a Bullish Divergence, being on Higher Lows while the price action was on Lower Lows.
* Second, the 1W MACD inevitably will form a Bullish Cross, the first since October 27 2021.
* Third, the 1M MA30 (yellow trend-line) supported the previous Low, right on the Higher Lows trend-line that started back in September 18 2020.
As mentioned the 285.00 is just below the 0.618 Fib, where the 1D MA200 (orange trend-line) might be by the time it tests it, for the ultimate Resistance test.
--------------------------------------------------------------------------------------------------------
Please like, subscribe and share your ideas and charts with the community!
--------------------------------------------------------------------------------------------------------

Microsoft looks like good shortMicrosoft is under a lot of pressure right now and it looks like the bears are more likely to take control. Next possible downside could be 10% down from here. Buckle up! - HH

Microsoft: Head & ShouldersMicrosoft is forming a Weekly H&S Top
the trigger points are the minimum of January 24 and the maximum of February 2

Microsoft MSFT bullish triggerMicrosoft MSFT is showing a bullish price action on the daily time frame.
Prices could move higher from the current prices to fill the downward gap around $258.60.

Microsoft: Wait For The Breaking of TRADING RANGE before invest.Microsoft (msft) is consolidating in a trading range between 198.64 (38.2% Fibonacci level) and 217.7 (50% Fibonacci level).
- If it breaks from above , wait for the PULLBACK on the breaking line and BUY at the mentioned point, the next target will be 238.52 (61.8% Fibonacci level).
- If it breaks from below , also wait for the PULLBACK on the breaking line and SELL at the mentioned point, the 1st target will surely be 173.75.
NB: the trading range may last long , what you need to do is only to wait for the breakout of the range, so the arrows aren't showing the exact day when the breakout would occur.

Microsoft Parabolic Pattern 1155% within 10 Year#Microsoft Parabolic Pattern:
I Also Became a big FAN of This #Parabolic Pattern
2009 to now 1135% up within 11 Year
March 2010 to till now #BTC 329499900% up
Wht You can expect from #Bitcoin in 11 Year?
My Prediction=< $2000000
Please like and follow for latest crypto charts and updates.
#DYOR
Not Financial Advice

MICROSOFT: SAFE SIDEMicrosoft these days playing in the safe side.
we have on the chart 4 simple lines (whats make clear price movement) the channel lines and Support & Resistance. So, the price has 2 spikes (what mean it broke the resistance 2 times) and it's not that hard to tell that the next price step is going Down if you look to the Stochastic but you'll be confused if you look at the Bollinger Bands, which give a signs for an Up movements And that's why you should NEVER depend on Indicators. Anyway. Aftermarket open, I expect for the price to back down.
the last candlestick format shows "Evening Star Candlestick Pattern" 50% valid, why not 100%? because "Evening Star" needs 6 conditions to be confirmed:
1) Uptrend ~ Check.
2) Bullish Candle ~ Check
3) Gap Up ~ Check
4) Small Bullish Candle ~ Check
5) Gap Down ~ In progress (aftermarket open)
6) Bearish Candle ~ In progress (aftermarket open)
I don't believe $110.82 levels will be strong support because as I said the price alright Overbought so the movement down will break this support level easily.

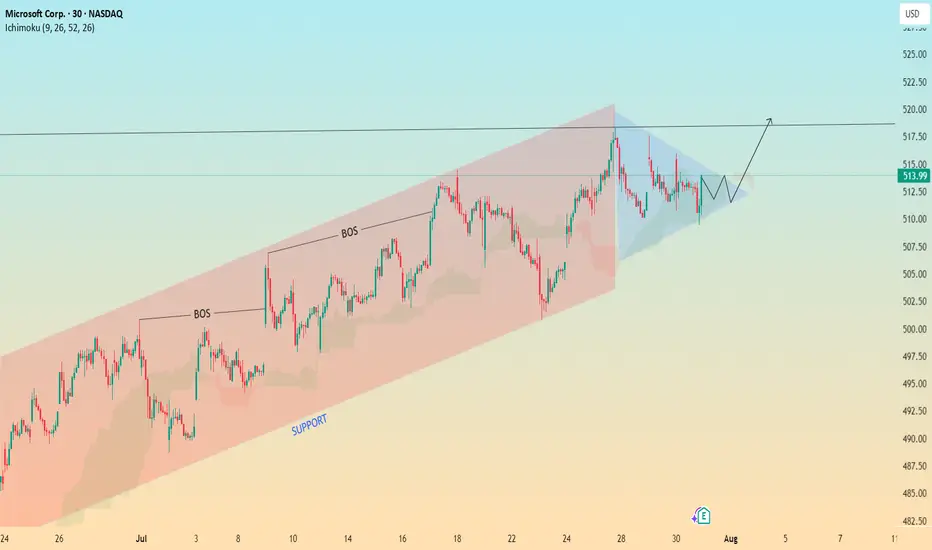
Microsoft Approaching Breakout Zone – Bulls Eyeing $522Microsoft (MSFT) Price Action Outlook – July 31, 2025
🧩 Technical Breakdown:
🔷 Trend Structure:
MSFT has been trading within a well-defined ascending channel, reflecting a strong bullish trend.
Two clean Breaks of Structure (BOS) along the trend confirm consistent higher highs and higher lows.
🔷 Support & Consolidation:
Price found solid support at the lower boundary of the channel, maintaining bullish integrity.
Recent consolidation near the upper range suggests accumulation or re-acceleration phase before a breakout.
🔷 Ichimoku Confirmation:
Price is interacting with the Ichimoku cloud, providing additional bullish confluence.
Cloud thickness is narrowing, hinting at a potential volatility expansion (likely bullish).
🔮 Projected Scenario:
✅ Primary Bias: Bullish Breakout
If price holds above the small wedge/pennant forming inside the upper channel region:
Potential breakout above $517.50–$518.00 resistance.
Target zones: $522+, in line with previous trend momentum.
⚠️ Alternative Scenario: Fakeout
Watch for any fake breakout followed by rejection and return to lower channel (~$507–510), offering re-entry zones.