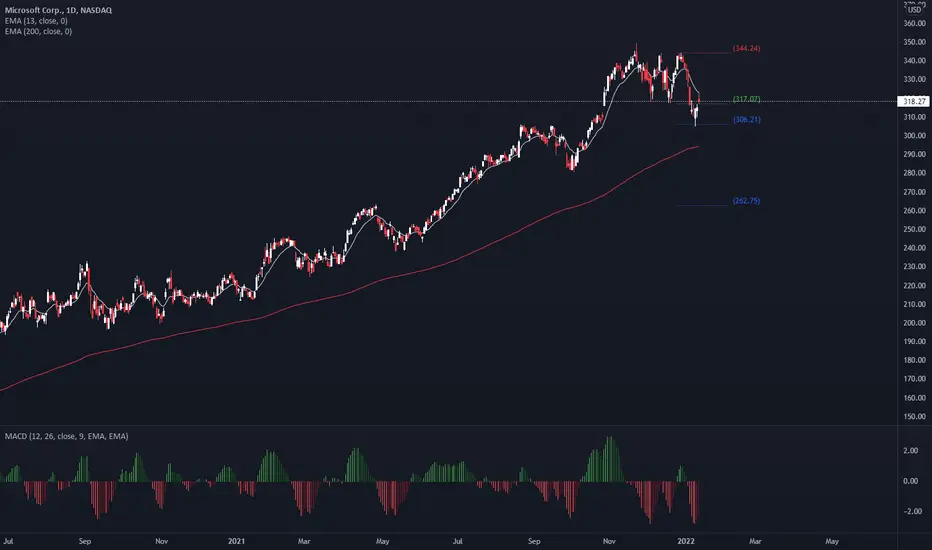
Microsoft Potential Retest of BreakoutMicrosoft has been ripping lately, but as you can see price is way outside the upper bollinger band, wouldn’t be surprised to see a retest of the breakout next week.
Not financial advice.
Search in ideas for "MICROSOFT"

MICROSOFT - Short PositionMicrosoft's Lead Kinect and HoloLens Developer Leaves the Company After Abuse Allegations

Microsoft Stocks will be BullishMicrosoft's Stocks is in a Descending Channel and Now the Price is at the Bottom of that Channel. The Price Will Start to Increase to the Top of the Channel Pretty Soon because the Fact that It is at the Bottom of the channel, makes it enough Reason to Increase and also we have a Regular Bullish Divergence on MACD Indicator as well Which is also another Reason for Us to Think about Bullish Stuff!
_ _ _ _ _ _ _ _ _ _ _ _ _ _ _ _ _ _ _ _ _ _ _ _ _ _ _ _ _ _ _ _ _
Thank you for seeing idea .
Have a nice day and Good luck

MICROSOFT - Short PositionMicrosoft should sell Office and Windows to boost cloud business, former executive says.

Microsoft Up 1739 Points!Microsoft has progressed nicely since the last post a week ago, moving up 1739 points
at the time of posting and still moving strong.
Price has not made contact with the weekly 50 simple moving average since March 2020,
but it has been using the daily 20 & 50 simple moving averages as support.
We have been seeing deep pullbacks since 2020, but from June 2021 the behaviour
of price has changed and we are seeing more of a linear clean move.
Earnings came out on July 27th, which didn’t disrupt the flow of price. A mini
consolidation has followed earnings and we now await a breakout above the current
all-time high at $290.
A break and close above the recent high will confirm a trend continuation and a move
towards the $300 round number.
How will price react to the $300 round number? This is anyone’s guess, but the
momentum should take price higher over the long term.
See below for more information on our trading techniques.
As always, keep it simple, keep it Sublime.

Microsoft Trending Towards $300!Microsoft’s movement has been relatively predictable over the last few years, as you can see
on the monthly timeframe. We have seen trends followed by consolidation/pullback, then
trends again and so on.
Currently, price is in the trend phase and there are also smaller areas of consolidation on the
daily timeframe (not shown).
The most recent consolidation period was from April this year and lasted up to last month,
where price broke above the previous all-time high at $263.
If price encounters another pullback, then the 50 simple moving average is below to catch price
and act as support. The last time price made contact with this indicator was in March 2020.
As price has remained a reasonable distance away from the 50 simple moving average,
it highlights how good the trend currently is performing.
Going forward, we want to see a more linear-looking trend develop, one with shallow
pullbacks and smaller areas of consolidation.
We now want to see price continue to trend towards the $300 round number as the
bullish momentum builds up.
See below for more information on our trading techniques.
As always, keep it simple, keep it Sublime.


MICROSOFT bounce on trendline BUYMicrosoft had great Q4 earnings, holding ground this week.
Bouncing on trendline forming an ascending triangle bullish pattern.
Will soon take off...

Microsoft Analysis before Earnings. Microsoft price now is at a very strong rejection zone, look how price acted at this zone in the past. This down move may just be a pull back for more upside. If you look at the two highlighted structures, you will notice the similarity. I will keep updating this chart if necessary. Comment, like follow for more accurate ideas. Thank you.


MICROSOFT : consolidation breakout soonMicrosoft looks like a healthy consolidation on the 4hr which is already turning bullish, expecting breakout soon
Microsoft MSFT is at a strong support - going up from hereMicrosoft MSFT is at a strong longterm 3/1 gannfan support that lines up with the 200sma atm. On shorter term timeframes it made a bullish structure by making higher lows (ascending triangle) and now the next target to break and retest will be the 50sma that will line up with the middle ganfan line between the 2/1 and 3/1 one. Overall we going to continue going up until the 2/1 top gannfan line which will slightly make higher all-time highs at around 249$ price levels

Microsoft found a strong support level and is going to reverseMicrosoft has found a double bot on the 200 ma and the 8/1 gann fan line and is now going to continue its way up until 1.618($254) level with some stops inbetween on the 2/1 gann fann line that will be the 0.618 fib level. A strong momentum shift around those strong support levels

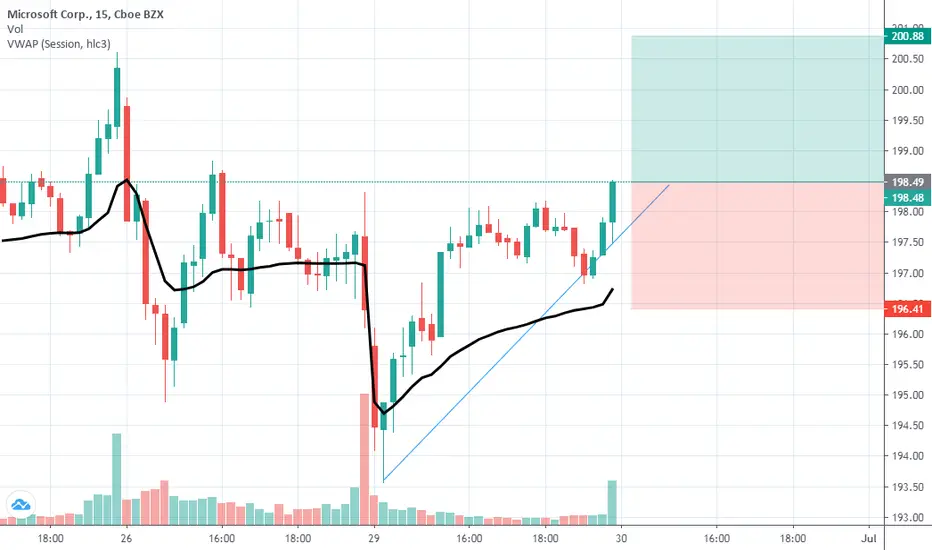
Microsoft Clearing Resistance Levels With EaseMicrosoft is looking strong and another stock that has performed well following the global pandemic
is Apple. Tech stocks, in general, have seen great results which is also evident by glancing at the Nasdaq Index.
Due to the fact that many people are working from home, it is no surprise that this sector has seen staggering
growth in a short period of time.
In the late stages of June, price smashed straight through the $200 round number, but in July price used that
level as support and is where price formed a base. Momentum started to build and we can see that the buyers
were eventually able to push price higher to eventually create new all-time highs.
This stock has a history of good long-term trends, and we may well see one in play right now. We can never
predict how long a trend will go on for but we must take advantage of the high probability trends that present
themselves to us.
As price broke out earlier this week, we should see this stock continue to fly.
See below for more information on our trading techniques.
As always, keep it simple, keep it Sublime.

Microsoft Short-Term BearMicrosoft is going on a bearish run. Did not need to do much analysis on this one to figure this out. However, I do not recommend shorting MSFT, instead, to buy the dips!
Price action target: 200
$MSFT


MICROSOFT ANALYSISMicrosoft has enter into a trading range so we cant risk to buy it for the moment . I suggest to keep eyes on it until he break the 90,60 then its a strong signal with hight probability to buy


Microsoft Corp. $MSFT#Microsoft is holding above daily 50SMA. Needs to get over $170 to start uptrend
