VNIndex Bottom 10 yearsVNIndex is getting close to the 10-year trend's bottom.
Due to the situation of force-selling pressure of many companies whose securities & bonds can't be distributed & sold. The bottom could hit hard like the black swan covid 2020
820 is the bottom of TA. 750 is the bottom of the macro situation analysis.
Search in ideas for "VNINDEX"

VNINDEX 2022-2024VNINDEX for 2022 - 2024.
23 bars down - 45%
24 bars up - 130%
next...
23 bars down - 45% until 2024/04/01
then...
uptrend again :)


VNINDEX ANALYSISVNINDEX will be form two chanel in the next time.
The fist chanel ( purple) the index will be up 1886.30, and after that go down to 1517.06, and go up 2522.92.
The second chanel ( blue) the index will be down 791.31, and after that go up 1500, and go down 1000.39 and go up 1714.41.
That analysis base on Supply- Demand technology.


VNINDEX - Dropping after touch resistance zone VNINDEX will drop after it touch resistance zone to 2 targets in below.


VNINDEXTo become a successful forex trader, you need to take the following steps:
Learning: Learn the basics of forex, finance, and economics.
Look for information sources: Look for reliable sources of information to keep up to date with market information.
Learn about trading techniques: Learn about trading techniques, such as uniform, gold , silver , etc.
Create a trading plan: Create a reasonable and meticulous trading plan, with the goal of optimizing profits and keeping capital safe.
Risk management: Manage risk effectively using risk management tools and limit the number of trades.
Always learn and improve: Always learn from your failures and successes, and keep improving your trading skills.

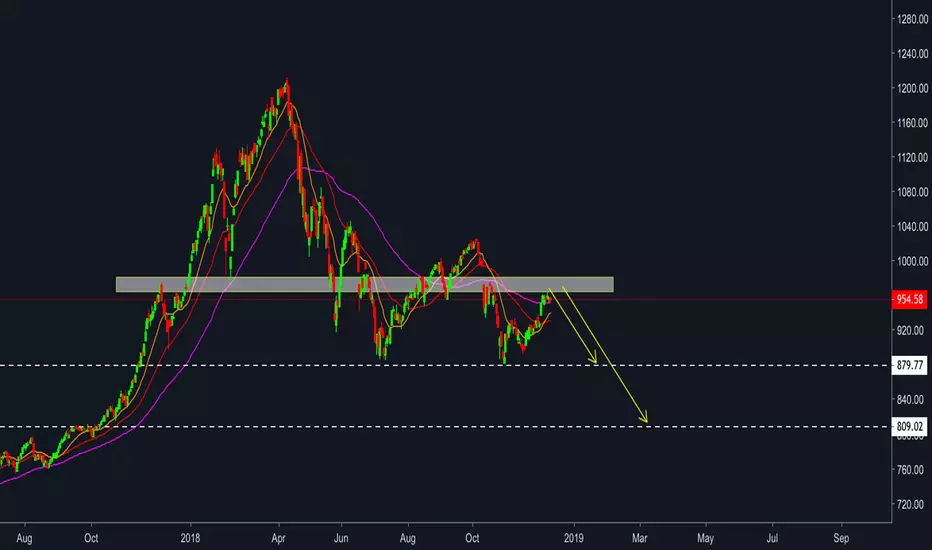
VNINDEXHOSE:VNINDEX
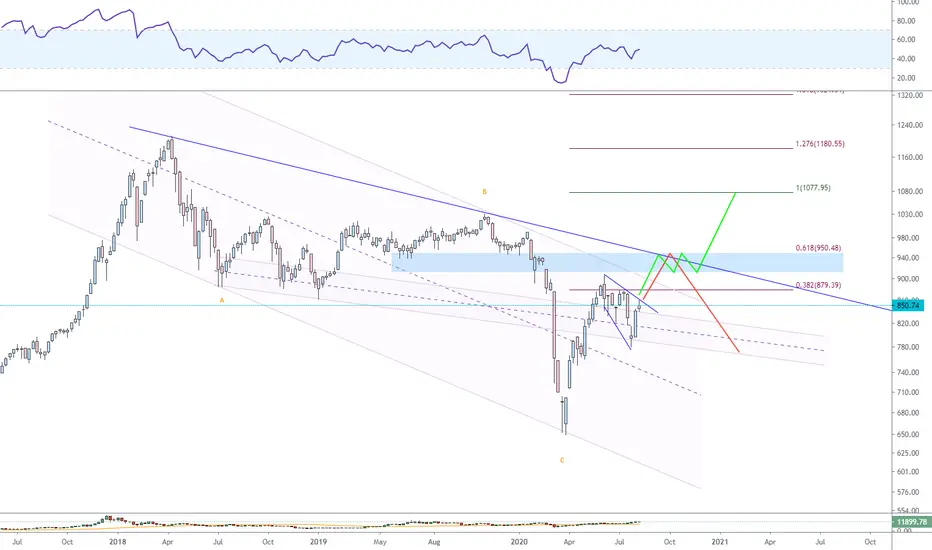
Ky vong tt se nreak tam giac tien len vung 950.
Tai day neu thi truong giu vung nay thi moc tiep theo la 1077, nguoc lai neu ap luc ban manh hon thi se quay ve vung 850 va co the sau hon.
Chien luoc giao dich vung nay la 50% tien va co phieu. Tang ti le co phieu khi thi truong pha 880 va chot lai vung 920.
Uu tien cac co phieu dang trong trend tang
VNINDEXAfter the recovery, VNIndex continued its main downtrend. In the immediate future, we will see it re-approach the previous bottom at 900. Breaking this mark, it will approach the lower mark at 750
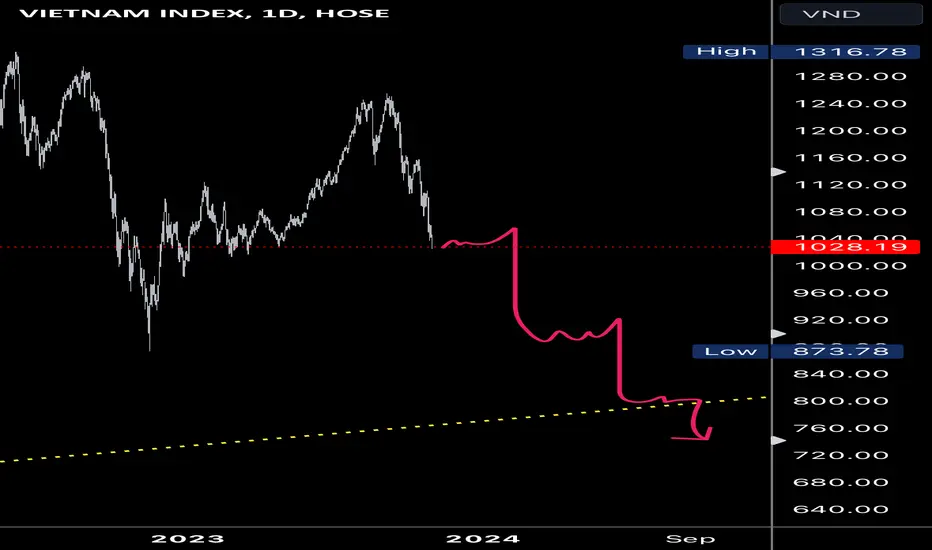
VNIndex Looking not too good here
It can go lower to 885
Then bounce from there
If something happens in the world
It can get worse


VNINDEX - 1D - DROPHello all my subscribers. Today, I will express my idea about VNINDEX movement in next couple of weeks.
1. General: Price is still in downward trend line with lower following tops (red arrow). Bull also try to get their dominance but unsuccessful with lower following bottoms. Bear completely controls the market, proved by downward's slope. That is just basic analyst, it is not strong enough for making conclusion for a strong reduction movement. Therefore, I want to consider additional indicators.
2. Trend line: from 17 May 2022 to current time, bull tried to show its resistance but last effort was destroyed by "big red candle stick" at 06 July 2022. Many blind traders say that " JUST BEAR TRAP". This is a baseless perspective. My following analyst will prove that this is not bear trap.
3. Candle stick pattern: at 15 July 2022, VNINDEX closed with inverted hammer. Beside, this candle stick just touched downward trend line and created long candle beard. The high probability that this is third lower top.
4. RSI: this is my favorite indicator, it always give me reliable signals about current fluctuation. Now, RSI is, moving 50 as proof that market is still in bear.
5. MACD: it shows us some positive considerations such as MACD line cut Signal line or histogram's slope is moving up. But it is not strong enough for reversal movement.
Conclusion:
There are two material considerations in my analyst, price broke down upward trend line and RSI is now under 50. In short-term, price also can make a small pull-back and create "dead cat bounce". Because of these reasons, I recommend that we should wait for VNINDEX reaches 946 for making next decision.
Finally, I will show you same movement in the past. Please pay your attention to my drawing range box. Price broke down upward trend line created from 28 Jan 2021. At the same time, RSI was under 50. After that, price tried to make stretched movement but finally, a super strong reduction movement happen, from 1536 to 1170.
These are all my considerations for VNINDEX. I hope that it will be useful for all of you.
Feel free leave your feedbacks and questions.

VNINDEX W1 recoverOil price is reduced, then Gold is going down from All time high.
The VND interest rate decrease consecutively, creat good condition for recovery VNINDEX.
VNINDEX can be go up to Resistance 1300.
