#SEI/USDT Looks Bearish (1H)#SEI
The price is moving in a descending channel on the 1-hour timeframe. It has reached the upper limit and is heading towards breaking it. A retest of the upper limit is expected.
We have an upward trend on the RSI indicator, which has reached near the upper limit. A downward reversal is expected.
There is a key support zone in green at 0.1342. The price has bounced from this zone multiple times and is expected to bounce again.
We have a trend of consolidation above the 100-period moving average, as we are moving close to it. This supports a downward move towards touching this level.
Entry price: 0.1300
First target: 0.1281
Second target: 0.1240
Third target: 0.1200
Stop loss: Above the resistance zone in green.
Don't forget a simple thing: capital management.
For inquiries, please leave a comment.
Thank you.
SEIUSD

#SEI/USDT - Final Support Before a Major Reversal or Breakdown#SEI
The price is moving in a descending channel on the 1-hour timeframe. It has reached the lower boundary and is heading towards a breakout, with a retest of the upper boundary expected.
We are seeing a bearish bias in the Relative Strength Index (RSI), which has reached near the lower boundary, and an upward bounce is expected.
There is a key support zone in green at 0.1146, and the price has bounced from this level several times. Another bounce is expected.
We are seeing a trend towards stabilizing above the 100-period moving average, which we are approaching, supporting the upward trend.
Entry Price: 0.1205
First Target: 0.1219
Second Target: 0.1248
Third Target: 0.1280
Remember a simple principle: Money Management.
Place your stop-loss order below the green support zone.
For any questions, please leave a comment.
Thank you.

#SEI/USDT - Final Support Before a Major Reversal or Breakdown#SEI
The price is moving in a descending channel on the 1-hour timeframe. It has reached the lower boundary and is heading towards breaking above it, with a retest of the upper boundary expected.
We have a downtrend on the RSI indicator, which has reached near the lower boundary, and an upward rebound is expected.
There is a key support zone in green at 0.1116. The price has bounced from this zone multiple times and is expected to bounce again.
We have a trend towards consolidation above the 100-period moving average, as we are moving close to it, which supports the upward movement.
Entry price: 0.1130
First target: 0.1139
Second target: 0.1158
Third target: 0.1179
Stop loss: Below the support zone in green.
Don't forget a simple thing: capital management.
For inquiries, please leave a comment.
Thank you.

#SEI/USDT - Final Support Before a Major Reversal or Breakdown#SEI
The price is moving in a descending channel on the 1-hour timeframe. It has reached the lower boundary and is heading towards breaking above it, with a retest of the upper boundary expected.
We have a downtrend on the RSI indicator, which has reached near the lower boundary, and an upward rebound is expected.
There is a key support zone in green at 0.1071. The price has bounced from this zone multiple times and is expected to bounce again.
We have a trend towards consolidation above the 100-period moving average, as we are moving close to it, which supports the upward movement.
Entry price: 0.1082
First target: 0.1094
Second target: 0.1112
Third target: 0.1135
Don't forget a simple principle: money management.
Place your stop-loss below the support zone in green.
For any questions, please leave a comment.
Thank you.

#SEI/USDT - Final Support Before a Major Reversal or Breakdown#SEI
The price is moving in a descending channel on the 1-hour timeframe. It has reached the lower boundary and is heading towards breaking above it, with a retest of the upper boundary expected.
We have a downtrend on the RSI indicator, which has reached near the lower boundary, and an upward rebound is expected.
There is a key support zone in green at 0.1330. The price has bounced from this level multiple times and is expected to bounce again.
We have a trend towards consolidation above the 100-period moving average, as we are moving close to it, which supports the upward movement.
Entry price: 0.1342
First target: 0.1388
Second target: 0.1440
Third target: 0.1508
Don't forget a simple principle: money management.
Place your stop-loss below the support zone in green.
For any questions, please leave a comment.
Thank you.

#SEI/USDT - Final Support Before a Major Reversal or Breakdown#SEI
The price is moving in a descending channel on the 1-hour timeframe. It has reached the lower boundary and is heading towards a breakout, with a retest of the upper boundary expected.
We are seeing a bearish trend in the Relative Strength Index (RSI), which has reached near the lower boundary, and an upward bounce is expected.
There is a key support zone in green at 0.1235, and the price has bounced from this level several times. Another bounce is expected.
We are seeing a trend towards stabilizing above the 100-period moving average, which we are approaching, supporting the upward trend.
Entry Price: 0.1262
First Target: 0.1295
Second Target: 0.1325
Third Target: 0.1362
Remember a simple principle: Money Management.
Place your stop-loss order below the green support zone.
For any questions, please leave a comment.
Thank you.
#SEI/USDT - Final Support Before a Major Reversal or Breakdown#SEI
The price is moving in a descending channel on the 1-hour timeframe. It has reached the lower boundary and is heading towards breaking above it, with a retest of the upper boundary expected.
We have a downtrend on the RSI indicator, which has reached near the lower boundary, and an upward rebound is expected.
There is a key support zone in green at 0.1205. The price has bounced from this zone multiple times and is expected to bounce again.
We have a trend towards consolidation above the 100-period moving average, as we are moving close to it, which supports the upward movement.
Entry price: 0.1222
First target: 0.1233
Second target: 0.1257
Third target: 0.1285
Don't forget a simple principle: money management.
Place your stop-loss order below the green support zone.
For any questions, please leave a comment.
Thank you.

SEI Looks Bearish (3D)First of all, pay attention to the timeframe | it’s the 3D timeframe.
It seems that, in the larger view, SEI is within a major corrective pattern, and wave D of this pattern has recently been completed.
It appears that wave E of the higher-degree corrective structure on SEI has begun. The price is expected to be rejected from the red zone for several months to form wave E.
A daily candle closing above the invalidation level will invalidate this analysis.
For risk management, please don't forget stop loss and capital management
Comment if you have any questions
Thank You

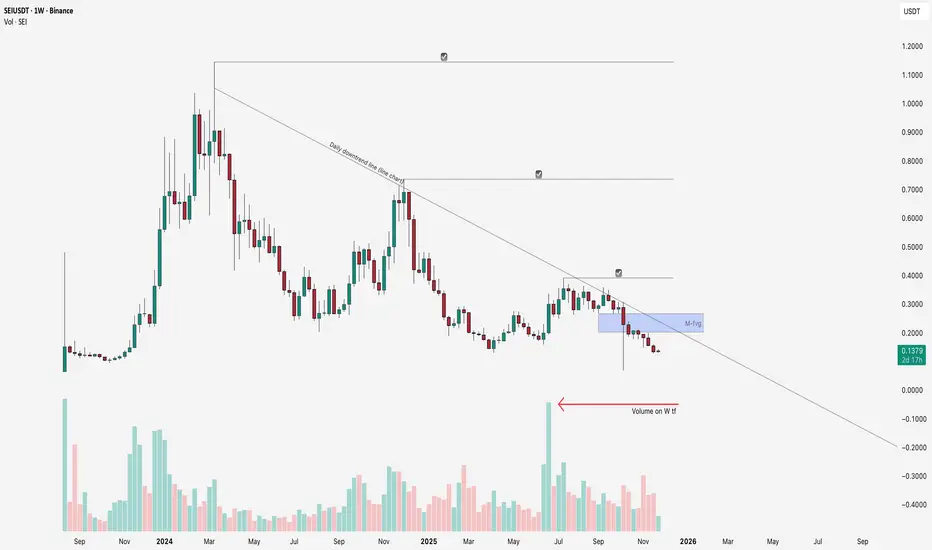
Sei need a volume for continuationIf we take a look on Weekly chart and volumes! It's so important to see new volume inflow!
Otherwise its can be long sideways till end of winter. BINANCE:SEIUSDT
The first key resistance for Sei will be Daily downtrend line (on a line chart we can cut all noise) and find out the key points!
Next resistance zone will be a Monthly full fill FVG.
All liquidity pools this is logical zones for uptrend where we can see the pullbacks!
Conservative target can be around psychological 1$ price level! There i think will be a lot of limits and seller pressure!
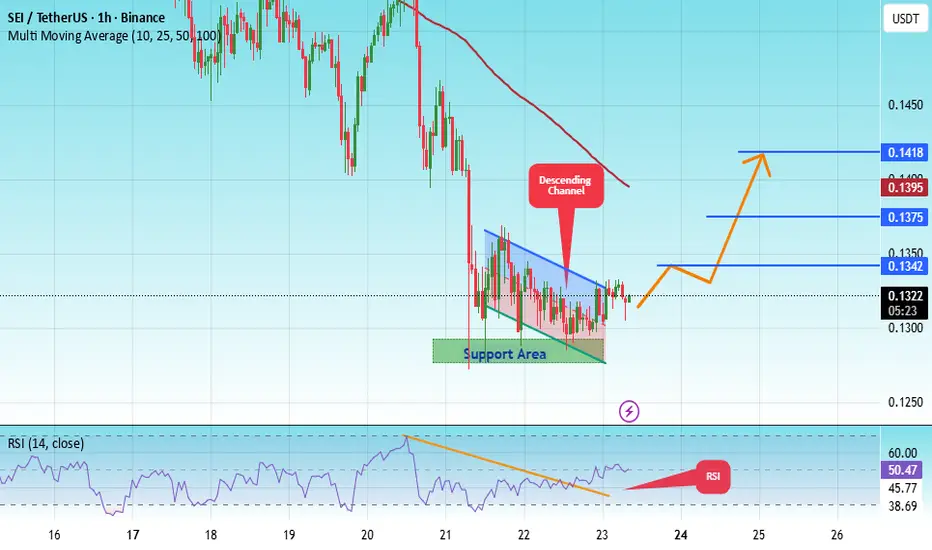
#SEI/USDT - Final Support Before a Major Reversal or Breakdown#SEI
The price is moving within an ascending channel on the 1-hour timeframe and is adhering to it well. It is poised to break out strongly and retest the channel.
We have a downtrend line on the RSI indicator that is about to break and retest, which supports the upward move.
There is a key support zone in green at 0.1280, representing a strong support point.
We have a trend of consolidation above the 100-period moving average.
Entry price: 0.1321
First target: 0.1342
Second target: 0.1375
Third target: 0.1418
Don't forget a simple money management rule:
Place your stop-loss order below the green support zone.
Once you reach the first target, save some money and then change your stop-loss order to an entry order.
For any questions, please leave a comment.
Thank you.
#SEI/USDT - Final Support Before a Major Reversal or Breakdown#SEI
The price is moving within an ascending channel on the 1-hour timeframe and is adhering to it well. It is poised to break out strongly and retest the channel.
We have a downtrend line on the RSI indicator that is about to break and retest, which supports the upward move.
There is a key support zone in green at 0.1460, representing a strong support point.
We have a trend of consolidation above the 100-period moving average.
Entry price: 0.1488
First target: 0.1508
Second target: 0.1533
Third target: 0.1564
Don't forget a simple money management rule:
Place your stop-loss order below the green support zone.
Once you reach the first target, save some money and then change your stop-loss order to an entry order.
For any questions, please leave a comment.
Thank you.

#SEI/USDT - Final Support Before a Major Reversal or Breakdown#SEI
The price is moving within an ascending channel on the 1-hour timeframe and is adhering to it well. It is poised to break out strongly and retest the channel.
We have a downtrend line on the RSI indicator that is about to break and retest, which supports the upward move.
There is a key support zone in green at 0.1600, representing a strong support point.
We have a trend of consolidation above the 100-period moving average.
Entry price: 0.1646
First target: 0.1685
Second target: 0.1733
Third target: 0.1787
Don't forget a simple money management rule:
Place your stop-loss order below the green support zone.
Once you reach the first target, save some money and then change your stop-loss order to an entry order.
For any questions, please leave a comment.
Thank you.

$SEI May be Gearing for A Bullish Move After Breaking Key LevelsThe price of NYSE:SEI might be gearing for a bullish move should the asset break above the 61.8% Fibonacci retracement. NYSE:SEI has been recording massive onchain tractions lately with a total Value lock (TVL) of $235.15m recored on the SEI blockchain as per data from DefiLama .
With the RSI at 54, there is more room for NYSE:SEI to capitalize and break the 61.8% Fib level.
About Sei
Sei is a high-performance Layer 1 blockchain that scales the EVM with parallelized execution, enabling faster transactions, low fees, and seamless smart contract deployment. Sei removes traditional blockchain bottlenecks while maintaining full Ethereum compatibility.
The upcoming Giga upgrade will deliver 50x improvements in EVM throughput, optimizing execution, consensus, and storage to push blockchain performance to web2 levels.

#SEI/USDT - Final Support Before a Major Reversal or Breakdown#SEI
The price is moving within an ascending channel on the 1-hour timeframe and is adhering to it well. It is poised to break out strongly and retest the channel.
We have a downtrend line on the RSI indicator that is about to break and retest, which supports the upward move.
There is a key support zone in green at the 0.1600 price level, representing a strong support point.
We have a trend of consolidation above the 100-period moving average.
Entry price: 0.1628
First target: 0.1628
Second target: 0.1680
Third target: 0.1719
Don't forget a simple money management rule:
Place your stop-loss order below the green support zone.
Once you reach the first target, save some money and then change your stop-loss order to an entry order.
For any questions, please leave a comment.
Thank you.

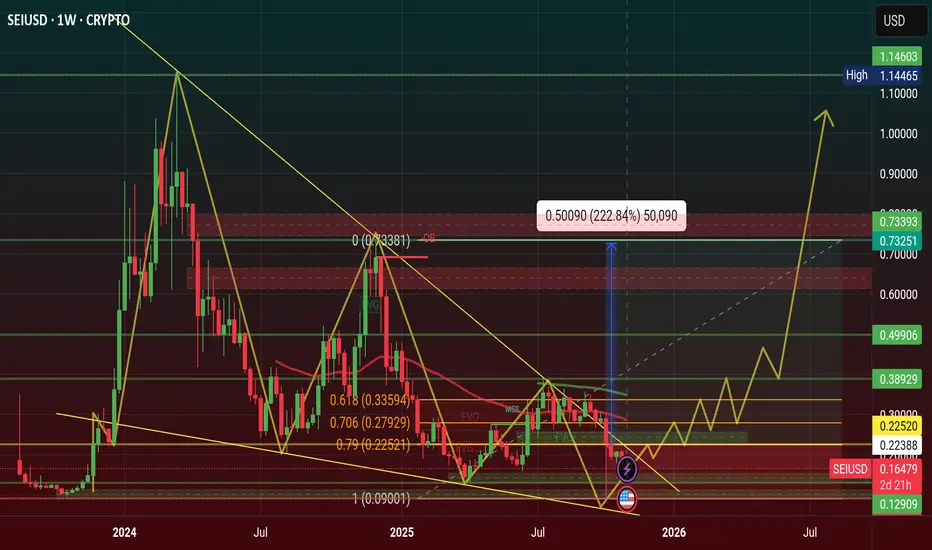
$SEI Price will hit $1.22 in 2026, Falling Wedge Pattern WeeklySEI price is showing a Bullish Pattern of Falling Wedge Pattern, when this pattern will create on chart after price will be upward direction.
Price Will hit $1.11 in 2026 and 2027 is $2.22, $3.33
Entry Point is $0.22, $0.27, $0.33 and Stoploss point $0.09
2026 Target point $0.49, $0.77, $1.11
2027 Target point $2.22, $3.33
#trending #Highlight #trendingideas #SEI #SUBROOFFICIAL
Disclaimer: This article is for informational purposes only and does not constitute financial advice. Always conduct your own research before making any investment decisions. Digital asset prices are subject to high market risk and price volatility. The value of your investment may go down or up, and you may not get back the amount invested. You are solely responsible for your investment decisions and Binance is not available for any losses you may incur. Past performance is not a reliable predictor of future performance. You should only invest in products you are familiar with and where you understand the risks. You should carefully consider your investment experience, financial situation, investment objectives and risk tolerance and consult an independent financial adviser prior to making any investment.
SEI/USDT - Final Support Before a Major Reversal or Breakdown?🔍 Overview
SEI’s price is currently standing at the most crucial zone of the past year: 0.185–0.160 — an area that has repeatedly acted as a major reversal point in the past.
The recent movement shows a “liquidity sweep” below the yellow block, followed by a sharp recovery candle — a clear sign of aggressive buying reaction from traders viewing this area as a potential discount zone.
If this zone manages to hold once again, SEI could be forming a bottoming phase, potentially triggering a mid-term reversal. However, if it fails, the door toward a deeper structure around 0.12–0.09 will open widely.
---
📈 Technical Structure & Price Pattern
Primary trend: still in a medium-term downtrend, forming a sequence of lower highs since mid-2024.
Pattern formation: Accumulation Range / Potential Double Bottom at the 0.185–0.160 demand zone.
Reaction candle: a long lower wick indicates liquidity grab before a possible reversal.
Main demand zone (yellow block): 0.185 – 0.160.
Key resistance levels: 0.275 → 0.354 → 0.467 → 0.606.
Major psychological level: 1.00 as the macro target if a full reversal occurs.
---
🟢 Bullish Scenario — Reversal from the Discount Zone
1. Main key: the 0.185–0.160 zone must hold with a 3D candle close above 0.22.
2. Further confirmation: a breakout above 0.275 will shift the structure into higher highs.
3. Progressive targets:
Short-term: 0.275
Mid-term: 0.354
Extended target: 0.467 – 0.606
4. Increasing volume on breakout strengthens the bullish momentum, opening room for a potential 70–150% rally from current support levels.
5. Entry strategy: accumulate gradually within the demand zone, with a disciplined stop loss below 0.155.
---
🔴 Bearish Scenario — Deeper Breakdown
1. If the 3D candle closes below 0.160, the major support structure officially breaks.
2. Next correction targets: 0.12 – 0.09, aligning with previous lows.
3. Selling pressure may intensify as long-term holders panic on the breakdown of a major support zone.
4. Additional validation: failure to retest 0.185 after the breakdown → confirms a solid bearish continuation.
---
⚖️ Conclusion & Strategy
The 0.185–0.160 zone marks the line between hope and capitulation for SEI.
If it holds, a major reversal with significant upside potential could emerge. But if it fails, a final capitulation phase may occur before a deeper structural bottom forms.
Maintain a disciplined approach: buy only at support, cut losses quickly if invalidated, and wait for 3D candle confirmation for direction clarity.
---
#SEIUSDT #SEI #CryptoAnalysis #AltcoinBreakdown #SupportZone #SwingTrade #TechnicalAnalysis #CryptoMarket #SEITrading #MarketStructure #PriceAction

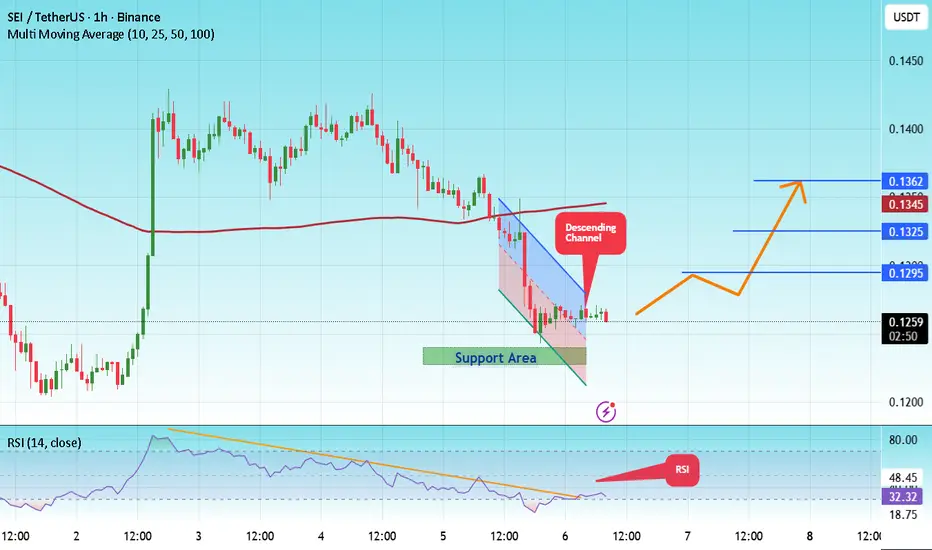
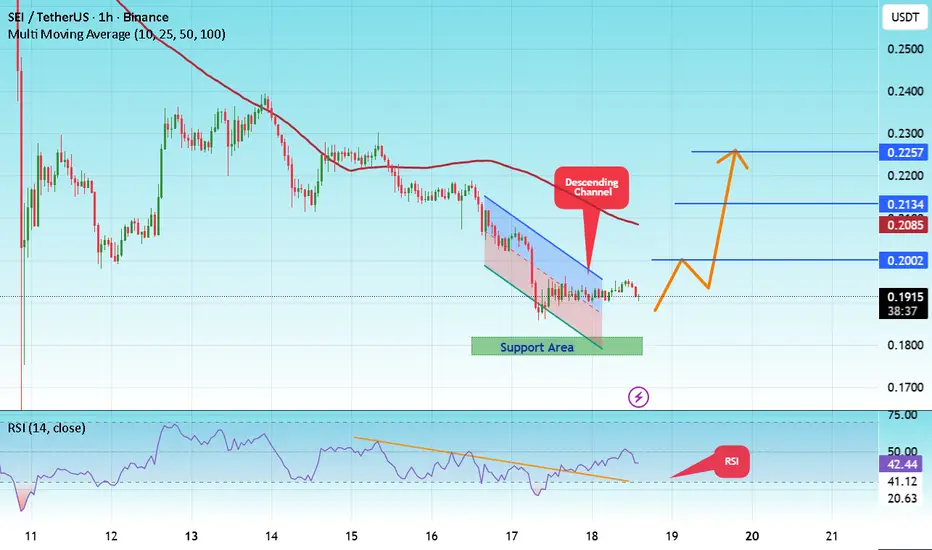
#SEI/USDT — Triangle Pattern Breakout Ahead?#SEI
The price is moving in a descending channel on the 1-hour frame and is expected to break it and continue upward.
We have a trend to stabilize above the 100 moving average once again.
We have a downtrend on the RSI indicator that supports the upward move with a breakout.
We have a major support area in green that pushed the price higher at 0.1790.
Entry price: 0.1916.
First target: 0.2000.
Second target: 0.2134.
Third target: 0.2257.
To manage risk, don't forget stop loss and capital management.
When you reach the first target, save some profits and then change the stop order to an entry order.
For inquiries, please comment.
Thank you.
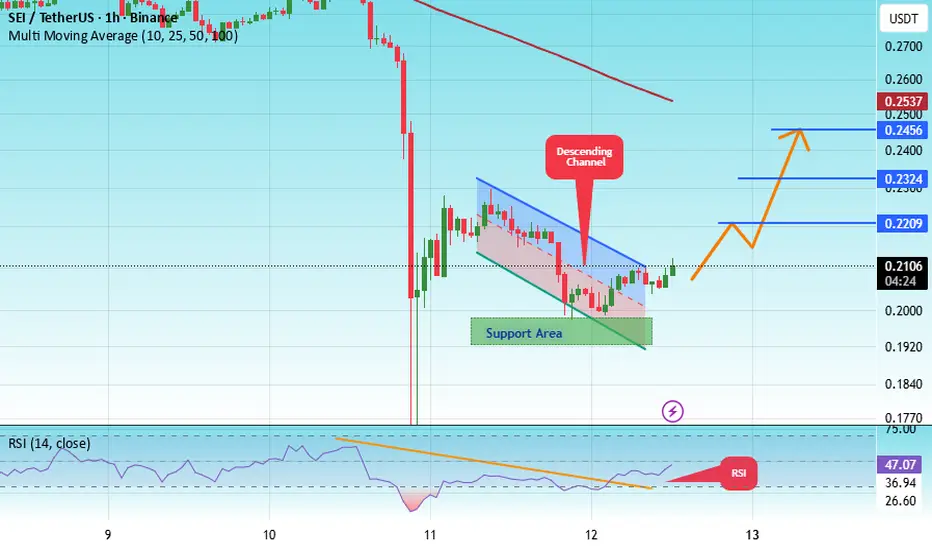
#SEI/USDT — Triangle Pattern Breakout Ahead?#SEI
The price is moving within a descending channel on the 1-hour frame, adhering well to it, and is heading for a strong breakout and retest.
We have a bearish trend on the RSI indicator that is about to be broken and retested, which supports the upward breakout.
There is a major support area in green at 0.1950, which represents a strong support point.
We are heading for stability above the 100 moving average.
Entry price: 0.2110
First target: 0.2210
Second target: 0.2324
Third target: 0.2456
Don't forget a simple matter: capital management.
When you reach the first target, save some money and then change your stop-loss order to an entry order.
For inquiries, please leave a comment.
Thank you.
SEI/USDT;BUY LIMITHello friends
Given that the price has reached the specified support and the price is supported by buyers within the specified range and the specified resistance has been broken, we can buy in steps with risk and capital management and move to the specified targets.
*Trade safely with us*

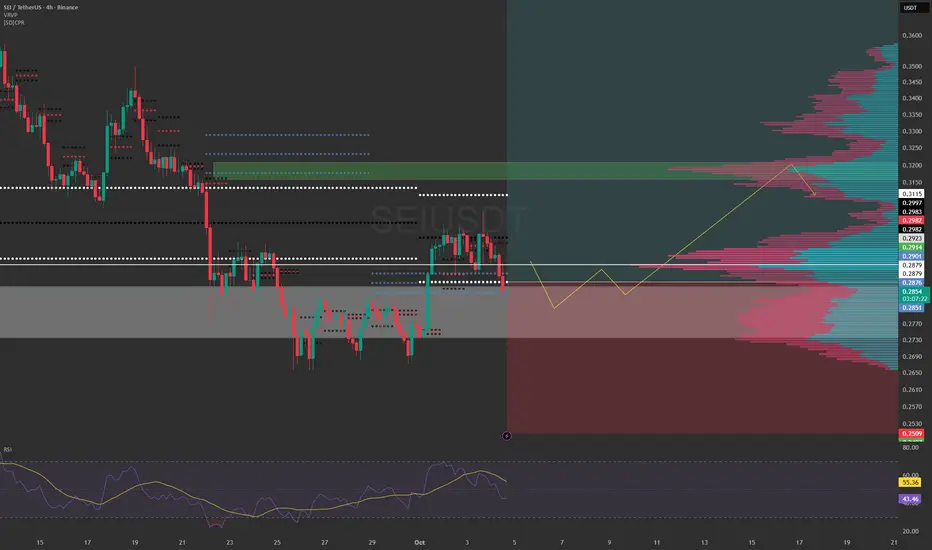
SEIUSDT Swing trader with patience.Today I have a Long opened on SEIUSDT, it is between the CPR level and the OB LVL + GAP, I have set a large stop loss, so we can give.
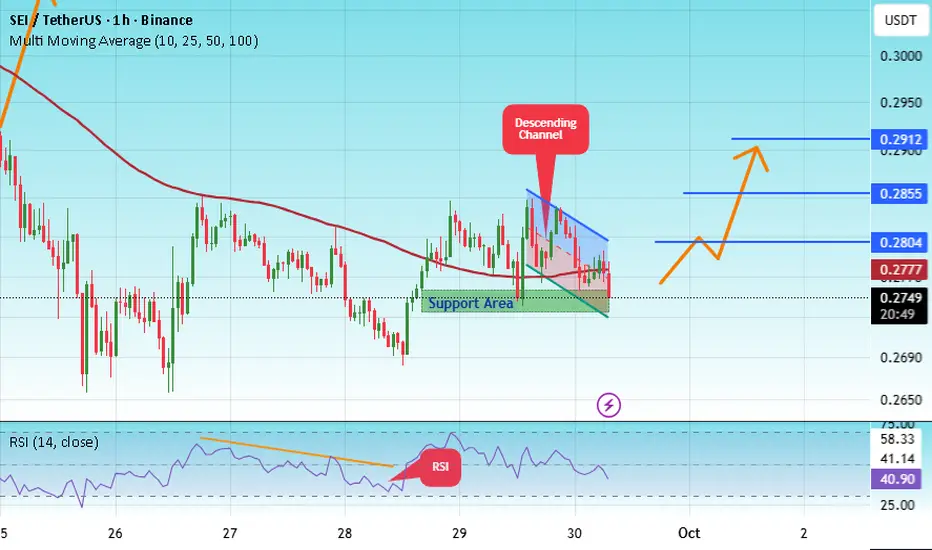
#SEI/USDT — Triangle Pattern Breakout Ahead?#SEI
The price is moving within a descending channel on the 1-hour frame, adhering well to it, and is heading for a strong breakout and retest.
We have a bearish trend on the RSI indicator that is about to be broken and retested, which supports the upward breakout.
There is a major support area in green at 0.2736, representing a strong support point.
We are heading for consolidation above the 100 moving average.
Entry price: 0.2756
First target: 0.2804
Second target: 0.2855
Third target: 0.2912
Don't forget a simple matter: capital management.
When you reach the first target, save some money and then change your stop-loss order to an entry order.
For inquiries, please leave a comment.
Thank you.
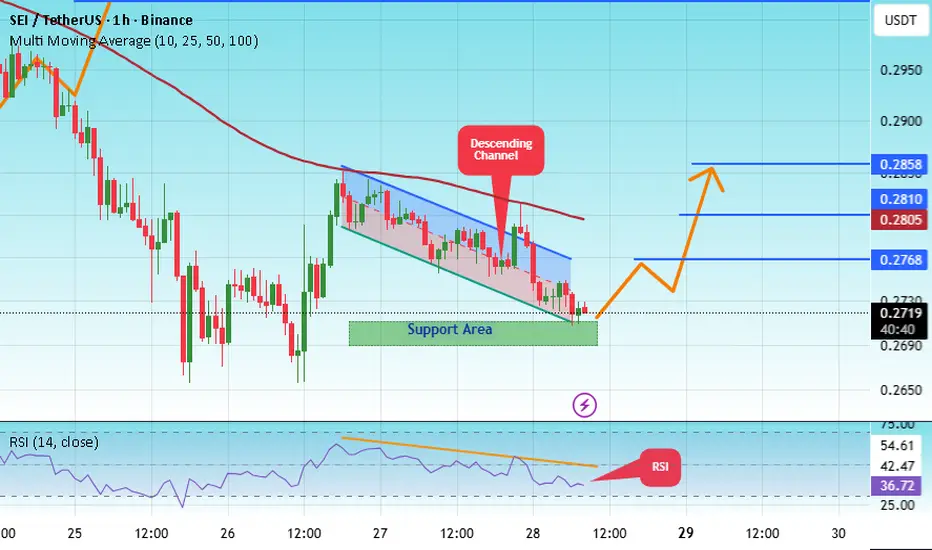
#SEI/USDT — Triangle Pattern Breakout Ahead?#SEI
The price is moving within a descending channel on the 1-hour frame, adhering well to it, and is heading for a strong breakout and retest.
We have a bearish trend on the RSI indicator that is about to be broken and retested, which supports the upward breakout.
There is a major support area in green at 0.2700, which represents a strong support point.
We are heading for consolidation above the 100 moving average.
Entry price: 0.2721
First target: 0.2768
Second target: 0.2805
Third target: 0.2858
Don't forget a simple matter: capital management.
When you reach the first target, save some money and then change your stop-loss order to an entry order.
For inquiries, please leave a comment.
Thank you.
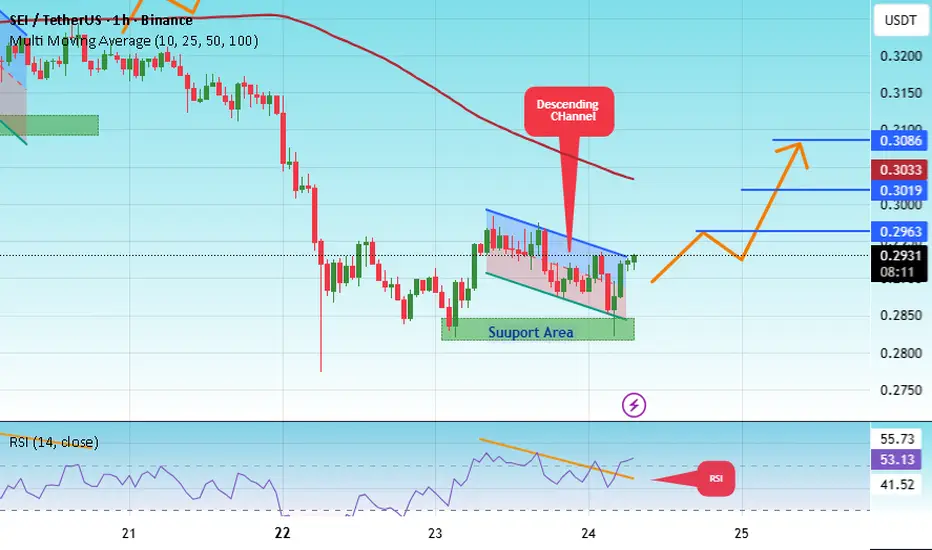
#SEI/USDT — Triangle Pattern Breakout Ahead?#SEI
The price is moving within a descending channel on the 1-hour frame, adhering well to it, and is heading for a strong breakout and retest.
We have a bearish trend on the RSI indicator that is about to be broken and retested, which supports the upward breakout.
There is a major support area in green at 0.2830, representing a strong support point.
We are heading for consolidation above the 100 moving average.
Entry price: 0.02913
First target: 0.2963
Second target: 0.3020
Third target: 0.3086
Don't forget a simple matter: capital management.
When you reach the first target, save some money and then change your stop-loss order to an entry order.
For inquiries, please leave a comment.
Thank you.