Why Did The Market Bounce Today? Today the market bounced for 2 reasons....
1. Broadcom NASDAQ:AVGO received news of another OPENAI partnership. This multi year billion dollar deal caused the stock to bounce double digits. When this name rallies it causes liquidity to flow into the $SOXX. Semiconductors are still the heartbeat of this market and have propped everything up today.
The OPENAI headline seems to be running out of steam as the last 3 partnership announcements caused 3 stock to make new highs but AVGO did not take out its highs. This will be on watch.
2. The bond market was closed today allowing investors to not have to worry about catalysts or yields. There's an old saying on "when the cats away, the mice will play" .
The bond market is the much larger investment market aka the "cat" and this liquidity has clearly spilled over into smaller cap higher beta stocks.
Tomorrow we will see if the markets can take out the 20 day Moving average or if this pop gets sold into.
SERV

Serve Robotics Inc. (NASDAQ: SERV) – Bullish Setup EmergingServe Robotics NASDAQ:SERV is revolutionizing last-mile logistics with AI-powered delivery robots, offering strong exposure to the booming robotics and automation sector. The company's recent momentum and strategic partnerships signal major upside potential.
🔍 Key Drivers:
📈 Explosive Growth:
Q2 2025 revenue up 46% YoY
Deliveries jumped 80% QoQ
Clear signs of scaling and market demand
🤝 Uber Eats Partnership:
Multi-year deal to deploy 2,000 Gen3 robots in U.S. cities, including Chicago
Unlocks access to the projected $160B autonomous food delivery market by 2030
🌍 Long-Term Outlook:
Tied to ARK Invest’s $860B global robotics forecast
Targeting $60–80M annualized revenue once fully scaled
💰 Backed by Giants:
Supported by Uber and Nvidia
$167M raised in 2024 to fund expansion and AI development
📊 Trade Setup:
Bullish above: $12.00–$12.50
Upside target: $23.00–$24.00
Trend outlook: Strong momentum, backed by fundamentals and market demand
SERV ( Serve Robotics Inc ) - Stock ... looking JUICY !!!Talked about this on todays Live Stream
Broke out of side ways accumulation
VERY nice retrace then broke resistance level
to come back to retest and break out of zone
- Would like to see a 9% - 10% pull back
before the upside continuation
Instructions on chart
NFA - Not Financial Advice
Join the Streams for Free Mentorship

SERV | Informative NASDAQ:SERV
--Trend Context:
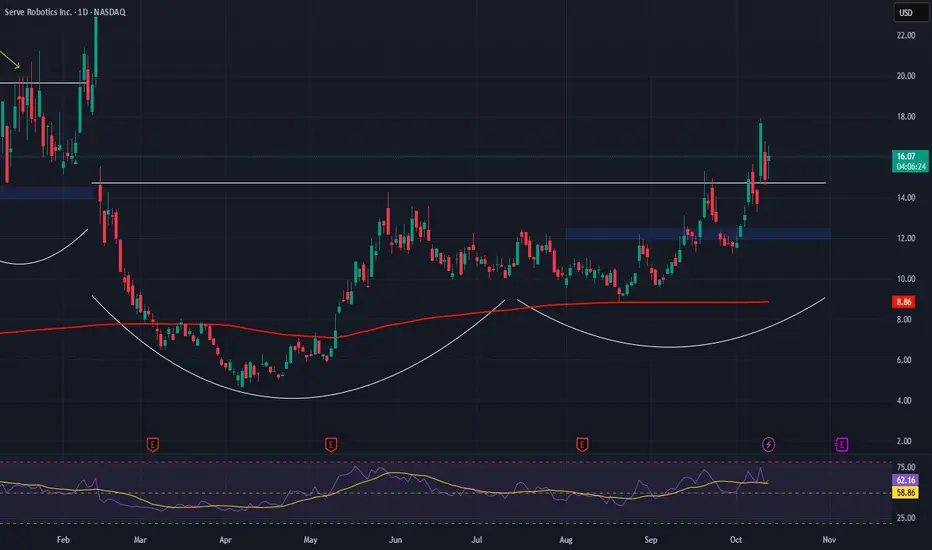
After a brutal selloff earlier this year, SERV formed a rounded base and is now in an emerging uptrend of higher lows (HL) and higher highs (HH). Price is pressing into a major descending trendline from prior peaks, a spot where big money decides direction.
--Red Line (EMA 100):
Recently reclaimed with strength → signals buyers have regained control.
EMA 100 now acting as dynamic support around ~$11.97.
Volume Profile (Right side histogram):
Heavy volume node at $11.97 → $13.25 → this is the “control zone” where price has memory and institutions transact.
Above $15.50 → volume gap → thin liquidity = if broken, price can accelerate rapidly to $23+.
--------------------------------------------------------------------------
--Levels of Interest
//Immediate Resistance:
$13.25 (current battle zone) – price is consolidating here.
$15.52 – critical breakout level → above this, momentum ignites.
//Major Resistance:
$23.97 – previous peak and volume shelf top.
//Support Zones:
$11.97 → EMA 100 + high-volume node = strong support.
$10.71 → backup support.
$8.14 → deep invalidation (trend failure if broken).
--------------------------------------------------------------------------
--Market Psychology
Sellers controlled from the highs near $24 → cascade of lower highs (LHs) until summer.
But now, buyers are showing aggression with a sequence of HLs, driving price back into resistance.
Volume profile shows the “smart money” zone around $12–13. If price holds above it, it signals institutional accumulation.
--------------------------------------------------------------------------
--Probability Outlook
//Bullish Breakout (Primary Bias):
If SERV clears $15.52 with strong volume → expect momentum run toward $18 → $23.97.
Thin volume above $15.5 means price can move fast, with fewer obstacles.
//Bearish Rejection (Secondary Bias):
Failure at $13.25–15.5 zone → pullback to $11.97.
If $11.97 breaks, $10.71 becomes the line in the sand.
--------------------------------------------------------------------------
--Strategic Positioning
//For Traders:
Entry: On breakout close > $15.52.
Stop: Below $11.97 (EMA 100 and HVN cluster).
Targets: $18 → $23.97.
R:R ~1:4 (excellent setup).
//For Swing Players:
Accumulate dips near $12–13 if defended.
Risk only below $10.71.
Potential to ride multi-week breakout leg.
--------------------------------------------------------------------------
This chart is a classic coil before eruption. You have a tight range inside a larger descending wedge, reclaim of EMA 100, and building HLs → textbook accumulation pattern.
Institutions are loading in the $12–13 zone. If SERV takes out $15.5 with conviction, it’s not just a breakout—it’s a sentiment shift that could unleash a rally back to $23+, a near 70% upside move.
But discipline rules: if it loses $11.97, you step aside and let it reset.

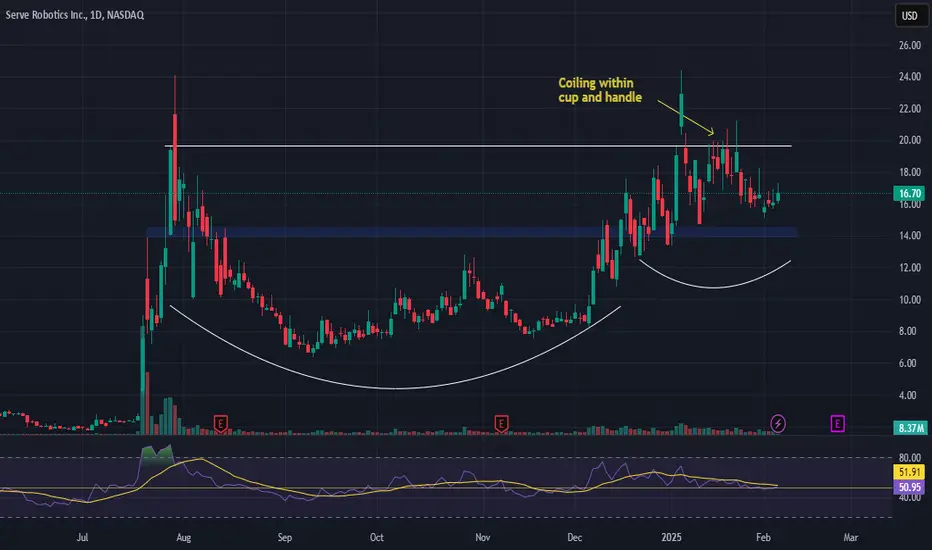
Nvidia $SERV'd this one! Massive move still on the table!NASDAQ:SERV
NASDAQ:NVDA selling out of this one crushed this name but...
- The CupnHandle is still intact IF this is indeed bottom.
- Volume Shelf and S/R Zone here
- Right at smoothing line which has historically held pretty well.
Only time will tell but if we come back up and break out of this CupnHandle at $24.32 we are going to...
🎯 $42
Not financial advice

Serve Robotics (SERV) Analysis Company Overview:
Serve Robotics NASDAQ:SERV is a pioneer in autonomous last-mile delivery, leveraging AI-driven electric robots to reduce costs and emissions. With strong partnerships and financial backing, SERV is positioned to disrupt traditional delivery models.
Key Catalysts:
$450 Billion Market Potential by 2030 🌎
Serve’s $1-per-trip model could revolutionize delivery economics.
Strategic Partnerships – Uber & 7-Eleven 📦
Uber’s $11.5M investment and integration with Uber Eats enhance scale.
7-Eleven partnership strengthens Serve’s retail delivery presence.
Strong Financial Backing – Secured Through 2026 💰
$166M raised since December 2024, ensuring funding stability.
NVIDIA and Delivery Hero investments validate AI-driven robotics.
Investment Outlook:
Bullish Case: We are bullish on SERV above $14.00-$14.50, supported by disruptive potential, strategic partnerships, and financial strength.
Upside Potential: Our price target is $31.00-$32.00, reflecting market expansion, AI adoption, and industry transformation.
📢 Serve Robotics—Redefining Last-Mile Delivery. #AI #Robotics #AutonomousDelivery #SERV
SERV.N - Possible BreakoutCup and Handle formation, with a breakout pending
Golden Crossover has already taken place, highlighted on yellow circle.
Upside of 195 with a stop loss shown.
Watch out for breakout!
DDYOR. NOT FA.

SERV - Potential Short 5th Wave SwingTrading OpportunityUsing our Elliott Wave Indicator Suite for the TradingView Platform we have identified a potential Short 5th Wave Swing Trading Opportunity for SERV on the Daily time frame . The 5th wave move in an elliottwave sequence is the highest probability move.
The wave 4 pull back has found resistance in the Green zone of our probability pullback zones, which represents an 85% probability that our automated 5th wave target zone, in blue on the chart, will be hit.
We see yellow dots formed in the oversold zone on our special False Breakout Stochastic indicator, which signals strong Bearish momentum. When, during a wave 4 pullback, the stochastic pulls back against these false break out dots and crosses in the overbought zone, there is a high probability the stocks price action will resume the overall bearish trend .
We also measure the wave 4 behaviour with our Elliottwave oscillator, which has pulled back within our pre-determined zone.
So overall we have identified, using our Elliott Wave Indicator suite for TradingView, a high probability short swing trading opportunity for SERV , Daily Time Frame , with the following entry strategy:
Short entry through $37.72
Stop Loss $40.78
Target $31.50
Giving a Risk to Reward of 1:2
Learn more about our Tradingview indicator suites by watching the video tours >>HERE<<

SERV ($SERV) Flat base + VolumeBought SERV today considering that the stock has been showing a flat base after a bullish trend and the close price during the last 12 weeks has been consistent with small fluctuations.
The stock volume during the last 4 few weeks was under the average for the last 5, 10 and 20 weeks, so this could mean that the current stock owners don't have the intention to sell it at the current price, forcing it to a price increase in the near future.

SERV - Inverted Fallen angel formation from $44.07 to $40.53SERV is showing downward momentum in daily frame, however in the weekly frame it seems forming an inverted Fallen angel formation. We think it has good downside potential.
* Trade Criteria *
Date First Found- October 30, 2017
Pattern/Why- Possible inverted Fallen Angel pattern (weekly chart)
Entry Target Criteria- Break of $44.07
Exit Target Criteria- $40.53
Stop Loss Criteria- $ 45.93
Please check back for Trade updates. (Note: Trade update is little delayed here.)
